Immigrants from Northern Europe 3 or more Vehicles in Household
COMPARE
Immigrants from Northern Europe
Select to Compare
3 or more Vehicles in Household
Immigrants from Northern Europe 3 or more Vehicles in Household
19.5%
3+ VEHICLES AVAILABLE
50.2/ 100
METRIC RATING
173rd/ 347
METRIC RANK
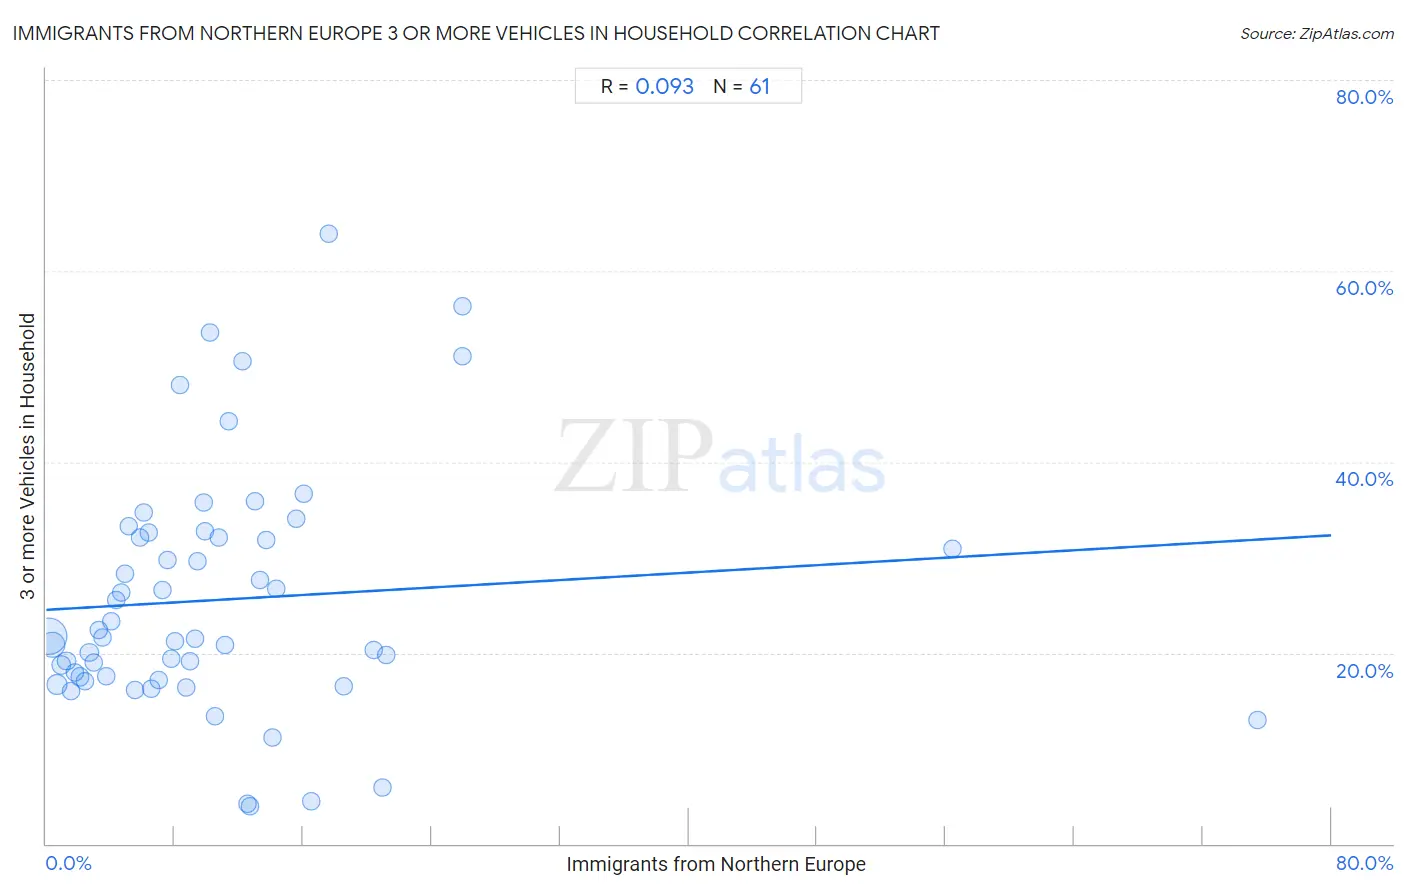
Immigrants from Northern Europe 3 or more Vehicles in Household Correlation Chart
The statistical analysis conducted on geographies consisting of 476,757,527 people shows a slight positive correlation between the proportion of Immigrants from Northern Europe and percentage of households with 3 or more vehicles available in the United States with a correlation coefficient (R) of 0.093 and weighted average of 19.5%. On average, for every 1% (one percent) increase in Immigrants from Northern Europe within a typical geography, there is an increase of 0.098% in percentage of households with 3 or more vehicles available.
It is essential to understand that the correlation between the percentage of Immigrants from Northern Europe and percentage of households with 3 or more vehicles available does not imply a direct cause-and-effect relationship. It remains uncertain whether the presence of Immigrants from Northern Europe influences an upward or downward trend in the level of percentage of households with 3 or more vehicles available within an area, or if Immigrants from Northern Europe simply ended up residing in those areas with higher or lower levels of percentage of households with 3 or more vehicles available due to other factors.
Demographics Similar to Immigrants from Northern Europe by 3 or more Vehicles in Household
In terms of 3 or more vehicles in household, the demographic groups most similar to Immigrants from Northern Europe are Immigrants from South Africa (19.5%, a difference of 0.020%), Kiowa (19.5%, a difference of 0.050%), Immigrants from Western Europe (19.5%, a difference of 0.23%), Syrian (19.5%, a difference of 0.25%), and Iroquois (19.4%, a difference of 0.32%).
| Demographics | Rating | Rank | 3 or more Vehicles in Household |
| Immigrants from Cameroon | 60.9 /100 | #166 | Good 19.7% |
| Ukrainians | 58.9 /100 | #167 | Average 19.6% |
| Peruvians | 58.8 /100 | #168 | Average 19.6% |
| Immigrants from Denmark | 57.6 /100 | #169 | Average 19.6% |
| Iraqis | 56.0 /100 | #170 | Average 19.6% |
| Immigrants from Western Europe | 53.2 /100 | #171 | Average 19.5% |
| Kiowa | 50.9 /100 | #172 | Average 19.5% |
| Immigrants from Northern Europe | 50.2 /100 | #173 | Average 19.5% |
| Immigrants from South Africa | 50.0 /100 | #174 | Average 19.5% |
| Syrians | 47.0 /100 | #175 | Average 19.5% |
| Iroquois | 46.0 /100 | #176 | Average 19.4% |
| Immigrants from Peru | 41.1 /100 | #177 | Average 19.4% |
| Immigrants from Syria | 40.3 /100 | #178 | Average 19.4% |
| Immigrants from South Central Asia | 38.9 /100 | #179 | Fair 19.3% |
| South Africans | 37.5 /100 | #180 | Fair 19.3% |
Immigrants from Northern Europe 3 or more Vehicles in Household Correlation Summary
| Measurement | Immigrants from Northern Europe Data | 3 or more Vehicles in Household Data |
| Minimum | 0.13% | 3.9% |
| Maximum | 75.4% | 63.8% |
| Range | 75.3% | 59.9% |
| Mean | 11.0% | 25.6% |
| Median | 8.7% | 21.6% |
| Interquartile 25% (IQ1) | 4.2% | 17.3% |
| Interquartile 75% (IQ3) | 13.5% | 32.3% |
| Interquartile Range (IQR) | 9.3% | 15.0% |
| Standard Deviation (Sample) | 12.1% | 12.7% |
| Standard Deviation (Population) | 12.0% | 12.6% |
Correlation Details
| Immigrants from Northern Europe Percentile | Sample Size | 3 or more Vehicles in Household |
[ 0.0% - 0.5% ] 0.13% | 272,036,681 | 21.8% |
[ 0.0% - 0.5% ] 0.40% | 115,532,177 | 20.8% |
[ 0.5% - 1.0% ] 0.66% | 50,596,146 | 16.7% |
[ 0.5% - 1.0% ] 0.97% | 18,367,920 | 18.7% |
[ 1.0% - 1.5% ] 1.26% | 8,696,617 | 19.2% |
[ 1.5% - 2.0% ] 1.55% | 5,108,014 | 16.0% |
[ 1.5% - 2.0% ] 1.81% | 2,215,737 | 17.9% |
[ 2.0% - 2.5% ] 2.08% | 1,579,623 | 17.5% |
[ 2.0% - 2.5% ] 2.38% | 760,282 | 17.0% |
[ 2.5% - 3.0% ] 2.68% | 489,014 | 20.0% |
[ 2.5% - 3.0% ] 2.96% | 303,414 | 19.0% |
[ 3.0% - 3.5% ] 3.23% | 262,911 | 22.4% |
[ 3.5% - 4.0% ] 3.52% | 208,292 | 21.6% |
[ 3.5% - 4.0% ] 3.77% | 180,060 | 17.6% |
[ 4.0% - 4.5% ] 4.07% | 92,567 | 23.3% |
[ 4.0% - 4.5% ] 4.34% | 75,408 | 25.6% |
[ 4.5% - 5.0% ] 4.67% | 54,724 | 26.3% |
[ 4.5% - 5.0% ] 4.93% | 26,824 | 28.2% |
[ 5.0% - 5.5% ] 5.15% | 24,427 | 33.2% |
[ 5.0% - 5.5% ] 5.49% | 47,206 | 16.1% |
[ 5.5% - 6.0% ] 5.87% | 24,928 | 32.0% |
[ 6.0% - 6.5% ] 6.07% | 2,406 | 34.8% |
[ 6.0% - 6.5% ] 6.41% | 7,287 | 32.6% |
[ 6.5% - 7.0% ] 6.55% | 18,169 | 16.3% |
[ 6.5% - 7.0% ] 6.97% | 11,969 | 17.2% |
[ 7.0% - 7.5% ] 7.27% | 5,861 | 26.6% |
[ 7.5% - 8.0% ] 7.53% | 2,920 | 29.7% |
[ 7.5% - 8.0% ] 7.76% | 2,462 | 19.3% |
[ 8.0% - 8.5% ] 8.02% | 4,636 | 21.2% |
[ 8.0% - 8.5% ] 8.33% | 876 | 48.1% |
[ 8.5% - 9.0% ] 8.68% | 864 | 16.4% |
[ 8.5% - 9.0% ] 8.97% | 1,483 | 19.1% |
[ 9.0% - 9.5% ] 9.26% | 993 | 21.5% |
[ 9.0% - 9.5% ] 9.41% | 680 | 29.6% |
[ 9.5% - 10.0% ] 9.82% | 550 | 35.7% |
[ 9.5% - 10.0% ] 9.92% | 595 | 32.8% |
[ 10.0% - 10.5% ] 10.23% | 567 | 53.5% |
[ 10.0% - 10.5% ] 10.49% | 991 | 13.3% |
[ 10.5% - 11.0% ] 10.76% | 1,264 | 32.0% |
[ 11.0% - 11.5% ] 11.14% | 2,540 | 20.8% |
[ 11.0% - 11.5% ] 11.40% | 623 | 44.2% |
[ 12.0% - 12.5% ] 12.22% | 180 | 50.6% |
[ 12.0% - 12.5% ] 12.50% | 40 | 4.2% |
[ 12.5% - 13.0% ] 12.72% | 747 | 3.9% |
[ 13.0% - 13.5% ] 13.03% | 238 | 35.9% |
[ 13.0% - 13.5% ] 13.33% | 60 | 27.6% |
[ 13.5% - 14.0% ] 13.66% | 366 | 31.9% |
[ 14.0% - 14.5% ] 14.08% | 625 | 11.2% |
[ 14.0% - 14.5% ] 14.35% | 230 | 26.7% |
[ 15.5% - 16.0% ] 15.53% | 953 | 34.0% |
[ 16.0% - 16.5% ] 16.04% | 636 | 36.6% |
[ 16.0% - 16.5% ] 16.50% | 491 | 4.5% |
[ 17.5% - 18.0% ] 17.61% | 352 | 63.8% |
[ 18.0% - 18.5% ] 18.49% | 119 | 16.4% |
[ 20.0% - 20.5% ] 20.35% | 285 | 20.3% |
[ 20.5% - 21.0% ] 20.90% | 244 | 5.9% |
[ 21.0% - 21.5% ] 21.19% | 453 | 19.7% |
[ 25.5% - 26.0% ] 25.93% | 54 | 56.2% |
[ 25.5% - 26.0% ] 25.95% | 185 | 51.0% |
[ 56.0% - 56.5% ] 56.39% | 321 | 30.9% |
[ 75.0% - 75.5% ] 75.42% | 240 | 13.0% |