Immigrants from Bolivia 3 or more Vehicles in Household
COMPARE
Immigrants from Bolivia
Select to Compare
3 or more Vehicles in Household
Immigrants from Bolivia 3 or more Vehicles in Household
20.4%
3+ VEHICLES AVAILABLE
92.0/ 100
METRIC RATING
127th/ 347
METRIC RANK
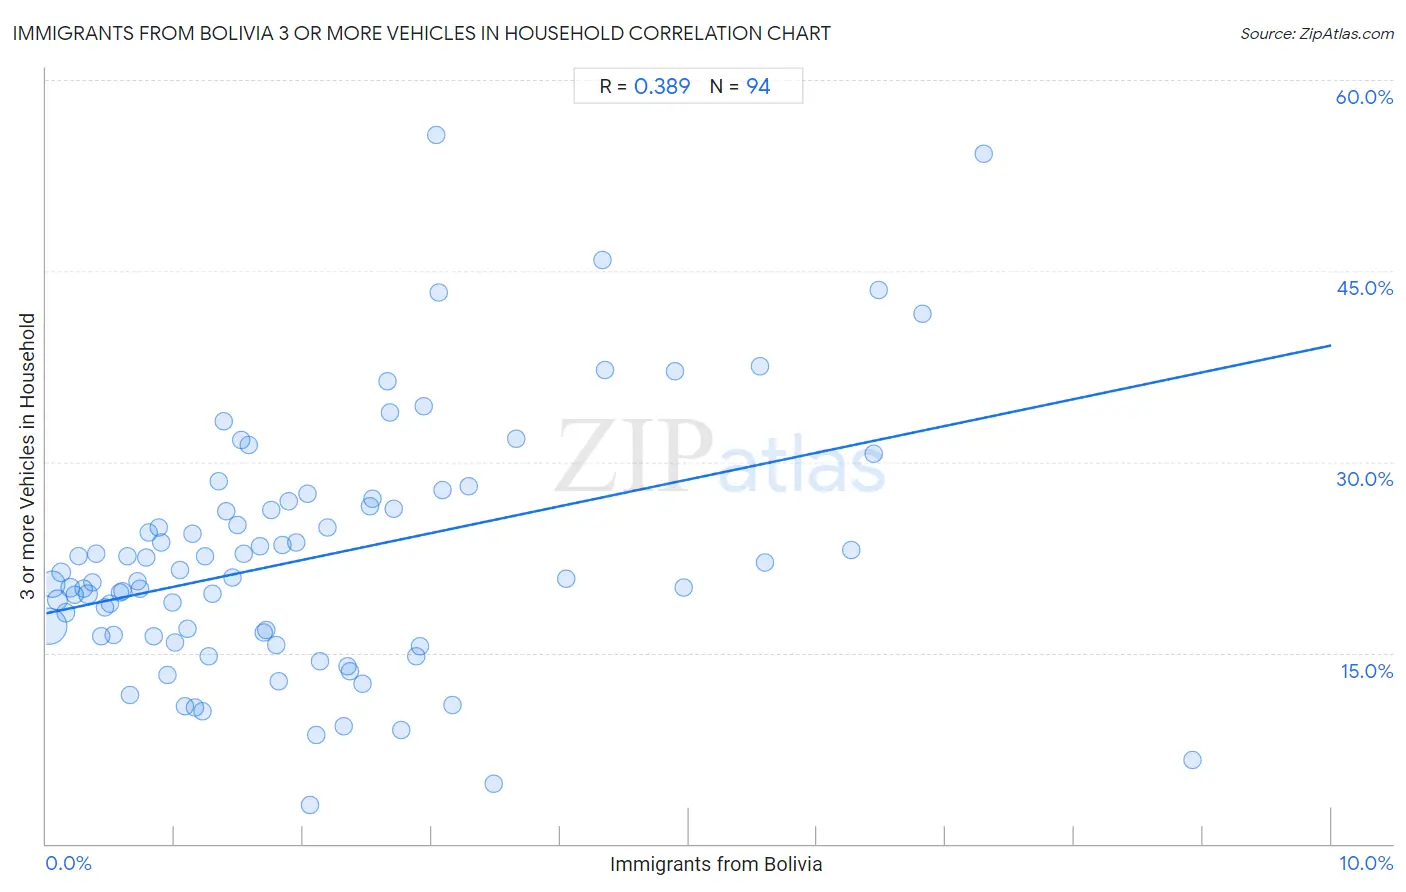
Immigrants from Bolivia 3 or more Vehicles in Household Correlation Chart
The statistical analysis conducted on geographies consisting of 158,700,588 people shows a mild positive correlation between the proportion of Immigrants from Bolivia and percentage of households with 3 or more vehicles available in the United States with a correlation coefficient (R) of 0.389 and weighted average of 20.4%. On average, for every 1% (one percent) increase in Immigrants from Bolivia within a typical geography, there is an increase of 2.1% in percentage of households with 3 or more vehicles available.
It is essential to understand that the correlation between the percentage of Immigrants from Bolivia and percentage of households with 3 or more vehicles available does not imply a direct cause-and-effect relationship. It remains uncertain whether the presence of Immigrants from Bolivia influences an upward or downward trend in the level of percentage of households with 3 or more vehicles available within an area, or if Immigrants from Bolivia simply ended up residing in those areas with higher or lower levels of percentage of households with 3 or more vehicles available due to other factors.
Demographics Similar to Immigrants from Bolivia by 3 or more Vehicles in Household
In terms of 3 or more vehicles in household, the demographic groups most similar to Immigrants from Bolivia are Slavic (20.4%, a difference of 0.030%), New Zealander (20.4%, a difference of 0.17%), Immigrants from Netherlands (20.4%, a difference of 0.25%), Central American (20.5%, a difference of 0.28%), and Immigrants from Korea (20.5%, a difference of 0.45%).
| Demographics | Rating | Rank | 3 or more Vehicles in Household |
| Maltese | 93.9 /100 | #120 | Exceptional 20.5% |
| Immigrants from Thailand | 93.8 /100 | #121 | Exceptional 20.5% |
| German Russians | 93.7 /100 | #122 | Exceptional 20.5% |
| Immigrants from Korea | 93.7 /100 | #123 | Exceptional 20.5% |
| Central Americans | 93.1 /100 | #124 | Exceptional 20.5% |
| Immigrants from Netherlands | 92.9 /100 | #125 | Exceptional 20.4% |
| Slavs | 92.1 /100 | #126 | Exceptional 20.4% |
| Immigrants from Bolivia | 92.0 /100 | #127 | Exceptional 20.4% |
| New Zealanders | 91.3 /100 | #128 | Exceptional 20.4% |
| Zimbabweans | 88.7 /100 | #129 | Excellent 20.3% |
| Greeks | 88.6 /100 | #130 | Excellent 20.3% |
| Immigrants from Asia | 88.1 /100 | #131 | Excellent 20.2% |
| Immigrants from Canada | 87.8 /100 | #132 | Excellent 20.2% |
| Immigrants from North America | 87.8 /100 | #133 | Excellent 20.2% |
| Poles | 87.3 /100 | #134 | Excellent 20.2% |
Immigrants from Bolivia 3 or more Vehicles in Household Correlation Summary
| Measurement | Immigrants from Bolivia Data | 3 or more Vehicles in Household Data |
| Minimum | 0.017% | 3.1% |
| Maximum | 8.9% | 55.7% |
| Range | 8.9% | 52.6% |
| Mean | 2.1% | 22.5% |
| Median | 1.6% | 20.9% |
| Interquartile 25% (IQ1) | 0.80% | 16.3% |
| Interquartile 75% (IQ3) | 2.8% | 26.5% |
| Interquartile Range (IQR) | 2.0% | 10.2% |
| Standard Deviation (Sample) | 1.8% | 9.8% |
| Standard Deviation (Population) | 1.8% | 9.8% |
Correlation Details
| Immigrants from Bolivia Percentile | Sample Size | 3 or more Vehicles in Household |
[ 0.0% - 0.5% ] 0.017% | 83,887,468 | 17.1% |
[ 0.0% - 0.5% ] 0.048% | 35,286,923 | 20.4% |
[ 0.0% - 0.5% ] 0.084% | 11,400,768 | 19.1% |
[ 0.0% - 0.5% ] 0.12% | 6,151,413 | 21.3% |
[ 0.0% - 0.5% ] 0.15% | 3,871,589 | 18.1% |
[ 0.0% - 0.5% ] 0.19% | 3,578,870 | 20.1% |
[ 0.0% - 0.5% ] 0.22% | 2,228,962 | 19.6% |
[ 0.0% - 0.5% ] 0.25% | 1,463,914 | 22.6% |
[ 0.0% - 0.5% ] 0.29% | 1,156,042 | 20.0% |
[ 0.0% - 0.5% ] 0.32% | 1,424,913 | 19.6% |
[ 0.0% - 0.5% ] 0.36% | 781,153 | 20.5% |
[ 0.0% - 0.5% ] 0.39% | 616,889 | 22.8% |
[ 0.0% - 0.5% ] 0.43% | 589,737 | 16.3% |
[ 0.0% - 0.5% ] 0.45% | 504,043 | 18.5% |
[ 0.0% - 0.5% ] 0.50% | 489,335 | 18.9% |
[ 0.5% - 1.0% ] 0.53% | 349,891 | 16.4% |
[ 0.5% - 1.0% ] 0.57% | 567,687 | 19.7% |
[ 0.5% - 1.0% ] 0.59% | 191,430 | 19.9% |
[ 0.5% - 1.0% ] 0.63% | 275,710 | 22.6% |
[ 0.5% - 1.0% ] 0.66% | 235,620 | 11.7% |
[ 0.5% - 1.0% ] 0.71% | 181,087 | 20.6% |
[ 0.5% - 1.0% ] 0.73% | 157,712 | 20.1% |
[ 0.5% - 1.0% ] 0.78% | 121,214 | 22.5% |
[ 0.5% - 1.0% ] 0.80% | 214,310 | 24.4% |
[ 0.5% - 1.0% ] 0.84% | 161,533 | 16.3% |
[ 0.5% - 1.0% ] 0.87% | 231,692 | 24.8% |
[ 0.5% - 1.0% ] 0.90% | 206,292 | 23.7% |
[ 0.5% - 1.0% ] 0.95% | 154,708 | 13.2% |
[ 0.5% - 1.0% ] 0.98% | 111,618 | 18.9% |
[ 1.0% - 1.5% ] 1.00% | 96,307 | 15.8% |
[ 1.0% - 1.5% ] 1.04% | 125,771 | 21.5% |
[ 1.0% - 1.5% ] 1.08% | 298,168 | 10.8% |
[ 1.0% - 1.5% ] 1.10% | 19,401 | 16.9% |
[ 1.0% - 1.5% ] 1.14% | 105,029 | 24.3% |
[ 1.0% - 1.5% ] 1.16% | 16,620 | 10.7% |
[ 1.0% - 1.5% ] 1.22% | 31,235 | 10.4% |
[ 1.0% - 1.5% ] 1.24% | 22,339 | 22.6% |
[ 1.0% - 1.5% ] 1.26% | 40,956 | 14.7% |
[ 1.0% - 1.5% ] 1.30% | 35,353 | 19.6% |
[ 1.0% - 1.5% ] 1.34% | 5,663 | 28.5% |
[ 1.0% - 1.5% ] 1.38% | 54,699 | 33.2% |
[ 1.0% - 1.5% ] 1.40% | 36,063 | 26.1% |
[ 1.0% - 1.5% ] 1.45% | 65,223 | 20.9% |
[ 1.0% - 1.5% ] 1.48% | 118,205 | 25.1% |
[ 1.5% - 2.0% ] 1.52% | 113,497 | 31.7% |
[ 1.5% - 2.0% ] 1.54% | 21,991 | 22.8% |
[ 1.5% - 2.0% ] 1.57% | 114,723 | 31.3% |
[ 1.5% - 2.0% ] 1.67% | 120 | 23.3% |
[ 1.5% - 2.0% ] 1.69% | 19,372 | 16.6% |
[ 1.5% - 2.0% ] 1.71% | 6,649 | 16.8% |
[ 1.5% - 2.0% ] 1.75% | 24,644 | 26.3% |
[ 1.5% - 2.0% ] 1.79% | 7,057 | 15.6% |
[ 1.5% - 2.0% ] 1.81% | 1,604 | 12.7% |
[ 1.5% - 2.0% ] 1.84% | 27,734 | 23.5% |
[ 1.5% - 2.0% ] 1.89% | 65,644 | 26.9% |
[ 1.5% - 2.0% ] 1.94% | 31,022 | 23.7% |
[ 2.0% - 2.5% ] 2.03% | 45,008 | 27.5% |
[ 2.0% - 2.5% ] 2.05% | 8,975 | 3.1% |
[ 2.0% - 2.5% ] 2.10% | 9,141 | 8.6% |
[ 2.0% - 2.5% ] 2.13% | 17,788 | 14.3% |
[ 2.0% - 2.5% ] 2.19% | 5,790 | 24.9% |
[ 2.0% - 2.5% ] 2.32% | 24,785 | 9.3% |
[ 2.0% - 2.5% ] 2.35% | 1,790 | 13.9% |
[ 2.0% - 2.5% ] 2.36% | 38,077 | 13.6% |
[ 2.0% - 2.5% ] 2.46% | 26,573 | 12.6% |
[ 2.5% - 3.0% ] 2.52% | 58,872 | 26.5% |
[ 2.5% - 3.0% ] 2.54% | 58,775 | 27.1% |
[ 2.5% - 3.0% ] 2.65% | 16,250 | 36.4% |
[ 2.5% - 3.0% ] 2.68% | 43,882 | 33.9% |
[ 2.5% - 3.0% ] 2.71% | 2,068 | 26.4% |
[ 2.5% - 3.0% ] 2.76% | 52,359 | 8.9% |
[ 2.5% - 3.0% ] 2.88% | 347 | 14.7% |
[ 2.5% - 3.0% ] 2.91% | 19,812 | 15.5% |
[ 2.5% - 3.0% ] 2.94% | 16,827 | 34.3% |
[ 3.0% - 3.5% ] 3.03% | 2,573 | 55.7% |
[ 3.0% - 3.5% ] 3.06% | 4,218 | 43.3% |
[ 3.0% - 3.5% ] 3.09% | 6,510 | 27.8% |
[ 3.0% - 3.5% ] 3.16% | 728 | 10.9% |
[ 3.0% - 3.5% ] 3.29% | 49,246 | 28.1% |
[ 3.0% - 3.5% ] 3.49% | 1,463 | 4.7% |
[ 3.5% - 4.0% ] 3.66% | 6,772 | 31.8% |
[ 4.0% - 4.5% ] 4.04% | 2,052 | 20.9% |
[ 4.0% - 4.5% ] 4.33% | 1,202 | 45.9% |
[ 4.0% - 4.5% ] 4.35% | 4,003 | 37.2% |
[ 4.5% - 5.0% ] 4.90% | 4,024 | 37.1% |
[ 4.5% - 5.0% ] 4.96% | 746 | 20.2% |
[ 5.5% - 6.0% ] 5.56% | 18 | 37.5% |
[ 5.5% - 6.0% ] 5.59% | 34,860 | 22.1% |
[ 6.0% - 6.5% ] 6.27% | 31,121 | 23.0% |
[ 6.0% - 6.5% ] 6.44% | 652 | 30.7% |
[ 6.0% - 6.5% ] 6.47% | 2,533 | 43.5% |
[ 6.5% - 7.0% ] 6.82% | 1,584 | 41.7% |
[ 7.0% - 7.5% ] 7.30% | 1,137 | 54.2% |
[ 8.5% - 9.0% ] 8.92% | 415 | 6.5% |