Armenian 3 or more Vehicles in Household

COMPARE

Armenian
Race
Ancestry
AfghanAfricanAlaska NativeAlaskan AthabascanAlbanianAleutAlsatianAmericanApacheArabArapahoArgentineanArmenianAssyrian/Chaldean/SyriacAustralianAustrianBahamianBangladeshiBarbadianBasqueBelgianBelizeanBermudanBhutaneseBlackfeetBolivianBrazilianBritishBritish West IndianBulgarianBurmeseCajunCambodianCanadianCape VerdeanCarpatho RusynCelticCentral AmericanCentral American IndianCherokeeCheyenneChickasawChileanChineseChippewaChoctawColombianColvilleComancheCosta RicanCreeCreekCroatianCrowCubanCypriotCzechCzechoslovakianDanishDelawareDominicanDutchDutch West IndianEastern EuropeanEcuadorianEgyptianEnglishEstonianEthiopianEuropeanFijianFilipinoFinnishFrenchFrench American IndianFrench CanadianGermanGerman RussianGhanaianGreekGuamanian/ChamorroGuatemalanGuyaneseHaitianHmongHonduranHopiHoumaHungarianIcelanderIndian (Asian)IndonesianInupiatIranianIraqiIrishIroquoisIsraeliItalianJamaicanJapaneseJordanianKenyanKiowaKoreanLaotianLatvianLebaneseLiberianLithuanianLumbeeLuxembourgerMacedonianMalaysianMalteseMarshalleseMenomineeMexicanMexican American IndianMongolianMoroccanNative HawaiianNavajoNepaleseNew ZealanderNicaraguanNigerianNorthern EuropeanNorwegianOkinawanOsageOttawaPaiutePakistaniPalestinianPanamanianParaguayanPennsylvania GermanPeruvianPimaPolishPortuguesePotawatomiPuebloPuerto RicanPuget Sound SalishRomanianRussianSalvadoranSamoanScandinavianScotch-IrishScottishSeminoleSenegaleseSerbianShoshoneSierra LeoneanSiouxSlavicSlovakSloveneSomaliSouth AfricanSouth AmericanSouth American IndianSoviet UnionSpaniardSpanishSpanish AmericanSpanish American IndianSri LankanSubsaharan AfricanSudaneseSwedishSwissSyrianTaiwaneseThaiTlingit-HaidaTohono O'OdhamTonganTrinidadian and TobagonianTsimshianTurkishU.S. Virgin IslanderUgandanUkrainianUruguayanUteVenezuelanVietnameseWelshWest IndianYakamaYaquiYugoslavianYumanYup'ikZimbabwean
Immigration
NonimmigrantsImmigrantsAfghanistanAfricaAlbaniaArgentinaArmeniaAsiaAustraliaAustriaBahamasBangladeshBarbadosBelarusBelgiumBelizeBoliviaBosnia and HerzegovinaBrazilBulgariaBurma/MyanmarCabo VerdeCambodiaCameroonCanadaCaribbeanCentral AmericaChileChinaColombiaCongoCosta RicaCroatiaCubaCzechoslovakiaDenmarkDominicaDominican RepublicEastern AfricaEastern AsiaEastern EuropeEcuadorEgyptEl SalvadorEnglandEritreaEthiopiaEuropeFijiFranceGermanyGhanaGreeceGrenadaGuatemalaGuyanaHaitiHondurasHong KongHungaryIndiaIndonesiaIranIraqIrelandIsraelItalyJamaicaJapanJordanKazakhstanKenyaKoreaKuwaitLaosLatin AmericaLatviaLebanonLiberiaLithuaniaMalaysiaMexicoMicronesiaMiddle AfricaMoldovaMoroccoNepalNetherlandsNicaraguaNigeriaNorth AmericaNorth MacedoniaNorthern AfricaNorthern EuropeNorwayOceaniaPakistanPanamaPeruPhilippinesPolandPortugalRomaniaRussiaSaudi ArabiaScotlandSenegalSerbiaSierra LeoneSingaporeSomaliaSouth AfricaSouth AmericaSouth Central AsiaSouth Eastern AsiaSouthern EuropeSpainSri LankaSt. Vincent and the GrenadinesSudanSwedenSwitzerlandSyriaTaiwanThailandTrinidad and TobagoTurkeyUgandaUkraineUruguayUzbekistanVenezuelaVietnamWest IndiesWestern AfricaWestern AsiaWestern EuropeYemenZaireZimbabweAzores
Select to Compare
Race
Ancestry
AfghanAfricanAlaska NativeAlaskan AthabascanAlbanianAleutAlsatianAmericanApacheArabArapahoArgentineanAssyrian/Chaldean/SyriacAustralianAustrianBahamianBangladeshiBarbadianBasqueBelgianBelizeanBermudanBhutaneseBlackfeetBolivianBrazilianBritishBritish West IndianBulgarianBurmeseCajunCambodianCanadianCape VerdeanCarpatho RusynCelticCentral AmericanCentral American IndianCherokeeCheyenneChickasawChileanChineseChippewaChoctawColombianColvilleComancheCosta RicanCreeCreekCroatianCrowCubanCypriotCzechCzechoslovakianDanishDelawareDominicanDutchDutch West IndianEastern EuropeanEcuadorianEgyptianEnglishEstonianEthiopianEuropeanFijianFilipinoFinnishFrenchFrench American IndianFrench CanadianGermanGerman RussianGhanaianGreekGuamanian/ChamorroGuatemalanGuyaneseHaitianHmongHonduranHopiHoumaHungarianIcelanderIndian (Asian)IndonesianInupiatIranianIraqiIrishIroquoisIsraeliItalianJamaicanJapaneseJordanianKenyanKiowaKoreanLaotianLatvianLebaneseLiberianLithuanianLumbeeLuxembourgerMacedonianMalaysianMalteseMarshalleseMenomineeMexicanMexican American IndianMongolianMoroccanNative HawaiianNavajoNepaleseNew ZealanderNicaraguanNigerianNorthern EuropeanNorwegianOkinawanOsageOttawaPaiutePakistaniPalestinianPanamanianParaguayanPennsylvania GermanPeruvianPimaPolishPortuguesePotawatomiPuebloPuerto RicanPuget Sound SalishRomanianRussianSalvadoranSamoanScandinavianScotch-IrishScottishSeminoleSenegaleseSerbianShoshoneSierra LeoneanSiouxSlavicSlovakSloveneSomaliSouth AfricanSouth AmericanSouth American IndianSoviet UnionSpaniardSpanishSpanish AmericanSpanish American IndianSri LankanSubsaharan AfricanSudaneseSwedishSwissSyrianTaiwaneseThaiTlingit-HaidaTohono O'OdhamTonganTrinidadian and TobagonianTsimshianTurkishU.S. Virgin IslanderUgandanUkrainianUruguayanUteVenezuelanVietnameseWelshWest IndianYakamaYaquiYugoslavianYumanYup'ikZimbabwean
Immigration
NonimmigrantsImmigrantsAfghanistanAfricaAlbaniaArgentinaArmeniaAsiaAustraliaAustriaBahamasBangladeshBarbadosBelarusBelgiumBelizeBoliviaBosnia and HerzegovinaBrazilBulgariaBurma/MyanmarCabo VerdeCambodiaCameroonCanadaCaribbeanCentral AmericaChileChinaColombiaCongoCosta RicaCroatiaCubaCzechoslovakiaDenmarkDominicaDominican RepublicEastern AfricaEastern AsiaEastern EuropeEcuadorEgyptEl SalvadorEnglandEritreaEthiopiaEuropeFijiFranceGermanyGhanaGreeceGrenadaGuatemalaGuyanaHaitiHondurasHong KongHungaryIndiaIndonesiaIranIraqIrelandIsraelItalyJamaicaJapanJordanKazakhstanKenyaKoreaKuwaitLaosLatin AmericaLatviaLebanonLiberiaLithuaniaMalaysiaMexicoMicronesiaMiddle AfricaMoldovaMoroccoNepalNetherlandsNicaraguaNigeriaNorth AmericaNorth MacedoniaNorthern AfricaNorthern EuropeNorwayOceaniaPakistanPanamaPeruPhilippinesPolandPortugalRomaniaRussiaSaudi ArabiaScotlandSenegalSerbiaSierra LeoneSingaporeSomaliaSouth AfricaSouth AmericaSouth Central AsiaSouth Eastern AsiaSouthern EuropeSpainSri LankaSt. Vincent and the GrenadinesSudanSwedenSwitzerlandSyriaTaiwanThailandTrinidad and TobagoTurkeyUgandaUkraineUruguayUzbekistanVenezuelaVietnamWest IndiesWestern AfricaWestern AsiaWestern EuropeYemenZaireZimbabweAzores
3 or more Vehicles in Household
Income
Poverty
Unemployment
Labor Participation
Family Structure
Vehicle Availability
Education Level
Disability

Armenian 3 or more Vehicles in Household
Good

19.8%
3+ VEHICLES AVAILABLE
68.8/ 100
METRIC RATING
158th/ 347
METRIC RANK

Armenian 3 or more Vehicles in Household Correlation Chart

The statistical analysis conducted on geographies consisting of 310,710,692 people shows a poor negative correlation between the proportion of Armenians and percentage of households with 3 or more vehicles available in the United States with a correlation coefficient (R) of -0.190 and weighted average of 19.8%. On average, for every 1% (one percent) increase in Armenians within a typical geography, there is a decrease of 0.14% in percentage of households with 3 or more vehicles available.
Armenian 3 or more Vehicles in Household
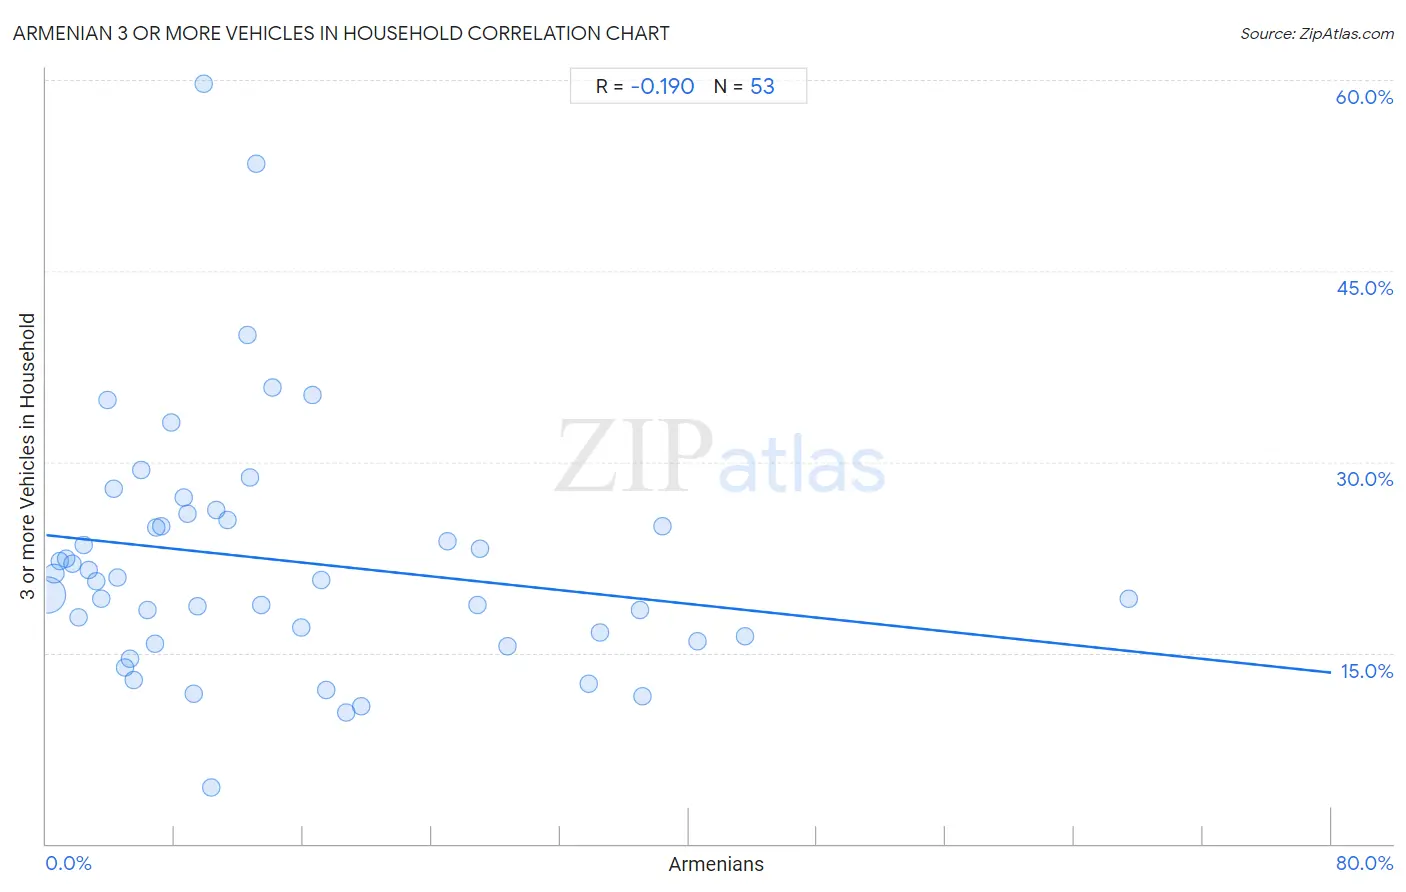
It is essential to understand that the correlation between the percentage of Armenians and percentage of households with 3 or more vehicles available does not imply a direct cause-and-effect relationship. It remains uncertain whether the presence of Armenians influences an upward or downward trend in the level of percentage of households with 3 or more vehicles available within an area, or if Armenians simply ended up residing in those areas with higher or lower levels of percentage of households with 3 or more vehicles available due to other factors.

Demographics Similar to Armenians by 3 or more Vehicles in Household

In terms of 3 or more vehicles in household, the demographic groups most similar to Armenians are Immigrants from Pakistan (19.8%, a difference of 0.050%), Immigrants from Lebanon (19.8%, a difference of 0.11%), Hungarian (19.8%, a difference of 0.15%), Thai (19.8%, a difference of 0.20%), and Immigrants from Guatemala (19.7%, a difference of 0.27%).
DemographicsRating | Rank3 or more Vehicles in Household
Taiwanese
80.6
/100
|
#151
Excellent
20.0%
Lebanese
79.8
/100
|
#152
Good
20.0%
Yuman
75.6
/100
|
#153
Good
19.9%
Immigrants from Jordan
75.0
/100
|
#154
Good
19.9%
Tlingit-Haida
73.4
/100
|
#155
Good
19.9%
Thais
71.1
/100
|
#156
Good
19.8%
Hungarians
70.5
/100
|
#157
Good
19.8%
Armenians
68.8
/100
|
#158
Good
19.8%
Immigrants from Pakistan
68.2
/100
|
#159
Good
19.8%
Immigrants from Lebanon
67.6
/100
|
#160
Good
19.8%
Immigrants from Guatemala
65.6
/100
|
#161
Good
19.7%
Estonians
63.2
/100
|
#162
Good
19.7%
Chileans
63.0
/100
|
#163
Good
19.7%
Yugoslavians
62.9
/100
|
#164
Good
19.7%
Immigrants from Costa Rica
61.9
/100
|
#165
Good
19.7%

Armenian 3 or more Vehicles in Household Correlation Summary

MeasurementArmenian Data3 or more Vehicles in Household Data
Minimum0.098%4.4%
Maximum67.4%59.7%
Range67.3%55.3%
Mean14.6%22.3%
Median9.8%20.7%
Interquartile 25% (IQ1)4.7%16.1%
Interquartile 75% (IQ3)19.1%25.7%
Interquartile Range (IQR)14.5%9.6%
Standard Deviation (Sample)13.9%9.9%
Standard Deviation (Population)13.8%9.8%

Correlation Details

Armenian PercentileSample Size3 or more Vehicles in Household
[
0.0%
-
0.5%
]
0.098%
270,187,14519.5%
[
0.0%
-
0.5%
]
0.49%
23,637,47821.2%
[
0.5%
-
1.0%
]
0.87%
5,353,62222.2%
[
1.0%
-
1.5%
]
1.24%
2,925,90022.4%
[
1.5%
-
2.0%
]
1.62%
853,62322.0%
[
2.0%
-
2.5%
]
2.02%
4,862,02817.8%
[
2.0%
-
2.5%
]
2.30%
516,62223.5%
[
2.5%
-
3.0%
]
2.68%
505,46921.5%
[
3.0%
-
3.5%
]
3.12%
111,74420.6%
[
3.0%
-
3.5%
]
3.45%
259,46219.2%
[
3.5%
-
4.0%
]
3.83%
26,36634.8%
[
4.0%
-
4.5%
]
4.18%
69,51727.9%
[
4.0%
-
4.5%
]
4.45%
112,16520.9%
[
4.5%
-
5.0%
]
4.87%
31,27713.8%
[
5.0%
-
5.5%
]
5.22%
90,87414.6%
[
5.0%
-
5.5%
]
5.46%
109,63112.9%
[
5.5%
-
6.0%
]
5.90%
88,79729.3%
[
6.0%
-
6.5%
]
6.27%
82918.4%
[
6.5%
-
7.0%
]
6.80%
60,34515.7%
[
6.5%
-
7.0%
]
6.86%
44,24424.9%
[
7.0%
-
7.5%
]
7.19%
20,09225.0%
[
7.5%
-
8.0%
]
7.75%
6,64233.0%
[
8.5%
-
9.0%
]
8.54%
72,42127.2%
[
8.5%
-
9.0%
]
8.76%
145,22725.9%
[
9.0%
-
9.5%
]
9.19%
46811.8%
[
9.0%
-
9.5%
]
9.42%
43,89318.6%
[
9.5%
-
10.0%
]
9.83%
86559.7%
[
10.0%
-
10.5%
]
10.27%
2244.4%
[
10.5%
-
11.0%
]
10.62%
51,65426.2%
[
11.0%
-
11.5%
]
11.28%
13325.5%
[
12.0%
-
12.5%
]
12.50%
1640.0%
[
12.5%
-
13.0%
]
12.69%
33,16328.8%
[
13.0%
-
13.5%
]
13.08%
65053.4%
[
13.0%
-
13.5%
]
13.41%
27,52318.8%
[
14.0%
-
14.5%
]
14.08%
20635.9%
[
15.5%
-
16.0%
]
15.89%
2,64417.0%
[
16.5%
-
17.0%
]
16.58%
20,91135.3%
[
17.0%
-
17.5%
]
17.10%
31020.7%
[
17.0%
-
17.5%
]
17.46%
8,20912.0%
[
18.5%
-
19.0%
]
18.65%
42910.3%
[
19.5%
-
20.0%
]
19.65%
12,31210.8%
[
25.0%
-
25.5%
]
25.00%
11623.7%
[
26.5%
-
27.0%
]
26.83%
45,56418.8%
[
26.5%
-
27.0%
]
26.98%
15,46523.2%
[
28.5%
-
29.0%
]
28.71%
18,95115.5%
[
33.5%
-
34.0%
]
33.78%
16,67912.6%
[
34.5%
-
35.0%
]
34.51%
194,51216.6%
[
36.5%
-
37.0%
]
36.93%
32,29418.4%
[
37.0%
-
37.5%
]
37.12%
35,75511.5%
[
38.0%
-
38.5%
]
38.33%
11,09125.0%
[
40.5%
-
41.0%
]
40.51%
22,83115.9%
[
43.5%
-
44.0%
]
43.52%
22,16316.3%
[
67.0%
-
67.5%
]
67.38%
14119.2%