Immigrants from Portugal 3 or more Vehicles in Household
COMPARE
Immigrants from Portugal
Select to Compare
3 or more Vehicles in Household
Immigrants from Portugal 3 or more Vehicles in Household
18.6%
3+ VEHICLES AVAILABLE
8.9/ 100
METRIC RATING
218th/ 347
METRIC RANK
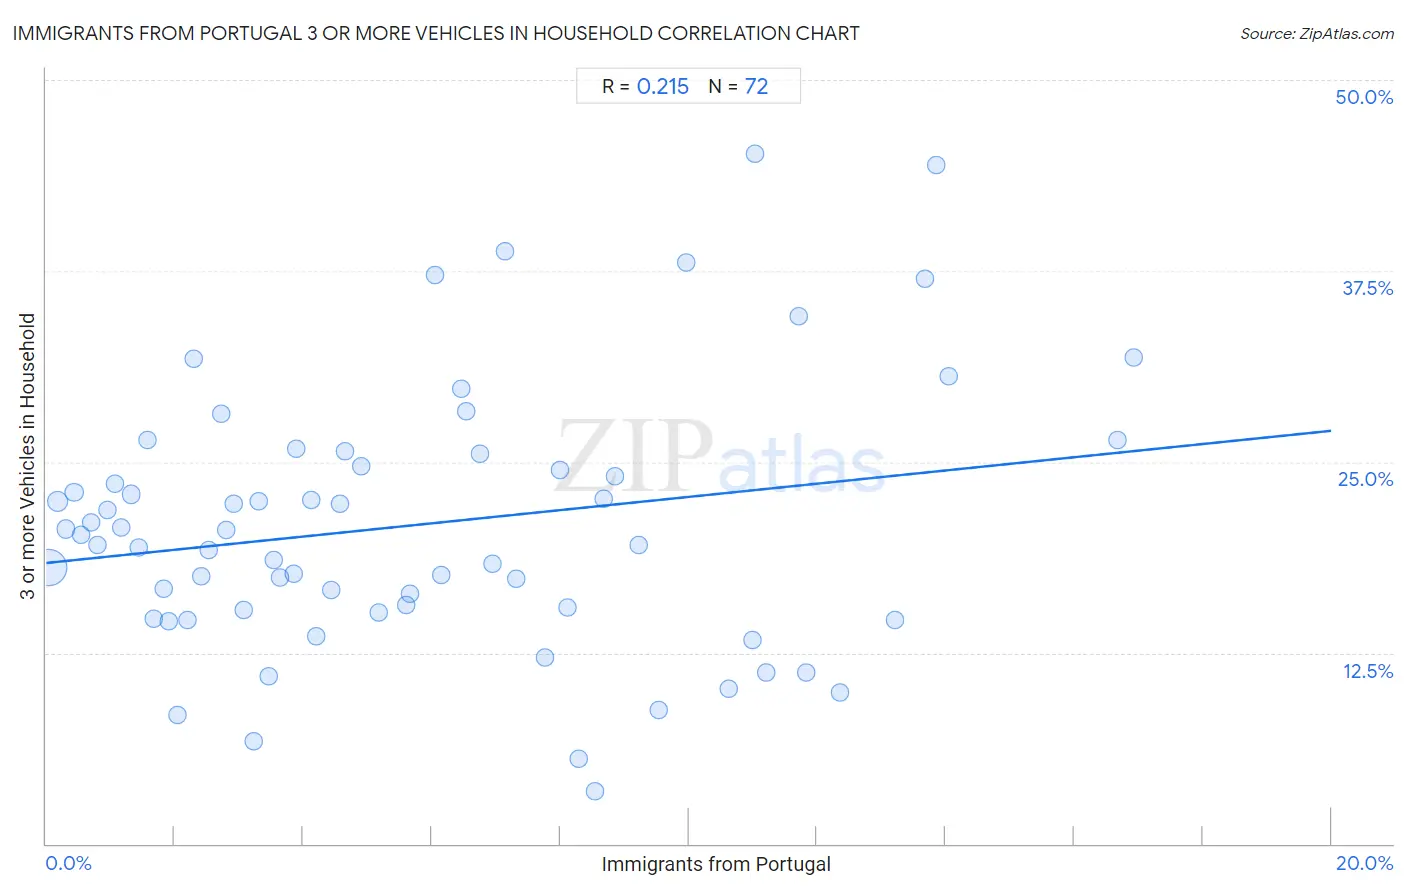
Immigrants from Portugal 3 or more Vehicles in Household Correlation Chart
The statistical analysis conducted on geographies consisting of 174,744,003 people shows a weak positive correlation between the proportion of Immigrants from Portugal and percentage of households with 3 or more vehicles available in the United States with a correlation coefficient (R) of 0.215 and weighted average of 18.6%. On average, for every 1% (one percent) increase in Immigrants from Portugal within a typical geography, there is an increase of 0.43% in percentage of households with 3 or more vehicles available.
It is essential to understand that the correlation between the percentage of Immigrants from Portugal and percentage of households with 3 or more vehicles available does not imply a direct cause-and-effect relationship. It remains uncertain whether the presence of Immigrants from Portugal influences an upward or downward trend in the level of percentage of households with 3 or more vehicles available within an area, or if Immigrants from Portugal simply ended up residing in those areas with higher or lower levels of percentage of households with 3 or more vehicles available due to other factors.
Demographics Similar to Immigrants from Portugal by 3 or more Vehicles in Household
In terms of 3 or more vehicles in household, the demographic groups most similar to Immigrants from Portugal are Immigrants from Armenia (18.6%, a difference of 0.080%), Nigerian (18.6%, a difference of 0.28%), Immigrants from Italy (18.7%, a difference of 0.29%), Immigrants from Nigeria (18.7%, a difference of 0.31%), and Eastern European (18.7%, a difference of 0.37%).
| Demographics | Rating | Rank | 3 or more Vehicles in Household |
| Immigrants from Kenya | 12.4 /100 | #211 | Poor 18.8% |
| Panamanians | 11.6 /100 | #212 | Poor 18.8% |
| Immigrants from Cuba | 11.6 /100 | #213 | Poor 18.8% |
| Immigrants from Sierra Leone | 10.8 /100 | #214 | Poor 18.7% |
| Eastern Europeans | 10.6 /100 | #215 | Poor 18.7% |
| Immigrants from Nigeria | 10.3 /100 | #216 | Poor 18.7% |
| Immigrants from Italy | 10.2 /100 | #217 | Poor 18.7% |
| Immigrants from Portugal | 8.9 /100 | #218 | Tragic 18.6% |
| Immigrants from Armenia | 8.6 /100 | #219 | Tragic 18.6% |
| Nigerians | 7.9 /100 | #220 | Tragic 18.6% |
| Immigrants from Poland | 7.5 /100 | #221 | Tragic 18.6% |
| Belizeans | 7.3 /100 | #222 | Tragic 18.6% |
| Immigrants from Czechoslovakia | 5.9 /100 | #223 | Tragic 18.5% |
| Immigrants from Argentina | 5.6 /100 | #224 | Tragic 18.5% |
| Immigrants from Lithuania | 5.6 /100 | #225 | Tragic 18.5% |
Immigrants from Portugal 3 or more Vehicles in Household Correlation Summary
| Measurement | Immigrants from Portugal Data | 3 or more Vehicles in Household Data |
| Minimum | 0.034% | 3.4% |
| Maximum | 16.9% | 45.2% |
| Range | 16.9% | 41.7% |
| Mean | 5.8% | 20.9% |
| Median | 4.6% | 19.9% |
| Interquartile 25% (IQ1) | 2.2% | 15.2% |
| Interquartile 75% (IQ3) | 8.6% | 25.1% |
| Interquartile Range (IQR) | 6.4% | 9.9% |
| Standard Deviation (Sample) | 4.3% | 8.7% |
| Standard Deviation (Population) | 4.3% | 8.6% |
Correlation Details
| Immigrants from Portugal Percentile | Sample Size | 3 or more Vehicles in Household |
[ 0.0% - 0.5% ] 0.034% | 139,022,571 | 18.1% |
[ 0.0% - 0.5% ] 0.18% | 16,727,832 | 22.4% |
[ 0.0% - 0.5% ] 0.30% | 5,415,783 | 20.6% |
[ 0.0% - 0.5% ] 0.43% | 3,123,819 | 23.0% |
[ 0.5% - 1.0% ] 0.55% | 2,571,554 | 20.2% |
[ 0.5% - 1.0% ] 0.69% | 1,311,761 | 21.0% |
[ 0.5% - 1.0% ] 0.80% | 636,480 | 19.6% |
[ 0.5% - 1.0% ] 0.95% | 670,464 | 21.9% |
[ 1.0% - 1.5% ] 1.06% | 688,136 | 23.6% |
[ 1.0% - 1.5% ] 1.17% | 308,907 | 20.7% |
[ 1.0% - 1.5% ] 1.33% | 475,930 | 22.9% |
[ 1.0% - 1.5% ] 1.45% | 319,929 | 19.4% |
[ 1.5% - 2.0% ] 1.58% | 197,755 | 26.4% |
[ 1.5% - 2.0% ] 1.68% | 221,623 | 14.7% |
[ 1.5% - 2.0% ] 1.82% | 362,744 | 16.7% |
[ 1.5% - 2.0% ] 1.91% | 104,757 | 14.6% |
[ 2.0% - 2.5% ] 2.05% | 343,717 | 8.4% |
[ 2.0% - 2.5% ] 2.20% | 215,673 | 14.7% |
[ 2.0% - 2.5% ] 2.29% | 26,676 | 31.8% |
[ 2.0% - 2.5% ] 2.41% | 120,839 | 17.5% |
[ 2.5% - 3.0% ] 2.53% | 163,270 | 19.2% |
[ 2.5% - 3.0% ] 2.72% | 31,505 | 28.1% |
[ 2.5% - 3.0% ] 2.80% | 184,081 | 20.6% |
[ 2.5% - 3.0% ] 2.92% | 103,810 | 22.3% |
[ 3.0% - 3.5% ] 3.07% | 83,553 | 15.3% |
[ 3.0% - 3.5% ] 3.23% | 13,404 | 6.7% |
[ 3.0% - 3.5% ] 3.31% | 77,829 | 22.4% |
[ 3.0% - 3.5% ] 3.46% | 37,993 | 11.0% |
[ 3.5% - 4.0% ] 3.54% | 90,831 | 18.6% |
[ 3.5% - 4.0% ] 3.65% | 16,296 | 17.5% |
[ 3.5% - 4.0% ] 3.84% | 18,624 | 17.7% |
[ 3.5% - 4.0% ] 3.89% | 19,850 | 25.9% |
[ 4.0% - 4.5% ] 4.12% | 43,579 | 22.5% |
[ 4.0% - 4.5% ] 4.20% | 32,800 | 13.6% |
[ 4.0% - 4.5% ] 4.44% | 64,636 | 16.6% |
[ 4.5% - 5.0% ] 4.58% | 111,351 | 22.3% |
[ 4.5% - 5.0% ] 4.64% | 3,620 | 25.7% |
[ 4.5% - 5.0% ] 4.90% | 2,654 | 24.7% |
[ 5.0% - 5.5% ] 5.17% | 82,314 | 15.1% |
[ 5.5% - 6.0% ] 5.61% | 196 | 15.6% |
[ 5.5% - 6.0% ] 5.67% | 2,436 | 16.3% |
[ 6.0% - 6.5% ] 6.05% | 215 | 37.3% |
[ 6.0% - 6.5% ] 6.16% | 86,201 | 17.6% |
[ 6.0% - 6.5% ] 6.45% | 10,466 | 29.8% |
[ 6.5% - 7.0% ] 6.53% | 337 | 28.3% |
[ 6.5% - 7.0% ] 6.74% | 11,966 | 25.5% |
[ 6.5% - 7.0% ] 6.95% | 5,572 | 18.3% |
[ 7.0% - 7.5% ] 7.15% | 1,581 | 38.8% |
[ 7.0% - 7.5% ] 7.31% | 12,072 | 17.3% |
[ 7.5% - 8.0% ] 7.76% | 100,787 | 12.2% |
[ 7.5% - 8.0% ] 8.00% | 21,383 | 24.5% |
[ 8.0% - 8.5% ] 8.11% | 47,012 | 15.5% |
[ 8.0% - 8.5% ] 8.29% | 16,286 | 5.6% |
[ 8.5% - 9.0% ] 8.54% | 56,696 | 3.4% |
[ 8.5% - 9.0% ] 8.68% | 27,162 | 22.6% |
[ 8.5% - 9.0% ] 8.86% | 27,548 | 24.1% |
[ 9.0% - 9.5% ] 9.22% | 25,084 | 19.5% |
[ 9.5% - 10.0% ] 9.53% | 18,445 | 8.8% |
[ 9.5% - 10.0% ] 9.96% | 562 | 38.1% |
[ 10.5% - 11.0% ] 10.61% | 12,465 | 10.2% |
[ 10.5% - 11.0% ] 11.00% | 30,558 | 13.3% |
[ 11.0% - 11.5% ] 11.03% | 263 | 45.2% |
[ 11.0% - 11.5% ] 11.21% | 93,781 | 11.2% |
[ 11.5% - 12.0% ] 11.71% | 8,763 | 34.5% |
[ 11.5% - 12.0% ] 11.82% | 17,164 | 11.2% |
[ 12.0% - 12.5% ] 12.36% | 26,807 | 9.9% |
[ 13.0% - 13.5% ] 13.22% | 21,742 | 14.7% |
[ 13.5% - 14.0% ] 13.68% | 6,484 | 37.0% |
[ 13.5% - 14.0% ] 13.85% | 130 | 44.4% |
[ 14.0% - 14.5% ] 14.05% | 121 | 30.6% |
[ 16.5% - 17.0% ] 16.67% | 108 | 26.5% |
[ 16.5% - 17.0% ] 16.93% | 4,660 | 31.8% |