Tlingit-Haida Self-Care Disability

COMPARE

Tlingit-Haida
Race
Ancestry
AfghanAfricanAlaska NativeAlaskan AthabascanAlbanianAleutAlsatianAmericanApacheArabArapahoArgentineanArmenianAssyrian/Chaldean/SyriacAustralianAustrianBahamianBangladeshiBarbadianBasqueBelgianBelizeanBermudanBhutaneseBlackfeetBolivianBrazilianBritishBritish West IndianBulgarianBurmeseCajunCambodianCanadianCape VerdeanCarpatho RusynCelticCentral AmericanCentral American IndianCherokeeCheyenneChickasawChileanChineseChippewaChoctawColombianColvilleComancheCosta RicanCreeCreekCroatianCrowCubanCypriotCzechCzechoslovakianDanishDelawareDominicanDutchDutch West IndianEastern EuropeanEcuadorianEgyptianEnglishEstonianEthiopianEuropeanFijianFilipinoFinnishFrenchFrench American IndianFrench CanadianGermanGerman RussianGhanaianGreekGuamanian/ChamorroGuatemalanGuyaneseHaitianHmongHonduranHopiHoumaHungarianIcelanderIndian (Asian)IndonesianInupiatIranianIraqiIrishIroquoisIsraeliItalianJamaicanJapaneseJordanianKenyanKiowaKoreanLaotianLatvianLebaneseLiberianLithuanianLumbeeLuxembourgerMacedonianMalaysianMalteseMarshalleseMenomineeMexicanMexican American IndianMongolianMoroccanNative HawaiianNavajoNepaleseNew ZealanderNicaraguanNigerianNorthern EuropeanNorwegianOkinawanOsageOttawaPaiutePakistaniPalestinianPanamanianParaguayanPennsylvania GermanPeruvianPimaPolishPortuguesePotawatomiPuebloPuerto RicanPuget Sound SalishRomanianRussianSalvadoranSamoanScandinavianScotch-IrishScottishSeminoleSenegaleseSerbianShoshoneSierra LeoneanSiouxSlavicSlovakSloveneSomaliSouth AfricanSouth AmericanSouth American IndianSoviet UnionSpaniardSpanishSpanish AmericanSpanish American IndianSri LankanSubsaharan AfricanSudaneseSwedishSwissSyrianTaiwaneseThaiTlingit-HaidaTohono O'OdhamTonganTrinidadian and TobagonianTsimshianTurkishU.S. Virgin IslanderUgandanUkrainianUruguayanUteVenezuelanVietnameseWelshWest IndianYakamaYaquiYugoslavianYumanYup'ikZimbabwean
Immigration
NonimmigrantsImmigrantsAfghanistanAfricaAlbaniaArgentinaArmeniaAsiaAustraliaAustriaBahamasBangladeshBarbadosBelarusBelgiumBelizeBoliviaBosnia and HerzegovinaBrazilBulgariaBurma/MyanmarCabo VerdeCambodiaCameroonCanadaCaribbeanCentral AmericaChileChinaColombiaCongoCosta RicaCroatiaCubaCzechoslovakiaDenmarkDominicaDominican RepublicEastern AfricaEastern AsiaEastern EuropeEcuadorEgyptEl SalvadorEnglandEritreaEthiopiaEuropeFijiFranceGermanyGhanaGreeceGrenadaGuatemalaGuyanaHaitiHondurasHong KongHungaryIndiaIndonesiaIranIraqIrelandIsraelItalyJamaicaJapanJordanKazakhstanKenyaKoreaKuwaitLaosLatin AmericaLatviaLebanonLiberiaLithuaniaMalaysiaMexicoMicronesiaMiddle AfricaMoldovaMoroccoNepalNetherlandsNicaraguaNigeriaNorth AmericaNorth MacedoniaNorthern AfricaNorthern EuropeNorwayOceaniaPakistanPanamaPeruPhilippinesPolandPortugalRomaniaRussiaSaudi ArabiaScotlandSenegalSerbiaSierra LeoneSingaporeSomaliaSouth AfricaSouth AmericaSouth Central AsiaSouth Eastern AsiaSouthern EuropeSpainSri LankaSt. Vincent and the GrenadinesSudanSwedenSwitzerlandSyriaTaiwanThailandTrinidad and TobagoTurkeyUgandaUkraineUruguayUzbekistanVenezuelaVietnamWest IndiesWestern AfricaWestern AsiaWestern EuropeYemenZaireZimbabweAzores
Select to Compare
Race
Ancestry
AfghanAfricanAlaska NativeAlaskan AthabascanAlbanianAleutAlsatianAmericanApacheArabArapahoArgentineanArmenianAssyrian/Chaldean/SyriacAustralianAustrianBahamianBangladeshiBarbadianBasqueBelgianBelizeanBermudanBhutaneseBlackfeetBolivianBrazilianBritishBritish West IndianBulgarianBurmeseCajunCambodianCanadianCape VerdeanCarpatho RusynCelticCentral AmericanCentral American IndianCherokeeCheyenneChickasawChileanChineseChippewaChoctawColombianColvilleComancheCosta RicanCreeCreekCroatianCrowCubanCypriotCzechCzechoslovakianDanishDelawareDominicanDutchDutch West IndianEastern EuropeanEcuadorianEgyptianEnglishEstonianEthiopianEuropeanFijianFilipinoFinnishFrenchFrench American IndianFrench CanadianGermanGerman RussianGhanaianGreekGuamanian/ChamorroGuatemalanGuyaneseHaitianHmongHonduranHopiHoumaHungarianIcelanderIndian (Asian)IndonesianInupiatIranianIraqiIrishIroquoisIsraeliItalianJamaicanJapaneseJordanianKenyanKiowaKoreanLaotianLatvianLebaneseLiberianLithuanianLumbeeLuxembourgerMacedonianMalaysianMalteseMarshalleseMenomineeMexicanMexican American IndianMongolianMoroccanNative HawaiianNavajoNepaleseNew ZealanderNicaraguanNigerianNorthern EuropeanNorwegianOkinawanOsageOttawaPaiutePakistaniPalestinianPanamanianParaguayanPennsylvania GermanPeruvianPimaPolishPortuguesePotawatomiPuebloPuerto RicanPuget Sound SalishRomanianRussianSalvadoranSamoanScandinavianScotch-IrishScottishSeminoleSenegaleseSerbianShoshoneSierra LeoneanSiouxSlavicSlovakSloveneSomaliSouth AfricanSouth AmericanSouth American IndianSoviet UnionSpaniardSpanishSpanish AmericanSpanish American IndianSri LankanSubsaharan AfricanSudaneseSwedishSwissSyrianTaiwaneseThaiTohono O'OdhamTonganTrinidadian and TobagonianTsimshianTurkishU.S. Virgin IslanderUgandanUkrainianUruguayanUteVenezuelanVietnameseWelshWest IndianYakamaYaquiYugoslavianYumanYup'ikZimbabwean
Immigration
NonimmigrantsImmigrantsAfghanistanAfricaAlbaniaArgentinaArmeniaAsiaAustraliaAustriaBahamasBangladeshBarbadosBelarusBelgiumBelizeBoliviaBosnia and HerzegovinaBrazilBulgariaBurma/MyanmarCabo VerdeCambodiaCameroonCanadaCaribbeanCentral AmericaChileChinaColombiaCongoCosta RicaCroatiaCubaCzechoslovakiaDenmarkDominicaDominican RepublicEastern AfricaEastern AsiaEastern EuropeEcuadorEgyptEl SalvadorEnglandEritreaEthiopiaEuropeFijiFranceGermanyGhanaGreeceGrenadaGuatemalaGuyanaHaitiHondurasHong KongHungaryIndiaIndonesiaIranIraqIrelandIsraelItalyJamaicaJapanJordanKazakhstanKenyaKoreaKuwaitLaosLatin AmericaLatviaLebanonLiberiaLithuaniaMalaysiaMexicoMicronesiaMiddle AfricaMoldovaMoroccoNepalNetherlandsNicaraguaNigeriaNorth AmericaNorth MacedoniaNorthern AfricaNorthern EuropeNorwayOceaniaPakistanPanamaPeruPhilippinesPolandPortugalRomaniaRussiaSaudi ArabiaScotlandSenegalSerbiaSierra LeoneSingaporeSomaliaSouth AfricaSouth AmericaSouth Central AsiaSouth Eastern AsiaSouthern EuropeSpainSri LankaSt. Vincent and the GrenadinesSudanSwedenSwitzerlandSyriaTaiwanThailandTrinidad and TobagoTurkeyUgandaUkraineUruguayUzbekistanVenezuelaVietnamWest IndiesWestern AfricaWestern AsiaWestern EuropeYemenZaireZimbabweAzores
Self-Care Disability
Income
Poverty
Unemployment
Labor Participation
Family Structure
Vehicle Availability
Education Level
Disability

Tlingit-Haida Self-Care Disability
Good

2.4%
SELF-CARE DISABILITY
73.5/ 100
METRIC RATING
152nd/ 347
METRIC RANK

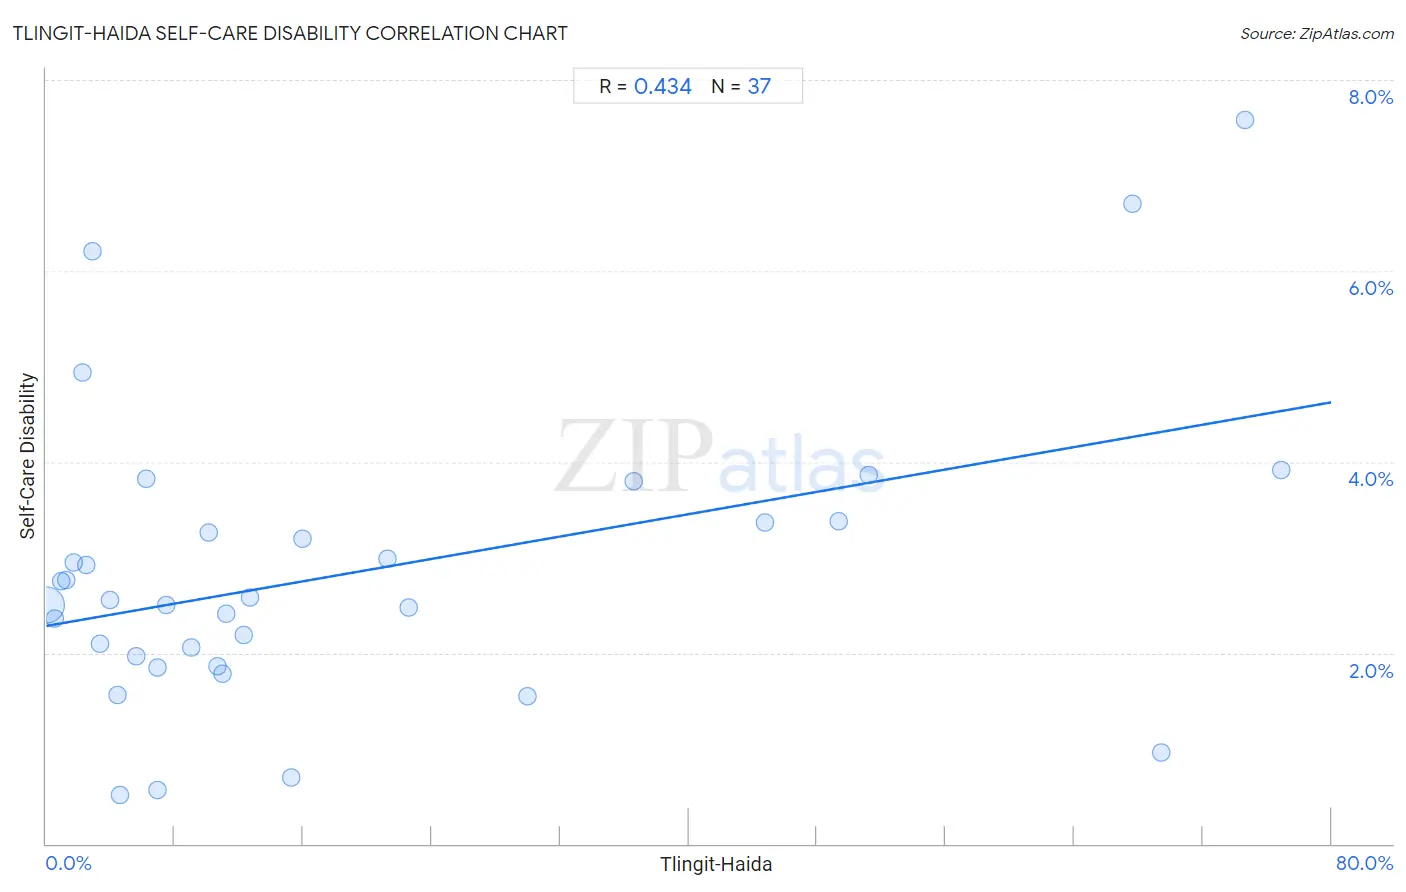
Tlingit-Haida Self-Care Disability Correlation Chart

The statistical analysis conducted on geographies consisting of 60,819,525 people shows a moderate positive correlation between the proportion of Tlingit-Haida and percentage of population with self-care disability in the United States with a correlation coefficient (R) of 0.434 and weighted average of 2.4%. On average, for every 1% (one percent) increase in Tlingit-Haida within a typical geography, there is an increase of 0.029% in percentage of population with self-care disability.
Tlingit-Haida Self-Care Disability
It is essential to understand that the correlation between the percentage of Tlingit-Haida and percentage of population with self-care disability does not imply a direct cause-and-effect relationship. It remains uncertain whether the presence of Tlingit-Haida influences an upward or downward trend in the level of percentage of population with self-care disability within an area, or if Tlingit-Haida simply ended up residing in those areas with higher or lower levels of percentage of population with self-care disability due to other factors.

Demographics Similar to Tlingit-Haida by Self-Care Disability

In terms of self-care disability, the demographic groups most similar to Tlingit-Haida are Immigrants from England (2.4%, a difference of 0.010%), Basque (2.4%, a difference of 0.030%), Italian (2.4%, a difference of 0.080%), Immigrants from Costa Rica (2.4%, a difference of 0.10%), and Pakistani (2.4%, a difference of 0.13%).
DemographicsRating | RankSelf-Care Disability
Germans
80.1
/100
|
#145
Excellent
2.4%
Israelis
80.0
/100
|
#146
Good
2.4%
Dutch
77.5
/100
|
#147
Good
2.4%
Romanians
75.8
/100
|
#148
Good
2.4%
Arabs
75.7
/100
|
#149
Good
2.4%
Immigrants from Costa Rica
75.1
/100
|
#150
Good
2.4%
Basques
74.0
/100
|
#151
Good
2.4%
Tlingit-Haida
73.5
/100
|
#152
Good
2.4%
Immigrants from England
73.5
/100
|
#153
Good
2.4%
Italians
72.2
/100
|
#154
Good
2.4%
Pakistanis
71.4
/100
|
#155
Good
2.4%
Nigerians
70.6
/100
|
#156
Good
2.4%
Immigrants from Europe
69.6
/100
|
#157
Good
2.4%
Immigrants from Western Europe
68.6
/100
|
#158
Good
2.4%
Immigrants from Italy
68.5
/100
|
#159
Good
2.4%

Tlingit-Haida Self-Care Disability Correlation Summary

MeasurementTlingit-Haida DataSelf-Care Disability Data
Minimum0.036%0.50%
Maximum76.8%7.6%
Range76.8%7.1%
Mean19.3%2.8%
Median10.1%2.6%
Interquartile 25% (IQ1)3.7%1.9%
Interquartile 75% (IQ3)26.3%3.4%
Interquartile Range (IQR)22.6%1.5%
Standard Deviation (Sample)23.0%1.6%
Standard Deviation (Population)22.7%1.5%

Correlation Details

Tlingit-Haida PercentileSample SizeSelf-Care Disability
[
0.0%
-
0.5%
]
0.036%
59,000,8642.5%
[
0.5%
-
1.0%
]
0.55%
1,303,8892.4%
[
0.5%
-
1.0%
]
0.91%
246,1112.7%
[
1.0%
-
1.5%
]
1.23%
82,8122.8%
[
1.5%
-
2.0%
]
1.71%
24,0892.9%
[
2.0%
-
2.5%
]
2.28%
8,4474.9%
[
2.0%
-
2.5%
]
2.46%
3,6552.9%
[
2.5%
-
3.0%
]
2.87%
3,2036.2%
[
3.0%
-
3.5%
]
3.33%
10,3262.1%
[
3.5%
-
4.0%
]
3.97%
1,9642.6%
[
4.0%
-
4.5%
]
4.41%
681.6%
[
4.5%
-
5.0%
]
4.62%
8220.50%
[
5.5%
-
6.0%
]
5.62%
1,7622.0%
[
6.0%
-
6.5%
]
6.21%
1773.8%
[
6.5%
-
7.0%
]
6.91%
5640.56%
[
6.5%
-
7.0%
]
6.94%
2,1461.8%
[
7.0%
-
7.5%
]
7.50%
402.5%
[
8.5%
-
9.0%
]
9.00%
6,6912.1%
[
10.0%
-
10.5%
]
10.13%
2,9023.3%
[
10.5%
-
11.0%
]
10.70%
29,9331.9%
[
11.0%
-
11.5%
]
11.00%
32,1081.8%
[
11.0%
-
11.5%
]
11.18%
13,9132.4%
[
12.0%
-
12.5%
]
12.26%
18,0412.2%
[
12.5%
-
13.0%
]
12.67%
8,1682.6%
[
15.0%
-
15.5%
]
15.26%
2,1690.69%
[
15.5%
-
16.0%
]
15.92%
1,7273.2%
[
21.0%
-
21.5%
]
21.23%
4,2673.0%
[
22.5%
-
23.0%
]
22.55%
1,0732.5%
[
29.5%
-
30.0%
]
29.96%
1,1281.5%
[
36.5%
-
37.0%
]
36.59%
823.8%
[
44.5%
-
45.0%
]
44.78%
9203.4%
[
49.0%
-
49.5%
]
49.33%
1,7923.4%
[
51.0%
-
51.5%
]
51.24%
8043.9%
[
67.5%
-
68.0%
]
67.59%
3616.7%
[
69.0%
-
69.5%
]
69.41%
1,6020.95%
[
74.5%
-
75.0%
]
74.63%
677.6%
[
76.5%
-
77.0%
]
76.85%
8383.9%