Tlingit-Haida Single Mother Poverty

COMPARE

Tlingit-Haida
Race
Ancestry
AfghanAfricanAlaska NativeAlaskan AthabascanAlbanianAleutAlsatianAmericanApacheArabArapahoArgentineanArmenianAssyrian/Chaldean/SyriacAustralianAustrianBahamianBangladeshiBarbadianBasqueBelgianBelizeanBermudanBhutaneseBlackfeetBolivianBrazilianBritishBritish West IndianBulgarianBurmeseCajunCambodianCanadianCape VerdeanCarpatho RusynCelticCentral AmericanCentral American IndianCherokeeCheyenneChickasawChileanChineseChippewaChoctawColombianColvilleComancheCosta RicanCreeCreekCroatianCrowCubanCypriotCzechCzechoslovakianDanishDelawareDominicanDutchDutch West IndianEastern EuropeanEcuadorianEgyptianEnglishEstonianEthiopianEuropeanFijianFilipinoFinnishFrenchFrench American IndianFrench CanadianGermanGerman RussianGhanaianGreekGuamanian/ChamorroGuatemalanGuyaneseHaitianHmongHonduranHopiHoumaHungarianIcelanderIndian (Asian)IndonesianInupiatIranianIraqiIrishIroquoisIsraeliItalianJamaicanJapaneseJordanianKenyanKiowaKoreanLaotianLatvianLebaneseLiberianLithuanianLumbeeLuxembourgerMacedonianMalaysianMalteseMarshalleseMenomineeMexicanMexican American IndianMongolianMoroccanNative HawaiianNavajoNepaleseNew ZealanderNicaraguanNigerianNorthern EuropeanNorwegianOkinawanOsageOttawaPaiutePakistaniPalestinianPanamanianParaguayanPennsylvania GermanPeruvianPimaPolishPortuguesePotawatomiPuebloPuerto RicanPuget Sound SalishRomanianRussianSalvadoranSamoanScandinavianScotch-IrishScottishSeminoleSenegaleseSerbianShoshoneSierra LeoneanSiouxSlavicSlovakSloveneSomaliSouth AfricanSouth AmericanSouth American IndianSoviet UnionSpaniardSpanishSpanish AmericanSpanish American IndianSri LankanSubsaharan AfricanSudaneseSwedishSwissSyrianTaiwaneseThaiTlingit-HaidaTohono O'OdhamTonganTrinidadian and TobagonianTsimshianTurkishU.S. Virgin IslanderUgandanUkrainianUruguayanUteVenezuelanVietnameseWelshWest IndianYakamaYaquiYugoslavianYumanYup'ikZimbabwean
Immigration
NonimmigrantsImmigrantsAfghanistanAfricaAlbaniaArgentinaArmeniaAsiaAustraliaAustriaBahamasBangladeshBarbadosBelarusBelgiumBelizeBoliviaBosnia and HerzegovinaBrazilBulgariaBurma/MyanmarCabo VerdeCambodiaCameroonCanadaCaribbeanCentral AmericaChileChinaColombiaCongoCosta RicaCroatiaCubaCzechoslovakiaDenmarkDominicaDominican RepublicEastern AfricaEastern AsiaEastern EuropeEcuadorEgyptEl SalvadorEnglandEritreaEthiopiaEuropeFijiFranceGermanyGhanaGreeceGrenadaGuatemalaGuyanaHaitiHondurasHong KongHungaryIndiaIndonesiaIranIraqIrelandIsraelItalyJamaicaJapanJordanKazakhstanKenyaKoreaKuwaitLaosLatin AmericaLatviaLebanonLiberiaLithuaniaMalaysiaMexicoMicronesiaMiddle AfricaMoldovaMoroccoNepalNetherlandsNicaraguaNigeriaNorth AmericaNorth MacedoniaNorthern AfricaNorthern EuropeNorwayOceaniaPakistanPanamaPeruPhilippinesPolandPortugalRomaniaRussiaSaudi ArabiaScotlandSenegalSerbiaSierra LeoneSingaporeSomaliaSouth AfricaSouth AmericaSouth Central AsiaSouth Eastern AsiaSouthern EuropeSpainSri LankaSt. Vincent and the GrenadinesSudanSwedenSwitzerlandSyriaTaiwanThailandTrinidad and TobagoTurkeyUgandaUkraineUruguayUzbekistanVenezuelaVietnamWest IndiesWestern AfricaWestern AsiaWestern EuropeYemenZaireZimbabweAzores
Select to Compare
Race
Ancestry
AfghanAfricanAlaska NativeAlaskan AthabascanAlbanianAleutAlsatianAmericanApacheArabArapahoArgentineanArmenianAssyrian/Chaldean/SyriacAustralianAustrianBahamianBangladeshiBarbadianBasqueBelgianBelizeanBermudanBhutaneseBlackfeetBolivianBrazilianBritishBritish West IndianBulgarianBurmeseCajunCambodianCanadianCape VerdeanCarpatho RusynCelticCentral AmericanCentral American IndianCherokeeCheyenneChickasawChileanChineseChippewaChoctawColombianColvilleComancheCosta RicanCreeCreekCroatianCrowCubanCypriotCzechCzechoslovakianDanishDelawareDominicanDutchDutch West IndianEastern EuropeanEcuadorianEgyptianEnglishEstonianEthiopianEuropeanFijianFilipinoFinnishFrenchFrench American IndianFrench CanadianGermanGerman RussianGhanaianGreekGuamanian/ChamorroGuatemalanGuyaneseHaitianHmongHonduranHopiHoumaHungarianIcelanderIndian (Asian)IndonesianInupiatIranianIraqiIrishIroquoisIsraeliItalianJamaicanJapaneseJordanianKenyanKiowaKoreanLaotianLatvianLebaneseLiberianLithuanianLumbeeLuxembourgerMacedonianMalaysianMalteseMarshalleseMenomineeMexicanMexican American IndianMongolianMoroccanNative HawaiianNavajoNepaleseNew ZealanderNicaraguanNigerianNorthern EuropeanNorwegianOkinawanOsageOttawaPaiutePakistaniPalestinianPanamanianParaguayanPennsylvania GermanPeruvianPimaPolishPortuguesePotawatomiPuebloPuerto RicanPuget Sound SalishRomanianRussianSalvadoranSamoanScandinavianScotch-IrishScottishSeminoleSenegaleseSerbianShoshoneSierra LeoneanSiouxSlavicSlovakSloveneSomaliSouth AfricanSouth AmericanSouth American IndianSoviet UnionSpaniardSpanishSpanish AmericanSpanish American IndianSri LankanSubsaharan AfricanSudaneseSwedishSwissSyrianTaiwaneseThaiTohono O'OdhamTonganTrinidadian and TobagonianTsimshianTurkishU.S. Virgin IslanderUgandanUkrainianUruguayanUteVenezuelanVietnameseWelshWest IndianYakamaYaquiYugoslavianYumanYup'ikZimbabwean
Immigration
NonimmigrantsImmigrantsAfghanistanAfricaAlbaniaArgentinaArmeniaAsiaAustraliaAustriaBahamasBangladeshBarbadosBelarusBelgiumBelizeBoliviaBosnia and HerzegovinaBrazilBulgariaBurma/MyanmarCabo VerdeCambodiaCameroonCanadaCaribbeanCentral AmericaChileChinaColombiaCongoCosta RicaCroatiaCubaCzechoslovakiaDenmarkDominicaDominican RepublicEastern AfricaEastern AsiaEastern EuropeEcuadorEgyptEl SalvadorEnglandEritreaEthiopiaEuropeFijiFranceGermanyGhanaGreeceGrenadaGuatemalaGuyanaHaitiHondurasHong KongHungaryIndiaIndonesiaIranIraqIrelandIsraelItalyJamaicaJapanJordanKazakhstanKenyaKoreaKuwaitLaosLatin AmericaLatviaLebanonLiberiaLithuaniaMalaysiaMexicoMicronesiaMiddle AfricaMoldovaMoroccoNepalNetherlandsNicaraguaNigeriaNorth AmericaNorth MacedoniaNorthern AfricaNorthern EuropeNorwayOceaniaPakistanPanamaPeruPhilippinesPolandPortugalRomaniaRussiaSaudi ArabiaScotlandSenegalSerbiaSierra LeoneSingaporeSomaliaSouth AfricaSouth AmericaSouth Central AsiaSouth Eastern AsiaSouthern EuropeSpainSri LankaSt. Vincent and the GrenadinesSudanSwedenSwitzerlandSyriaTaiwanThailandTrinidad and TobagoTurkeyUgandaUkraineUruguayUzbekistanVenezuelaVietnamWest IndiesWestern AfricaWestern AsiaWestern EuropeYemenZaireZimbabweAzores
Single Mother Poverty
Income
Poverty
Unemployment
Labor Participation
Family Structure
Vehicle Availability
Education Level
Disability

Tlingit-Haida Single Mother Poverty
Tragic

30.9%
POVERTY | SINGLE MOTHERS
0.6/ 100
METRIC RATING
251st/ 347
METRIC RANK

Tlingit-Haida Single Mother Poverty Correlation Chart

The statistical analysis conducted on geographies consisting of 60,327,973 people shows a mild positive correlation between the proportion of Tlingit-Haida and poverty level among single mothers in the United States with a correlation coefficient (R) of 0.314 and weighted average of 30.9%. On average, for every 1% (one percent) increase in Tlingit-Haida within a typical geography, there is an increase of 0.30% in poverty level among single mothers.
Tlingit-Haida Single Mother Poverty
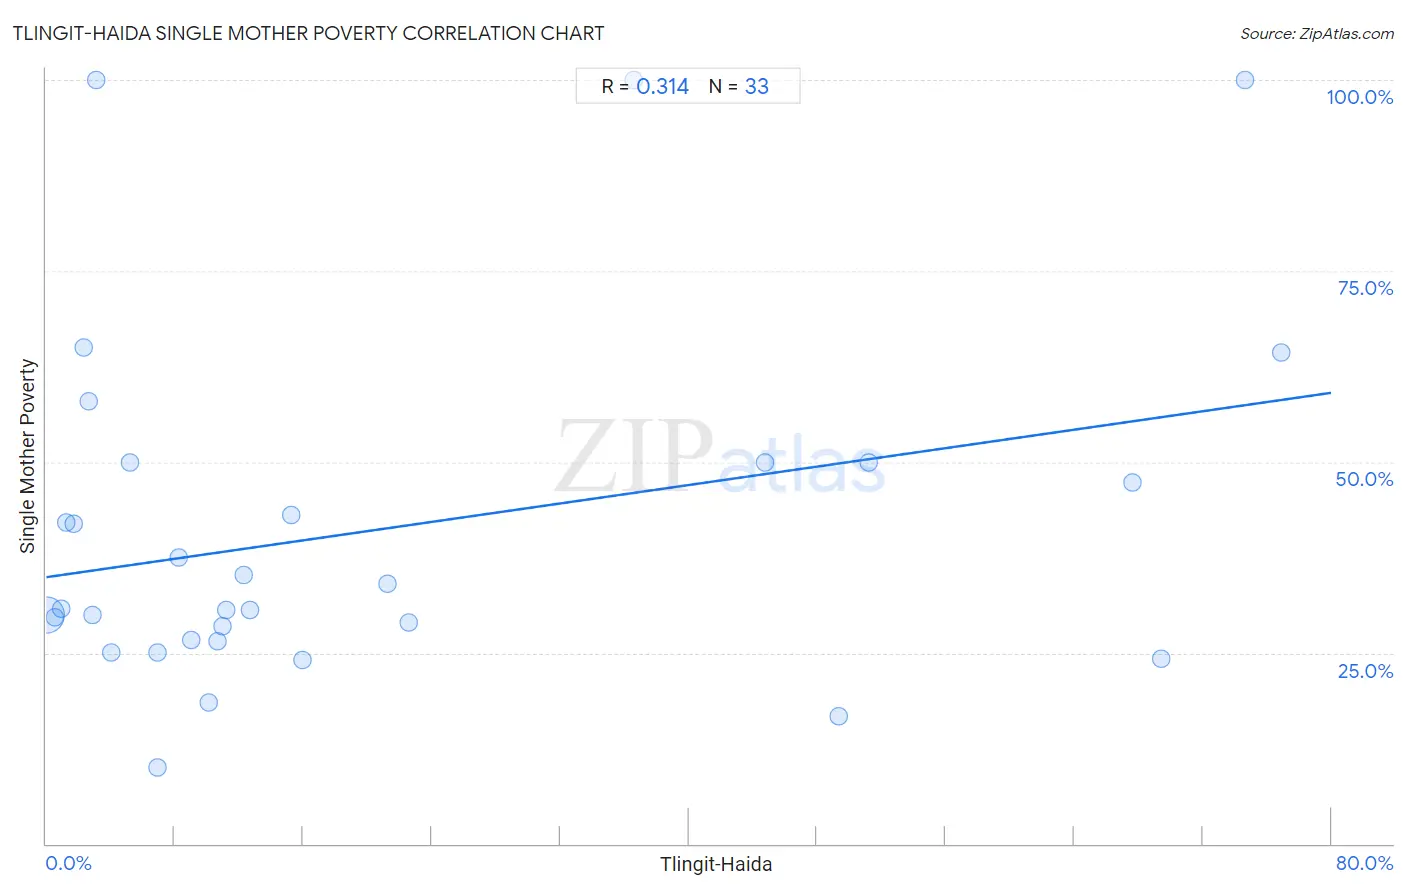
It is essential to understand that the correlation between the percentage of Tlingit-Haida and poverty level among single mothers does not imply a direct cause-and-effect relationship. It remains uncertain whether the presence of Tlingit-Haida influences an upward or downward trend in the level of poverty level among single mothers within an area, or if Tlingit-Haida simply ended up residing in those areas with higher or lower levels of poverty level among single mothers due to other factors.

Demographics Similar to Tlingit-Haida by Single Mother Poverty

In terms of single mother poverty, the demographic groups most similar to Tlingit-Haida are Alaska Native (30.9%, a difference of 0.010%), Celtic (30.9%, a difference of 0.040%), Vietnamese (30.9%, a difference of 0.12%), Senegalese (31.0%, a difference of 0.18%), and Cape Verdean (30.8%, a difference of 0.27%).
DemographicsRating | RankSingle Mother Poverty
French
1.3
/100
|
#244
Tragic
30.7%
Barbadians
1.3
/100
|
#245
Tragic
30.7%
Ecuadorians
0.9
/100
|
#246
Tragic
30.8%
West Indians
0.9
/100
|
#247
Tragic
30.8%
French Canadians
0.9
/100
|
#248
Tragic
30.8%
Cape Verdeans
0.8
/100
|
#249
Tragic
30.8%
Vietnamese
0.7
/100
|
#250
Tragic
30.9%
Tlingit-Haida
0.6
/100
|
#251
Tragic
30.9%
Alaska Natives
0.6
/100
|
#252
Tragic
30.9%
Celtics
0.6
/100
|
#253
Tragic
30.9%
Senegalese
0.5
/100
|
#254
Tragic
31.0%
Belizeans
0.5
/100
|
#255
Tragic
31.0%
Immigrants from West Indies
0.4
/100
|
#256
Tragic
31.1%
Immigrants from Bahamas
0.4
/100
|
#257
Tragic
31.1%
Immigrants from Caribbean
0.4
/100
|
#258
Tragic
31.1%

Tlingit-Haida Single Mother Poverty Correlation Summary

MeasurementTlingit-Haida DataSingle Mother Poverty Data
Minimum0.036%10.0%
Maximum76.8%100.0%
Range76.8%90.0%
Mean20.3%41.0%
Median10.7%30.7%
Interquartile 25% (IQ1)3.0%26.6%
Interquartile 75% (IQ3)29.6%50.0%
Interquartile Range (IQR)26.6%23.4%
Standard Deviation (Sample)23.9%22.9%
Standard Deviation (Population)23.5%22.6%

Correlation Details

Tlingit-Haida PercentileSample SizeSingle Mother Poverty
[
0.0%
-
0.5%
]
0.036%
58,636,48229.9%
[
0.5%
-
1.0%
]
0.55%
1,236,49129.7%
[
0.5%
-
1.0%
]
0.92%
216,75230.7%
[
1.0%
-
1.5%
]
1.22%
78,32542.1%
[
1.5%
-
2.0%
]
1.68%
18,74141.9%
[
2.0%
-
2.5%
]
2.30%
7,38265.0%
[
2.5%
-
3.0%
]
2.63%
60857.9%
[
2.5%
-
3.0%
]
2.87%
69830.0%
[
3.0%
-
3.5%
]
3.12%
1,216100.0%
[
4.0%
-
4.5%
]
4.04%
54425.0%
[
5.0%
-
5.5%
]
5.24%
42050.0%
[
6.5%
-
7.0%
]
6.91%
56425.0%
[
6.5%
-
7.0%
]
6.94%
2,14610.0%
[
8.0%
-
8.5%
]
8.22%
14637.5%
[
8.5%
-
9.0%
]
9.00%
6,69126.7%
[
10.0%
-
10.5%
]
10.13%
2,90218.5%
[
10.5%
-
11.0%
]
10.70%
29,93326.5%
[
11.0%
-
11.5%
]
11.00%
32,10828.5%
[
11.0%
-
11.5%
]
11.18%
13,91330.6%
[
12.0%
-
12.5%
]
12.26%
18,04135.1%
[
12.5%
-
13.0%
]
12.67%
8,16830.5%
[
15.0%
-
15.5%
]
15.26%
2,16943.1%
[
15.5%
-
16.0%
]
15.92%
1,72724.1%
[
21.0%
-
21.5%
]
21.23%
4,26734.0%
[
22.5%
-
23.0%
]
22.55%
1,07328.9%
[
36.5%
-
37.0%
]
36.59%
82100.0%
[
44.5%
-
45.0%
]
44.78%
92050.0%
[
49.0%
-
49.5%
]
49.33%
1,79216.7%
[
51.0%
-
51.5%
]
51.24%
80450.0%
[
67.5%
-
68.0%
]
67.59%
36147.4%
[
69.0%
-
69.5%
]
69.41%
1,60224.2%
[
74.5%
-
75.0%
]
74.63%
67100.0%
[
76.5%
-
77.0%
]
76.85%
83864.3%