Luxembourger 3 or more Vehicles in Household
COMPARE
Luxembourger
Select to Compare
3 or more Vehicles in Household
Luxembourger 3 or more Vehicles in Household
20.9%
3+ VEHICLES AVAILABLE
97.7/ 100
METRIC RATING
104th/ 347
METRIC RANK
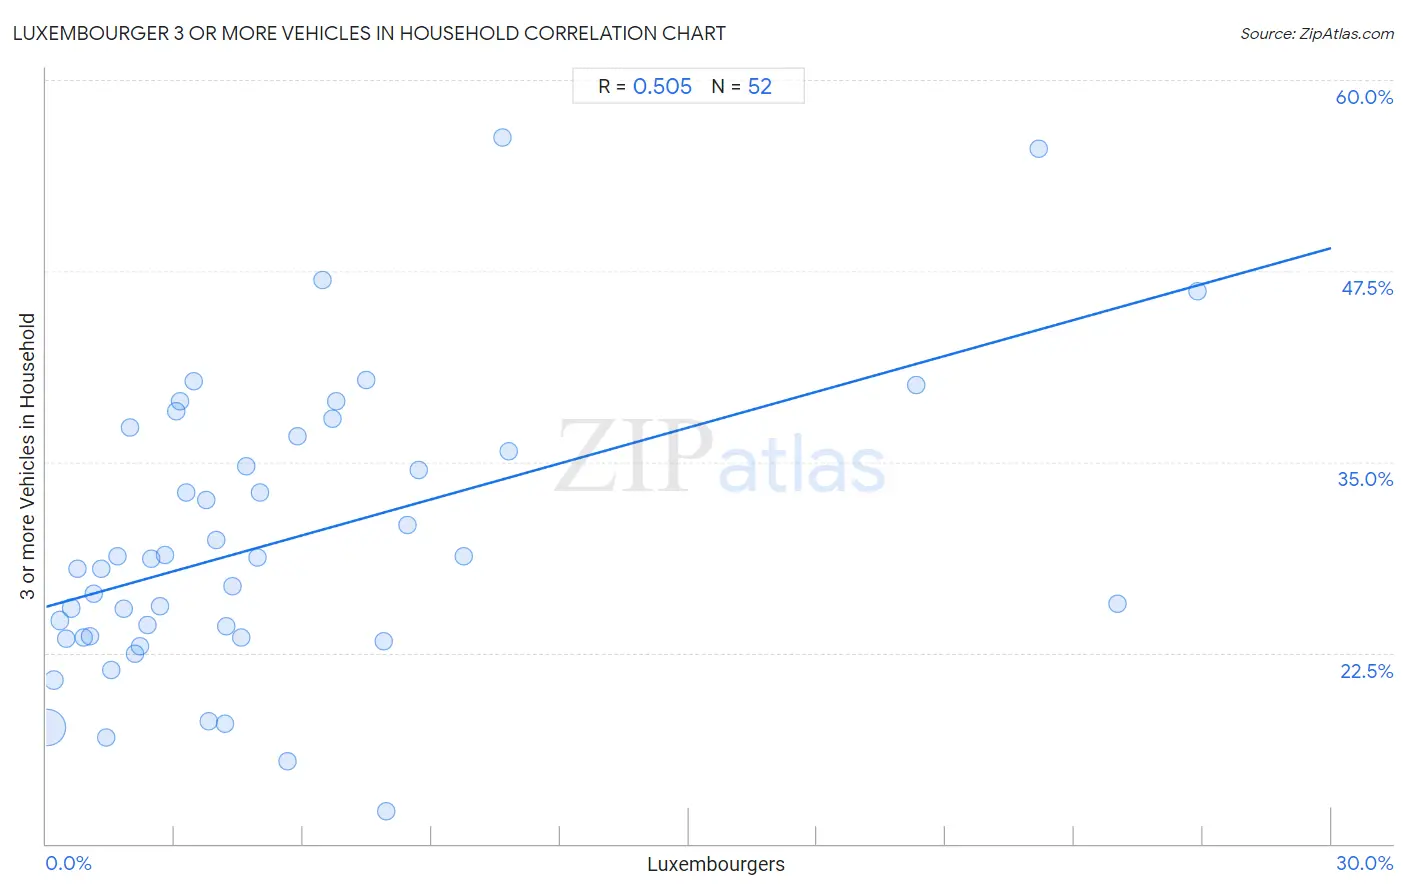
Luxembourger 3 or more Vehicles in Household Correlation Chart
The statistical analysis conducted on geographies consisting of 144,618,677 people shows a substantial positive correlation between the proportion of Luxembourgers and percentage of households with 3 or more vehicles available in the United States with a correlation coefficient (R) of 0.505 and weighted average of 20.9%. On average, for every 1% (one percent) increase in Luxembourgers within a typical geography, there is an increase of 0.78% in percentage of households with 3 or more vehicles available.
It is essential to understand that the correlation between the percentage of Luxembourgers and percentage of households with 3 or more vehicles available does not imply a direct cause-and-effect relationship. It remains uncertain whether the presence of Luxembourgers influences an upward or downward trend in the level of percentage of households with 3 or more vehicles available within an area, or if Luxembourgers simply ended up residing in those areas with higher or lower levels of percentage of households with 3 or more vehicles available due to other factors.
Demographics Similar to Luxembourgers by 3 or more Vehicles in Household
In terms of 3 or more vehicles in household, the demographic groups most similar to Luxembourgers are Dutch West Indian (20.9%, a difference of 0.080%), Austrian (20.9%, a difference of 0.10%), Seminole (20.9%, a difference of 0.12%), Blackfeet (20.9%, a difference of 0.15%), and Bolivian (20.8%, a difference of 0.20%).
| Demographics | Rating | Rank | 3 or more Vehicles in Household |
| Canadians | 98.3 /100 | #97 | Exceptional 21.0% |
| Hmong | 98.2 /100 | #98 | Exceptional 21.0% |
| Alaska Natives | 98.2 /100 | #99 | Exceptional 21.0% |
| Comanche | 98.2 /100 | #100 | Exceptional 21.0% |
| Blackfeet | 97.9 /100 | #101 | Exceptional 20.9% |
| Seminole | 97.8 /100 | #102 | Exceptional 20.9% |
| Dutch West Indians | 97.8 /100 | #103 | Exceptional 20.9% |
| Luxembourgers | 97.7 /100 | #104 | Exceptional 20.9% |
| Austrians | 97.5 /100 | #105 | Exceptional 20.9% |
| Bolivians | 97.4 /100 | #106 | Exceptional 20.8% |
| Immigrants from Germany | 97.4 /100 | #107 | Exceptional 20.8% |
| Immigrants from Scotland | 97.1 /100 | #108 | Exceptional 20.8% |
| Filipinos | 97.0 /100 | #109 | Exceptional 20.8% |
| Asians | 96.8 /100 | #110 | Exceptional 20.8% |
| Immigrants from Micronesia | 96.7 /100 | #111 | Exceptional 20.7% |
Luxembourger 3 or more Vehicles in Household Correlation Summary
| Measurement | Luxembourger Data | 3 or more Vehicles in Household Data |
| Minimum | 0.026% | 12.2% |
| Maximum | 26.9% | 56.2% |
| Range | 26.8% | 44.1% |
| Mean | 5.5% | 29.8% |
| Median | 3.8% | 28.4% |
| Interquartile 25% (IQ1) | 1.7% | 23.5% |
| Interquartile 75% (IQ3) | 6.7% | 36.2% |
| Interquartile Range (IQR) | 5.0% | 12.7% |
| Standard Deviation (Sample) | 6.1% | 9.4% |
| Standard Deviation (Population) | 6.0% | 9.3% |
Correlation Details
| Luxembourger Percentile | Sample Size | 3 or more Vehicles in Household |
[ 0.0% - 0.5% ] 0.026% | 133,147,067 | 17.6% |
[ 0.0% - 0.5% ] 0.18% | 7,632,050 | 20.7% |
[ 0.0% - 0.5% ] 0.32% | 1,612,097 | 24.6% |
[ 0.0% - 0.5% ] 0.46% | 873,938 | 23.4% |
[ 0.5% - 1.0% ] 0.59% | 427,073 | 25.4% |
[ 0.5% - 1.0% ] 0.72% | 212,638 | 28.0% |
[ 0.5% - 1.0% ] 0.88% | 174,183 | 23.5% |
[ 1.0% - 1.5% ] 1.01% | 90,860 | 23.6% |
[ 1.0% - 1.5% ] 1.12% | 52,972 | 26.4% |
[ 1.0% - 1.5% ] 1.27% | 45,141 | 28.0% |
[ 1.0% - 1.5% ] 1.39% | 108,684 | 17.0% |
[ 1.5% - 2.0% ] 1.52% | 33,531 | 21.3% |
[ 1.5% - 2.0% ] 1.67% | 13,139 | 28.8% |
[ 1.5% - 2.0% ] 1.81% | 73,434 | 25.4% |
[ 1.5% - 2.0% ] 1.96% | 9,954 | 37.3% |
[ 2.0% - 2.5% ] 2.06% | 20,181 | 22.4% |
[ 2.0% - 2.5% ] 2.20% | 7,919 | 22.9% |
[ 2.0% - 2.5% ] 2.35% | 15,635 | 24.3% |
[ 2.0% - 2.5% ] 2.44% | 6,960 | 28.7% |
[ 2.5% - 3.0% ] 2.66% | 3,540 | 25.5% |
[ 2.5% - 3.0% ] 2.77% | 253 | 28.9% |
[ 3.0% - 3.5% ] 3.03% | 132 | 38.3% |
[ 3.0% - 3.5% ] 3.13% | 1,981 | 39.0% |
[ 3.0% - 3.5% ] 3.27% | 6,724 | 33.0% |
[ 3.0% - 3.5% ] 3.44% | 960 | 40.3% |
[ 3.5% - 4.0% ] 3.73% | 2,711 | 32.5% |
[ 3.5% - 4.0% ] 3.80% | 79 | 18.0% |
[ 3.5% - 4.0% ] 3.98% | 5,156 | 29.9% |
[ 4.0% - 4.5% ] 4.16% | 529 | 17.9% |
[ 4.0% - 4.5% ] 4.20% | 2,902 | 24.3% |
[ 4.0% - 4.5% ] 4.36% | 4,907 | 26.8% |
[ 4.5% - 5.0% ] 4.56% | 2,499 | 23.5% |
[ 4.5% - 5.0% ] 4.67% | 1,070 | 34.7% |
[ 4.5% - 5.0% ] 4.95% | 182 | 28.8% |
[ 4.5% - 5.0% ] 4.99% | 3,805 | 33.0% |
[ 5.5% - 6.0% ] 5.62% | 498 | 15.4% |
[ 5.5% - 6.0% ] 5.88% | 5,442 | 36.7% |
[ 6.0% - 6.5% ] 6.44% | 419 | 46.9% |
[ 6.5% - 7.0% ] 6.69% | 1,136 | 37.9% |
[ 6.5% - 7.0% ] 6.78% | 678 | 39.0% |
[ 7.0% - 7.5% ] 7.46% | 3,164 | 40.3% |
[ 7.5% - 8.0% ] 7.88% | 3,096 | 23.3% |
[ 7.5% - 8.0% ] 7.95% | 415 | 12.2% |
[ 8.0% - 8.5% ] 8.43% | 1,281 | 30.9% |
[ 8.5% - 9.0% ] 8.69% | 2,095 | 34.5% |
[ 9.5% - 10.0% ] 9.76% | 3,596 | 28.8% |
[ 10.5% - 11.0% ] 10.64% | 235 | 56.2% |
[ 10.5% - 11.0% ] 10.80% | 287 | 35.7% |
[ 20.0% - 20.5% ] 20.30% | 133 | 40.0% |
[ 23.0% - 23.5% ] 23.16% | 993 | 55.5% |
[ 25.0% - 25.5% ] 25.00% | 256 | 25.7% |
[ 26.5% - 27.0% ] 26.87% | 67 | 46.2% |