Immigrants from Spain 3 or more Vehicles in Household
COMPARE
Immigrants from Spain
Select to Compare
3 or more Vehicles in Household
Immigrants from Spain 3 or more Vehicles in Household
17.0%
3+ VEHICLES AVAILABLE
0.1/ 100
METRIC RATING
292nd/ 347
METRIC RANK
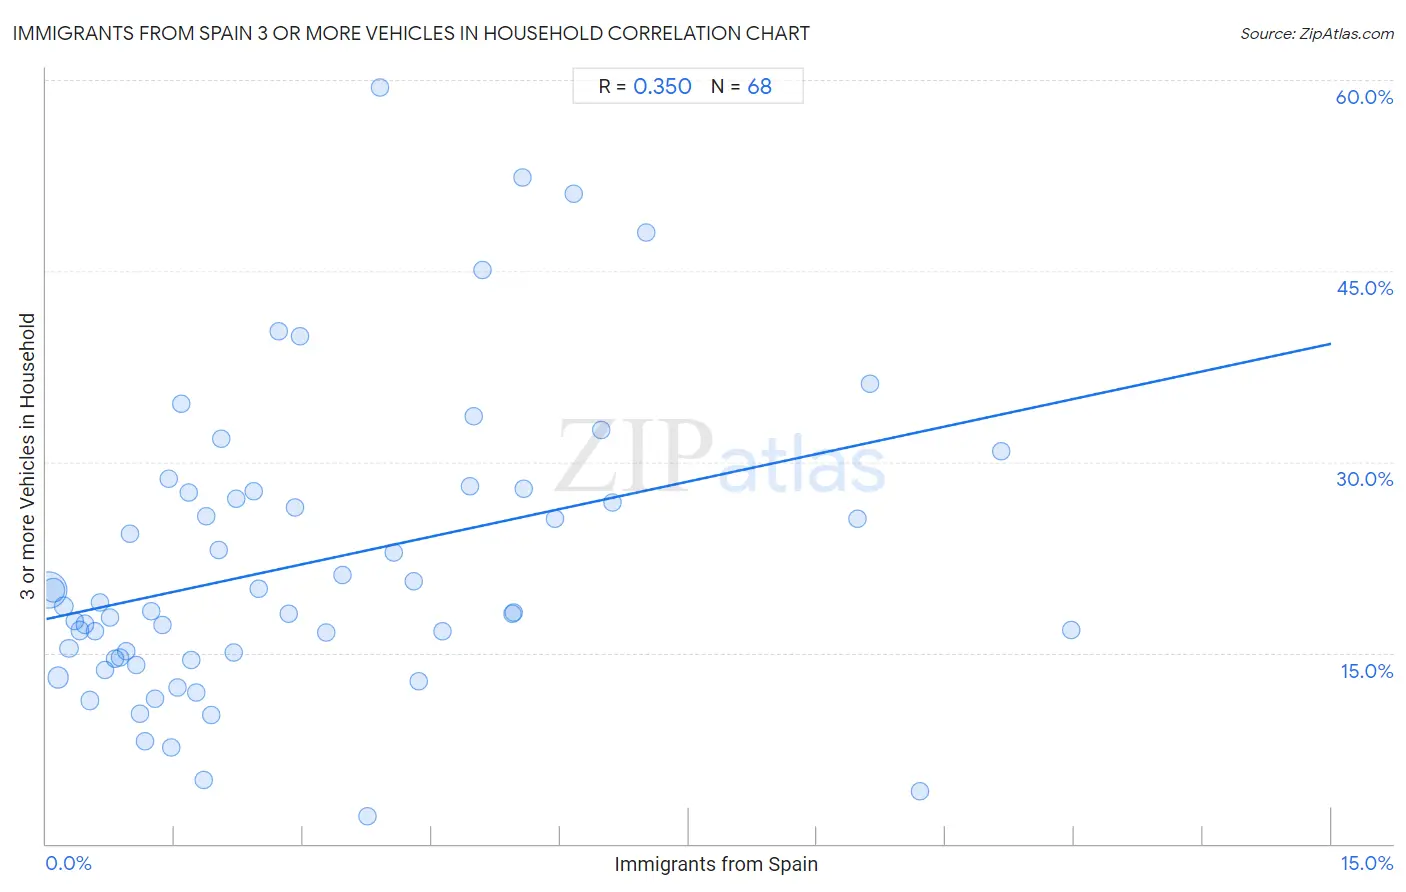
Immigrants from Spain 3 or more Vehicles in Household Correlation Chart
The statistical analysis conducted on geographies consisting of 239,543,690 people shows a mild positive correlation between the proportion of Immigrants from Spain and percentage of households with 3 or more vehicles available in the United States with a correlation coefficient (R) of 0.350 and weighted average of 17.0%. On average, for every 1% (one percent) increase in Immigrants from Spain within a typical geography, there is an increase of 1.4% in percentage of households with 3 or more vehicles available.
It is essential to understand that the correlation between the percentage of Immigrants from Spain and percentage of households with 3 or more vehicles available does not imply a direct cause-and-effect relationship. It remains uncertain whether the presence of Immigrants from Spain influences an upward or downward trend in the level of percentage of households with 3 or more vehicles available within an area, or if Immigrants from Spain simply ended up residing in those areas with higher or lower levels of percentage of households with 3 or more vehicles available due to other factors.
Demographics Similar to Immigrants from Spain by 3 or more Vehicles in Household
In terms of 3 or more vehicles in household, the demographic groups most similar to Immigrants from Spain are Bahamian (16.9%, a difference of 0.080%), Immigrants from Congo (17.0%, a difference of 0.11%), Immigrants from Western Africa (16.9%, a difference of 0.20%), Immigrants from Russia (16.9%, a difference of 0.25%), and Liberian (17.0%, a difference of 0.27%).
| Demographics | Rating | Rank | 3 or more Vehicles in Household |
| Immigrants from Croatia | 0.2 /100 | #285 | Tragic 17.2% |
| Menominee | 0.2 /100 | #286 | Tragic 17.2% |
| Immigrants from Brazil | 0.2 /100 | #287 | Tragic 17.1% |
| Immigrants from Uruguay | 0.2 /100 | #288 | Tragic 17.1% |
| Immigrants from Liberia | 0.1 /100 | #289 | Tragic 17.1% |
| Liberians | 0.1 /100 | #290 | Tragic 17.0% |
| Immigrants from Congo | 0.1 /100 | #291 | Tragic 17.0% |
| Immigrants from Spain | 0.1 /100 | #292 | Tragic 17.0% |
| Bahamians | 0.1 /100 | #293 | Tragic 16.9% |
| Immigrants from Western Africa | 0.1 /100 | #294 | Tragic 16.9% |
| Immigrants from Russia | 0.1 /100 | #295 | Tragic 16.9% |
| Inupiat | 0.1 /100 | #296 | Tragic 16.9% |
| Israelis | 0.1 /100 | #297 | Tragic 16.8% |
| Immigrants from Zaire | 0.1 /100 | #298 | Tragic 16.7% |
| Immigrants from South America | 0.1 /100 | #299 | Tragic 16.7% |
Immigrants from Spain 3 or more Vehicles in Household Correlation Summary
| Measurement | Immigrants from Spain Data | 3 or more Vehicles in Household Data |
| Minimum | 0.029% | 2.1% |
| Maximum | 12.0% | 59.4% |
| Range | 11.9% | 57.3% |
| Mean | 3.1% | 22.1% |
| Median | 2.0% | 18.4% |
| Interquartile 25% (IQ1) | 1.0% | 14.6% |
| Interquartile 75% (IQ3) | 4.8% | 27.6% |
| Interquartile Range (IQR) | 3.8% | 13.1% |
| Standard Deviation (Sample) | 2.8% | 11.7% |
| Standard Deviation (Population) | 2.8% | 11.6% |
Correlation Details
| Immigrants from Spain Percentile | Sample Size | 3 or more Vehicles in Household |
[ 0.0% - 0.5% ] 0.029% | 140,374,538 | 19.9% |
[ 0.0% - 0.5% ] 0.085% | 43,913,862 | 19.9% |
[ 0.0% - 0.5% ] 0.14% | 27,679,657 | 13.1% |
[ 0.0% - 0.5% ] 0.21% | 8,635,948 | 18.6% |
[ 0.0% - 0.5% ] 0.26% | 5,929,051 | 15.4% |
[ 0.0% - 0.5% ] 0.33% | 3,587,137 | 17.5% |
[ 0.0% - 0.5% ] 0.39% | 2,034,779 | 16.7% |
[ 0.0% - 0.5% ] 0.45% | 1,420,361 | 17.2% |
[ 0.5% - 1.0% ] 0.51% | 1,888,223 | 11.2% |
[ 0.5% - 1.0% ] 0.57% | 888,349 | 16.7% |
[ 0.5% - 1.0% ] 0.63% | 689,256 | 19.0% |
[ 0.5% - 1.0% ] 0.69% | 335,508 | 13.7% |
[ 0.5% - 1.0% ] 0.74% | 185,471 | 17.7% |
[ 0.5% - 1.0% ] 0.81% | 291,564 | 14.5% |
[ 0.5% - 1.0% ] 0.86% | 213,573 | 14.6% |
[ 0.5% - 1.0% ] 0.93% | 169,833 | 15.1% |
[ 0.5% - 1.0% ] 0.98% | 160,565 | 24.3% |
[ 1.0% - 1.5% ] 1.05% | 175,975 | 14.0% |
[ 1.0% - 1.5% ] 1.10% | 177,669 | 10.2% |
[ 1.0% - 1.5% ] 1.16% | 81,660 | 8.1% |
[ 1.0% - 1.5% ] 1.23% | 68,154 | 18.2% |
[ 1.0% - 1.5% ] 1.27% | 39,392 | 11.4% |
[ 1.0% - 1.5% ] 1.35% | 99,638 | 17.2% |
[ 1.0% - 1.5% ] 1.44% | 627 | 28.7% |
[ 1.0% - 1.5% ] 1.46% | 97,568 | 7.6% |
[ 1.5% - 2.0% ] 1.53% | 25,385 | 12.3% |
[ 1.5% - 2.0% ] 1.58% | 6,512 | 34.6% |
[ 1.5% - 2.0% ] 1.66% | 3,133 | 27.6% |
[ 1.5% - 2.0% ] 1.69% | 7,493 | 14.5% |
[ 1.5% - 2.0% ] 1.74% | 10,260 | 11.9% |
[ 1.5% - 2.0% ] 1.84% | 60,116 | 5.0% |
[ 1.5% - 2.0% ] 1.87% | 9,495 | 25.7% |
[ 1.5% - 2.0% ] 1.92% | 468 | 10.1% |
[ 2.0% - 2.5% ] 2.01% | 53,976 | 23.1% |
[ 2.0% - 2.5% ] 2.04% | 5,881 | 31.8% |
[ 2.0% - 2.5% ] 2.20% | 90,500 | 15.0% |
[ 2.0% - 2.5% ] 2.22% | 270 | 27.1% |
[ 2.0% - 2.5% ] 2.42% | 2,069 | 27.6% |
[ 2.0% - 2.5% ] 2.48% | 1,575 | 20.0% |
[ 2.5% - 3.0% ] 2.72% | 7,795 | 40.2% |
[ 2.5% - 3.0% ] 2.83% | 14,441 | 18.0% |
[ 2.5% - 3.0% ] 2.90% | 19,922 | 26.4% |
[ 2.5% - 3.0% ] 2.96% | 2,801 | 39.8% |
[ 3.0% - 3.5% ] 3.27% | 3,698 | 16.6% |
[ 3.0% - 3.5% ] 3.45% | 1,014 | 21.1% |
[ 3.5% - 4.0% ] 3.75% | 23,340 | 2.1% |
[ 3.5% - 4.0% ] 3.89% | 565 | 59.4% |
[ 4.0% - 4.5% ] 4.05% | 5,500 | 22.9% |
[ 4.0% - 4.5% ] 4.29% | 2,308 | 20.6% |
[ 4.0% - 4.5% ] 4.34% | 4,098 | 12.8% |
[ 4.5% - 5.0% ] 4.63% | 2,227 | 16.7% |
[ 4.5% - 5.0% ] 4.95% | 1,333 | 28.1% |
[ 4.5% - 5.0% ] 4.99% | 1,123 | 33.6% |
[ 5.0% - 5.5% ] 5.10% | 824 | 45.1% |
[ 5.0% - 5.5% ] 5.44% | 14,639 | 18.1% |
[ 5.0% - 5.5% ] 5.46% | 14,572 | 18.2% |
[ 5.5% - 6.0% ] 5.56% | 54 | 52.4% |
[ 5.5% - 6.0% ] 5.57% | 2,368 | 27.8% |
[ 5.5% - 6.0% ] 5.94% | 707 | 25.6% |
[ 6.0% - 6.5% ] 6.16% | 146 | 51.0% |
[ 6.0% - 6.5% ] 6.48% | 633 | 32.5% |
[ 6.5% - 7.0% ] 6.61% | 681 | 26.8% |
[ 7.0% - 7.5% ] 7.00% | 714 | 48.0% |
[ 9.0% - 9.5% ] 9.47% | 697 | 25.5% |
[ 9.5% - 10.0% ] 9.61% | 281 | 36.1% |
[ 10.0% - 10.5% ] 10.19% | 932 | 4.1% |
[ 11.0% - 11.5% ] 11.14% | 368 | 30.8% |
[ 11.5% - 12.0% ] 11.96% | 418 | 16.7% |