Hopi 3 or more Vehicles in Household

COMPARE

Hopi
Race
Ancestry
AfghanAfricanAlaska NativeAlaskan AthabascanAlbanianAleutAlsatianAmericanApacheArabArapahoArgentineanArmenianAssyrian/Chaldean/SyriacAustralianAustrianBahamianBangladeshiBarbadianBasqueBelgianBelizeanBermudanBhutaneseBlackfeetBolivianBrazilianBritishBritish West IndianBulgarianBurmeseCajunCambodianCanadianCape VerdeanCarpatho RusynCelticCentral AmericanCentral American IndianCherokeeCheyenneChickasawChileanChineseChippewaChoctawColombianColvilleComancheCosta RicanCreeCreekCroatianCrowCubanCypriotCzechCzechoslovakianDanishDelawareDominicanDutchDutch West IndianEastern EuropeanEcuadorianEgyptianEnglishEstonianEthiopianEuropeanFijianFilipinoFinnishFrenchFrench American IndianFrench CanadianGermanGerman RussianGhanaianGreekGuamanian/ChamorroGuatemalanGuyaneseHaitianHmongHonduranHopiHoumaHungarianIcelanderIndian (Asian)IndonesianInupiatIranianIraqiIrishIroquoisIsraeliItalianJamaicanJapaneseJordanianKenyanKiowaKoreanLaotianLatvianLebaneseLiberianLithuanianLumbeeLuxembourgerMacedonianMalaysianMalteseMarshalleseMenomineeMexicanMexican American IndianMongolianMoroccanNative HawaiianNavajoNepaleseNew ZealanderNicaraguanNigerianNorthern EuropeanNorwegianOkinawanOsageOttawaPaiutePakistaniPalestinianPanamanianParaguayanPennsylvania GermanPeruvianPimaPolishPortuguesePotawatomiPuebloPuerto RicanPuget Sound SalishRomanianRussianSalvadoranSamoanScandinavianScotch-IrishScottishSeminoleSenegaleseSerbianShoshoneSierra LeoneanSiouxSlavicSlovakSloveneSomaliSouth AfricanSouth AmericanSouth American IndianSoviet UnionSpaniardSpanishSpanish AmericanSpanish American IndianSri LankanSubsaharan AfricanSudaneseSwedishSwissSyrianTaiwaneseThaiTlingit-HaidaTohono O'OdhamTonganTrinidadian and TobagonianTsimshianTurkishU.S. Virgin IslanderUgandanUkrainianUruguayanUteVenezuelanVietnameseWelshWest IndianYakamaYaquiYugoslavianYumanYup'ikZimbabwean
Immigration
NonimmigrantsImmigrantsAfghanistanAfricaAlbaniaArgentinaArmeniaAsiaAustraliaAustriaBahamasBangladeshBarbadosBelarusBelgiumBelizeBoliviaBosnia and HerzegovinaBrazilBulgariaBurma/MyanmarCabo VerdeCambodiaCameroonCanadaCaribbeanCentral AmericaChileChinaColombiaCongoCosta RicaCroatiaCubaCzechoslovakiaDenmarkDominicaDominican RepublicEastern AfricaEastern AsiaEastern EuropeEcuadorEgyptEl SalvadorEnglandEritreaEthiopiaEuropeFijiFranceGermanyGhanaGreeceGrenadaGuatemalaGuyanaHaitiHondurasHong KongHungaryIndiaIndonesiaIranIraqIrelandIsraelItalyJamaicaJapanJordanKazakhstanKenyaKoreaKuwaitLaosLatin AmericaLatviaLebanonLiberiaLithuaniaMalaysiaMexicoMicronesiaMiddle AfricaMoldovaMoroccoNepalNetherlandsNicaraguaNigeriaNorth AmericaNorth MacedoniaNorthern AfricaNorthern EuropeNorwayOceaniaPakistanPanamaPeruPhilippinesPolandPortugalRomaniaRussiaSaudi ArabiaScotlandSenegalSerbiaSierra LeoneSingaporeSomaliaSouth AfricaSouth AmericaSouth Central AsiaSouth Eastern AsiaSouthern EuropeSpainSri LankaSt. Vincent and the GrenadinesSudanSwedenSwitzerlandSyriaTaiwanThailandTrinidad and TobagoTurkeyUgandaUkraineUruguayUzbekistanVenezuelaVietnamWest IndiesWestern AfricaWestern AsiaWestern EuropeYemenZaireZimbabweAzores
Select to Compare
Race
Ancestry
AfghanAfricanAlaska NativeAlaskan AthabascanAlbanianAleutAlsatianAmericanApacheArabArapahoArgentineanArmenianAssyrian/Chaldean/SyriacAustralianAustrianBahamianBangladeshiBarbadianBasqueBelgianBelizeanBermudanBhutaneseBlackfeetBolivianBrazilianBritishBritish West IndianBulgarianBurmeseCajunCambodianCanadianCape VerdeanCarpatho RusynCelticCentral AmericanCentral American IndianCherokeeCheyenneChickasawChileanChineseChippewaChoctawColombianColvilleComancheCosta RicanCreeCreekCroatianCrowCubanCypriotCzechCzechoslovakianDanishDelawareDominicanDutchDutch West IndianEastern EuropeanEcuadorianEgyptianEnglishEstonianEthiopianEuropeanFijianFilipinoFinnishFrenchFrench American IndianFrench CanadianGermanGerman RussianGhanaianGreekGuamanian/ChamorroGuatemalanGuyaneseHaitianHmongHonduranHoumaHungarianIcelanderIndian (Asian)IndonesianInupiatIranianIraqiIrishIroquoisIsraeliItalianJamaicanJapaneseJordanianKenyanKiowaKoreanLaotianLatvianLebaneseLiberianLithuanianLumbeeLuxembourgerMacedonianMalaysianMalteseMarshalleseMenomineeMexicanMexican American IndianMongolianMoroccanNative HawaiianNavajoNepaleseNew ZealanderNicaraguanNigerianNorthern EuropeanNorwegianOkinawanOsageOttawaPaiutePakistaniPalestinianPanamanianParaguayanPennsylvania GermanPeruvianPimaPolishPortuguesePotawatomiPuebloPuerto RicanPuget Sound SalishRomanianRussianSalvadoranSamoanScandinavianScotch-IrishScottishSeminoleSenegaleseSerbianShoshoneSierra LeoneanSiouxSlavicSlovakSloveneSomaliSouth AfricanSouth AmericanSouth American IndianSoviet UnionSpaniardSpanishSpanish AmericanSpanish American IndianSri LankanSubsaharan AfricanSudaneseSwedishSwissSyrianTaiwaneseThaiTlingit-HaidaTohono O'OdhamTonganTrinidadian and TobagonianTsimshianTurkishU.S. Virgin IslanderUgandanUkrainianUruguayanUteVenezuelanVietnameseWelshWest IndianYakamaYaquiYugoslavianYumanYup'ikZimbabwean
Immigration
NonimmigrantsImmigrantsAfghanistanAfricaAlbaniaArgentinaArmeniaAsiaAustraliaAustriaBahamasBangladeshBarbadosBelarusBelgiumBelizeBoliviaBosnia and HerzegovinaBrazilBulgariaBurma/MyanmarCabo VerdeCambodiaCameroonCanadaCaribbeanCentral AmericaChileChinaColombiaCongoCosta RicaCroatiaCubaCzechoslovakiaDenmarkDominicaDominican RepublicEastern AfricaEastern AsiaEastern EuropeEcuadorEgyptEl SalvadorEnglandEritreaEthiopiaEuropeFijiFranceGermanyGhanaGreeceGrenadaGuatemalaGuyanaHaitiHondurasHong KongHungaryIndiaIndonesiaIranIraqIrelandIsraelItalyJamaicaJapanJordanKazakhstanKenyaKoreaKuwaitLaosLatin AmericaLatviaLebanonLiberiaLithuaniaMalaysiaMexicoMicronesiaMiddle AfricaMoldovaMoroccoNepalNetherlandsNicaraguaNigeriaNorth AmericaNorth MacedoniaNorthern AfricaNorthern EuropeNorwayOceaniaPakistanPanamaPeruPhilippinesPolandPortugalRomaniaRussiaSaudi ArabiaScotlandSenegalSerbiaSierra LeoneSingaporeSomaliaSouth AfricaSouth AmericaSouth Central AsiaSouth Eastern AsiaSouthern EuropeSpainSri LankaSt. Vincent and the GrenadinesSudanSwedenSwitzerlandSyriaTaiwanThailandTrinidad and TobagoTurkeyUgandaUkraineUruguayUzbekistanVenezuelaVietnamWest IndiesWestern AfricaWestern AsiaWestern EuropeYemenZaireZimbabweAzores
3 or more Vehicles in Household
Income
Poverty
Unemployment
Labor Participation
Family Structure
Vehicle Availability
Education Level
Disability

Hopi 3 or more Vehicles in Household
Tragic

18.2%
3+ VEHICLES AVAILABLE
2.5/ 100
METRIC RATING
242nd/ 347
METRIC RANK

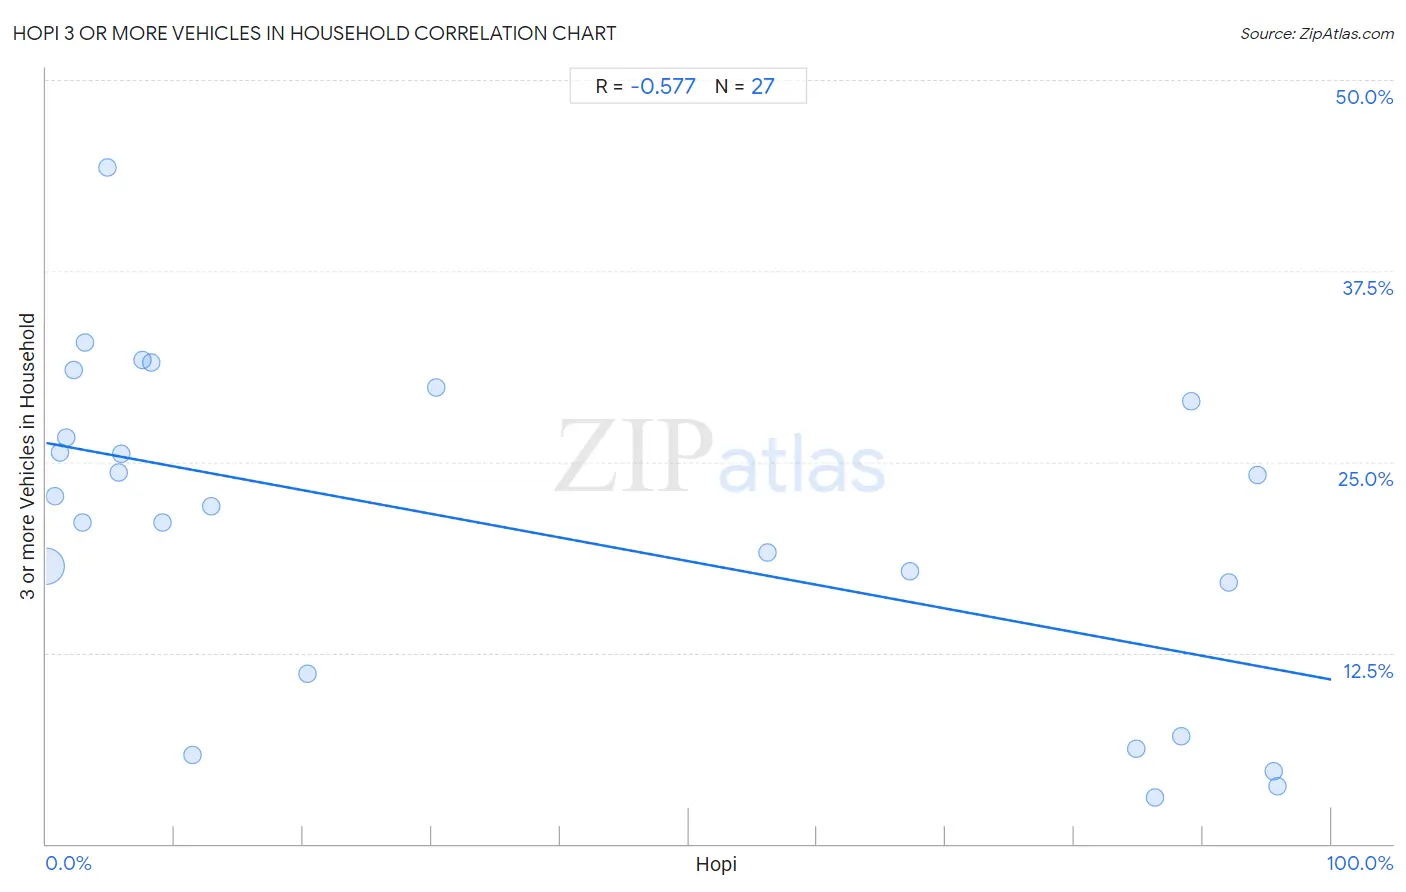
Hopi 3 or more Vehicles in Household Correlation Chart

The statistical analysis conducted on geographies consisting of 74,728,795 people shows a substantial negative correlation between the proportion of Hopi and percentage of households with 3 or more vehicles available in the United States with a correlation coefficient (R) of -0.577 and weighted average of 18.2%. On average, for every 1% (one percent) increase in Hopi within a typical geography, there is a decrease of 0.15% in percentage of households with 3 or more vehicles available.
Hopi 3 or more Vehicles in Household
It is essential to understand that the correlation between the percentage of Hopi and percentage of households with 3 or more vehicles available does not imply a direct cause-and-effect relationship. It remains uncertain whether the presence of Hopi influences an upward or downward trend in the level of percentage of households with 3 or more vehicles available within an area, or if Hopi simply ended up residing in those areas with higher or lower levels of percentage of households with 3 or more vehicles available due to other factors.

Demographics Similar to Hopi by 3 or more Vehicles in Household

In terms of 3 or more vehicles in household, the demographic groups most similar to Hopi are African (18.2%, a difference of 0.11%), Immigrants from Europe (18.1%, a difference of 0.12%), Mongolian (18.1%, a difference of 0.24%), Immigrants from China (18.2%, a difference of 0.31%), and Immigrants from Belize (18.1%, a difference of 0.39%).
DemographicsRating | Rank3 or more Vehicles in Household
Sierra Leoneans
3.9
/100
|
#235
Tragic
18.3%
Immigrants from Malaysia
3.6
/100
|
#236
Tragic
18.3%
Indonesians
3.5
/100
|
#237
Tragic
18.3%
Immigrants from Honduras
3.1
/100
|
#238
Tragic
18.2%
Immigrants from Middle Africa
3.1
/100
|
#239
Tragic
18.2%
Immigrants from China
2.9
/100
|
#240
Tragic
18.2%
Africans
2.7
/100
|
#241
Tragic
18.2%
Hopi
2.5
/100
|
#242
Tragic
18.2%
Immigrants from Europe
2.4
/100
|
#243
Tragic
18.1%
Mongolians
2.3
/100
|
#244
Tragic
18.1%
Immigrants from Belize
2.1
/100
|
#245
Tragic
18.1%
Immigrants from Australia
2.0
/100
|
#246
Tragic
18.1%
Carpatho Rusyns
1.9
/100
|
#247
Tragic
18.0%
Immigrants from Eastern Africa
1.8
/100
|
#248
Tragic
18.0%
Immigrants from Saudi Arabia
1.7
/100
|
#249
Tragic
18.0%

Hopi 3 or more Vehicles in Household Correlation Summary

MeasurementHopi Data3 or more Vehicles in Household Data
Minimum0.030%3.0%
Maximum95.9%44.3%
Range95.8%41.2%
Mean36.2%20.6%
Median11.4%22.1%
Interquartile 25% (IQ1)3.0%11.1%
Interquartile 75% (IQ3)86.2%29.0%
Interquartile Range (IQR)83.2%17.9%
Standard Deviation (Sample)39.4%10.6%
Standard Deviation (Population)38.6%10.4%

Correlation Details

Hopi PercentileSample Size3 or more Vehicles in Household
[
0.0%
-
0.5%
]
0.030%
73,931,47318.1%
[
0.5%
-
1.0%
]
0.66%
425,10222.7%
[
1.0%
-
1.5%
]
1.09%
214,08925.6%
[
1.5%
-
2.0%
]
1.57%
55,64826.6%
[
2.0%
-
2.5%
]
2.09%
21,91431.0%
[
2.5%
-
3.0%
]
2.78%
20,64621.0%
[
3.0%
-
3.5%
]
3.01%
7,31732.8%
[
4.5%
-
5.0%
]
4.73%
82444.3%
[
5.5%
-
6.0%
]
5.61%
8,88724.3%
[
5.5%
-
6.0%
]
5.86%
1,34725.5%
[
7.5%
-
8.0%
]
7.50%
6,77131.7%
[
8.0%
-
8.5%
]
8.22%
4,84231.5%
[
9.0%
-
9.5%
]
9.06%
57421.0%
[
11.0%
-
11.5%
]
11.37%
2115.8%
[
12.5%
-
13.0%
]
12.87%
11,15422.1%
[
20.0%
-
20.5%
]
20.32%
3,91811.1%
[
30.0%
-
30.5%
]
30.32%
34329.9%
[
56.0%
-
56.5%
]
56.12%
1,50419.1%
[
67.0%
-
67.5%
]
67.20%
43617.8%
[
84.5%
-
85.0%
]
84.79%
1,9666.2%
[
86.0%
-
86.5%
]
86.24%
1,4543.0%
[
88.0%
-
88.5%
]
88.35%
1,0647.1%
[
89.0%
-
89.5%
]
89.14%
1,37229.0%
[
91.5%
-
92.0%
]
91.99%
2,52317.1%
[
94.0%
-
94.5%
]
94.25%
88724.2%
[
95.5%
-
96.0%
]
95.52%
1,8294.7%
[
95.5%
-
96.0%
]
95.86%
7003.7%