Immigrants from Uganda 3 or more Vehicles in Household
COMPARE
Immigrants from Uganda
Select to Compare
3 or more Vehicles in Household
Immigrants from Uganda 3 or more Vehicles in Household
18.4%
3+ VEHICLES AVAILABLE
4.6/ 100
METRIC RATING
232nd/ 347
METRIC RANK
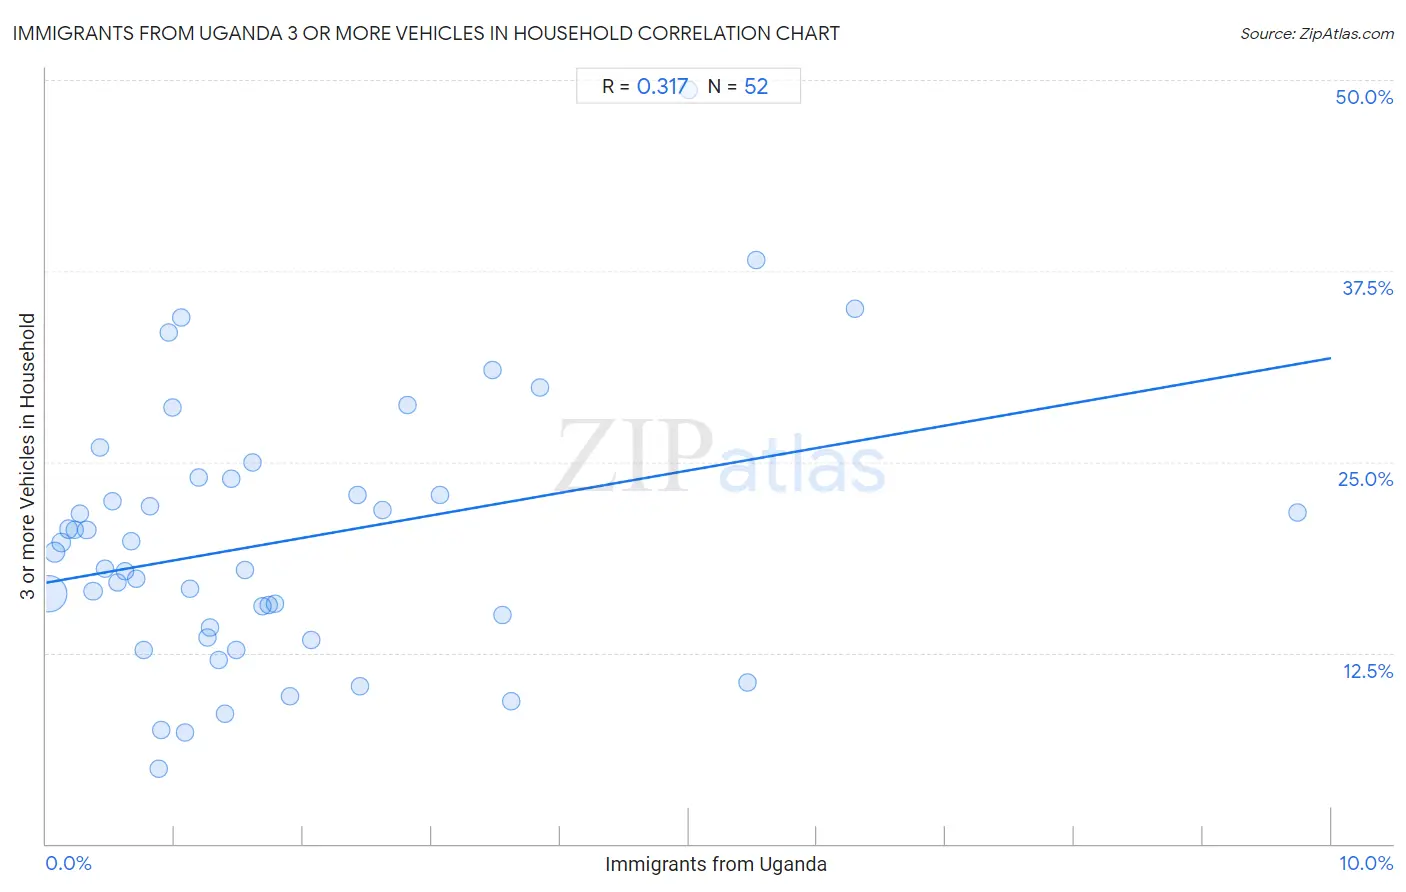
Immigrants from Uganda 3 or more Vehicles in Household Correlation Chart
The statistical analysis conducted on geographies consisting of 125,972,253 people shows a mild positive correlation between the proportion of Immigrants from Uganda and percentage of households with 3 or more vehicles available in the United States with a correlation coefficient (R) of 0.317 and weighted average of 18.4%. On average, for every 1% (one percent) increase in Immigrants from Uganda within a typical geography, there is an increase of 1.5% in percentage of households with 3 or more vehicles available.
It is essential to understand that the correlation between the percentage of Immigrants from Uganda and percentage of households with 3 or more vehicles available does not imply a direct cause-and-effect relationship. It remains uncertain whether the presence of Immigrants from Uganda influences an upward or downward trend in the level of percentage of households with 3 or more vehicles available within an area, or if Immigrants from Uganda simply ended up residing in those areas with higher or lower levels of percentage of households with 3 or more vehicles available due to other factors.
Demographics Similar to Immigrants from Uganda by 3 or more Vehicles in Household
In terms of 3 or more vehicles in household, the demographic groups most similar to Immigrants from Uganda are Honduran (18.4%, a difference of 0.020%), Immigrants from Belgium (18.4%, a difference of 0.060%), Immigrants from North Macedonia (18.4%, a difference of 0.080%), Immigrants from Western Asia (18.4%, a difference of 0.090%), and Immigrants from Switzerland (18.4%, a difference of 0.14%).
| Demographics | Rating | Rank | 3 or more Vehicles in Household |
| Immigrants from Lithuania | 5.6 /100 | #225 | Tragic 18.5% |
| Immigrants from Hungary | 5.5 /100 | #226 | Tragic 18.5% |
| Immigrants from Singapore | 5.4 /100 | #227 | Tragic 18.4% |
| Turks | 5.4 /100 | #228 | Tragic 18.4% |
| Immigrants from Switzerland | 5.0 /100 | #229 | Tragic 18.4% |
| Immigrants from Western Asia | 4.8 /100 | #230 | Tragic 18.4% |
| Immigrants from Belgium | 4.8 /100 | #231 | Tragic 18.4% |
| Immigrants from Uganda | 4.6 /100 | #232 | Tragic 18.4% |
| Hondurans | 4.6 /100 | #233 | Tragic 18.4% |
| Immigrants from North Macedonia | 4.4 /100 | #234 | Tragic 18.4% |
| Sierra Leoneans | 3.9 /100 | #235 | Tragic 18.3% |
| Immigrants from Malaysia | 3.6 /100 | #236 | Tragic 18.3% |
| Indonesians | 3.5 /100 | #237 | Tragic 18.3% |
| Immigrants from Honduras | 3.1 /100 | #238 | Tragic 18.2% |
| Immigrants from Middle Africa | 3.1 /100 | #239 | Tragic 18.2% |
Immigrants from Uganda 3 or more Vehicles in Household Correlation Summary
| Measurement | Immigrants from Uganda Data | 3 or more Vehicles in Household Data |
| Minimum | 0.016% | 4.9% |
| Maximum | 9.7% | 49.4% |
| Range | 9.7% | 44.5% |
| Mean | 1.8% | 19.8% |
| Median | 1.3% | 18.5% |
| Interquartile 25% (IQ1) | 0.64% | 13.8% |
| Interquartile 75% (IQ3) | 2.4% | 23.3% |
| Interquartile Range (IQR) | 1.8% | 9.5% |
| Standard Deviation (Sample) | 1.9% | 8.7% |
| Standard Deviation (Population) | 1.9% | 8.6% |
Correlation Details
| Immigrants from Uganda Percentile | Sample Size | 3 or more Vehicles in Household |
[ 0.0% - 0.5% ] 0.016% | 94,907,684 | 16.4% |
[ 0.0% - 0.5% ] 0.068% | 15,618,452 | 19.1% |
[ 0.0% - 0.5% ] 0.12% | 6,167,587 | 19.7% |
[ 0.0% - 0.5% ] 0.17% | 2,274,784 | 20.6% |
[ 0.0% - 0.5% ] 0.22% | 2,340,888 | 20.5% |
[ 0.0% - 0.5% ] 0.26% | 1,186,352 | 21.6% |
[ 0.0% - 0.5% ] 0.32% | 806,142 | 20.6% |
[ 0.0% - 0.5% ] 0.36% | 492,326 | 16.5% |
[ 0.0% - 0.5% ] 0.42% | 295,401 | 25.9% |
[ 0.0% - 0.5% ] 0.46% | 485,387 | 18.0% |
[ 0.5% - 1.0% ] 0.51% | 44,186 | 22.5% |
[ 0.5% - 1.0% ] 0.56% | 226,526 | 17.1% |
[ 0.5% - 1.0% ] 0.62% | 215,506 | 17.8% |
[ 0.5% - 1.0% ] 0.66% | 224,518 | 19.8% |
[ 0.5% - 1.0% ] 0.70% | 95,750 | 17.3% |
[ 0.5% - 1.0% ] 0.76% | 43,996 | 12.7% |
[ 0.5% - 1.0% ] 0.81% | 79,087 | 22.1% |
[ 0.5% - 1.0% ] 0.87% | 12,706 | 4.9% |
[ 0.5% - 1.0% ] 0.89% | 49,663 | 7.5% |
[ 0.5% - 1.0% ] 0.95% | 16,112 | 33.4% |
[ 0.5% - 1.0% ] 0.99% | 5,887 | 28.6% |
[ 1.0% - 1.5% ] 1.05% | 4,097 | 34.5% |
[ 1.0% - 1.5% ] 1.08% | 69,524 | 7.2% |
[ 1.0% - 1.5% ] 1.12% | 32,761 | 16.7% |
[ 1.0% - 1.5% ] 1.18% | 43,208 | 24.0% |
[ 1.0% - 1.5% ] 1.26% | 13,516 | 13.5% |
[ 1.0% - 1.5% ] 1.27% | 14,553 | 14.1% |
[ 1.0% - 1.5% ] 1.34% | 68,892 | 12.1% |
[ 1.0% - 1.5% ] 1.39% | 5,018 | 8.5% |
[ 1.0% - 1.5% ] 1.44% | 1,533 | 23.9% |
[ 1.0% - 1.5% ] 1.48% | 12,355 | 12.6% |
[ 1.5% - 2.0% ] 1.55% | 23,081 | 17.9% |
[ 1.5% - 2.0% ] 1.60% | 12,108 | 25.0% |
[ 1.5% - 2.0% ] 1.68% | 238 | 15.5% |
[ 1.5% - 2.0% ] 1.73% | 9,415 | 15.6% |
[ 1.5% - 2.0% ] 1.78% | 3,194 | 15.7% |
[ 1.5% - 2.0% ] 1.90% | 2,900 | 9.7% |
[ 2.0% - 2.5% ] 2.07% | 1,210 | 13.3% |
[ 2.0% - 2.5% ] 2.42% | 660 | 22.8% |
[ 2.0% - 2.5% ] 2.45% | 3,884 | 10.3% |
[ 2.5% - 3.0% ] 2.62% | 5,462 | 21.8% |
[ 2.5% - 3.0% ] 2.81% | 604 | 28.7% |
[ 3.0% - 3.5% ] 3.07% | 1,011 | 22.8% |
[ 3.0% - 3.5% ] 3.47% | 5,622 | 31.0% |
[ 3.5% - 4.0% ] 3.55% | 338 | 15.0% |
[ 3.5% - 4.0% ] 3.62% | 15,830 | 9.4% |
[ 3.5% - 4.0% ] 3.84% | 2,241 | 29.9% |
[ 5.0% - 5.5% ] 5.00% | 180 | 49.4% |
[ 5.0% - 5.5% ] 5.46% | 26,684 | 10.6% |
[ 5.5% - 6.0% ] 5.53% | 1,049 | 38.2% |
[ 6.0% - 6.5% ] 6.29% | 1,303 | 35.0% |
[ 9.5% - 10.0% ] 9.74% | 842 | 21.7% |