Immigrants from Germany 3 or more Vehicles in Household

COMPARE

Immigrants from Germany
Race
Ancestry
AfghanAfricanAlaska NativeAlaskan AthabascanAlbanianAleutAlsatianAmericanApacheArabArapahoArgentineanArmenianAssyrian/Chaldean/SyriacAustralianAustrianBahamianBangladeshiBarbadianBasqueBelgianBelizeanBermudanBhutaneseBlackfeetBolivianBrazilianBritishBritish West IndianBulgarianBurmeseCajunCambodianCanadianCape VerdeanCarpatho RusynCelticCentral AmericanCentral American IndianCherokeeCheyenneChickasawChileanChineseChippewaChoctawColombianColvilleComancheCosta RicanCreeCreekCroatianCrowCubanCypriotCzechCzechoslovakianDanishDelawareDominicanDutchDutch West IndianEastern EuropeanEcuadorianEgyptianEnglishEstonianEthiopianEuropeanFijianFilipinoFinnishFrenchFrench American IndianFrench CanadianGermanGerman RussianGhanaianGreekGuamanian/ChamorroGuatemalanGuyaneseHaitianHmongHonduranHopiHoumaHungarianIcelanderIndian (Asian)IndonesianInupiatIranianIraqiIrishIroquoisIsraeliItalianJamaicanJapaneseJordanianKenyanKiowaKoreanLaotianLatvianLebaneseLiberianLithuanianLumbeeLuxembourgerMacedonianMalaysianMalteseMarshalleseMenomineeMexicanMexican American IndianMongolianMoroccanNative HawaiianNavajoNepaleseNew ZealanderNicaraguanNigerianNorthern EuropeanNorwegianOkinawanOsageOttawaPaiutePakistaniPalestinianPanamanianParaguayanPennsylvania GermanPeruvianPimaPolishPortuguesePotawatomiPuebloPuerto RicanPuget Sound SalishRomanianRussianSalvadoranSamoanScandinavianScotch-IrishScottishSeminoleSenegaleseSerbianShoshoneSierra LeoneanSiouxSlavicSlovakSloveneSomaliSouth AfricanSouth AmericanSouth American IndianSoviet UnionSpaniardSpanishSpanish AmericanSpanish American IndianSri LankanSubsaharan AfricanSudaneseSwedishSwissSyrianTaiwaneseThaiTlingit-HaidaTohono O'OdhamTonganTrinidadian and TobagonianTsimshianTurkishU.S. Virgin IslanderUgandanUkrainianUruguayanUteVenezuelanVietnameseWelshWest IndianYakamaYaquiYugoslavianYumanYup'ikZimbabwean
Immigration
NonimmigrantsImmigrantsAfghanistanAfricaAlbaniaArgentinaArmeniaAsiaAustraliaAustriaBahamasBangladeshBarbadosBelarusBelgiumBelizeBoliviaBosnia and HerzegovinaBrazilBulgariaBurma/MyanmarCabo VerdeCambodiaCameroonCanadaCaribbeanCentral AmericaChileChinaColombiaCongoCosta RicaCroatiaCubaCzechoslovakiaDenmarkDominicaDominican RepublicEastern AfricaEastern AsiaEastern EuropeEcuadorEgyptEl SalvadorEnglandEritreaEthiopiaEuropeFijiFranceGermanyGhanaGreeceGrenadaGuatemalaGuyanaHaitiHondurasHong KongHungaryIndiaIndonesiaIranIraqIrelandIsraelItalyJamaicaJapanJordanKazakhstanKenyaKoreaKuwaitLaosLatin AmericaLatviaLebanonLiberiaLithuaniaMalaysiaMexicoMicronesiaMiddle AfricaMoldovaMoroccoNepalNetherlandsNicaraguaNigeriaNorth AmericaNorth MacedoniaNorthern AfricaNorthern EuropeNorwayOceaniaPakistanPanamaPeruPhilippinesPolandPortugalRomaniaRussiaSaudi ArabiaScotlandSenegalSerbiaSierra LeoneSingaporeSomaliaSouth AfricaSouth AmericaSouth Central AsiaSouth Eastern AsiaSouthern EuropeSpainSri LankaSt. Vincent and the GrenadinesSudanSwedenSwitzerlandSyriaTaiwanThailandTrinidad and TobagoTurkeyUgandaUkraineUruguayUzbekistanVenezuelaVietnamWest IndiesWestern AfricaWestern AsiaWestern EuropeYemenZaireZimbabweAzores
Select to Compare
Race
Ancestry
AfghanAfricanAlaska NativeAlaskan AthabascanAlbanianAleutAlsatianAmericanApacheArabArapahoArgentineanArmenianAssyrian/Chaldean/SyriacAustralianAustrianBahamianBangladeshiBarbadianBasqueBelgianBelizeanBermudanBhutaneseBlackfeetBolivianBrazilianBritishBritish West IndianBulgarianBurmeseCajunCambodianCanadianCape VerdeanCarpatho RusynCelticCentral AmericanCentral American IndianCherokeeCheyenneChickasawChileanChineseChippewaChoctawColombianColvilleComancheCosta RicanCreeCreekCroatianCrowCubanCypriotCzechCzechoslovakianDanishDelawareDominicanDutchDutch West IndianEastern EuropeanEcuadorianEgyptianEnglishEstonianEthiopianEuropeanFijianFilipinoFinnishFrenchFrench American IndianFrench CanadianGermanGerman RussianGhanaianGreekGuamanian/ChamorroGuatemalanGuyaneseHaitianHmongHonduranHopiHoumaHungarianIcelanderIndian (Asian)IndonesianInupiatIranianIraqiIrishIroquoisIsraeliItalianJamaicanJapaneseJordanianKenyanKiowaKoreanLaotianLatvianLebaneseLiberianLithuanianLumbeeLuxembourgerMacedonianMalaysianMalteseMarshalleseMenomineeMexicanMexican American IndianMongolianMoroccanNative HawaiianNavajoNepaleseNew ZealanderNicaraguanNigerianNorthern EuropeanNorwegianOkinawanOsageOttawaPaiutePakistaniPalestinianPanamanianParaguayanPennsylvania GermanPeruvianPimaPolishPortuguesePotawatomiPuebloPuerto RicanPuget Sound SalishRomanianRussianSalvadoranSamoanScandinavianScotch-IrishScottishSeminoleSenegaleseSerbianShoshoneSierra LeoneanSiouxSlavicSlovakSloveneSomaliSouth AfricanSouth AmericanSouth American IndianSoviet UnionSpaniardSpanishSpanish AmericanSpanish American IndianSri LankanSubsaharan AfricanSudaneseSwedishSwissSyrianTaiwaneseThaiTlingit-HaidaTohono O'OdhamTonganTrinidadian and TobagonianTsimshianTurkishU.S. Virgin IslanderUgandanUkrainianUruguayanUteVenezuelanVietnameseWelshWest IndianYakamaYaquiYugoslavianYumanYup'ikZimbabwean
Immigration
NonimmigrantsImmigrantsAfghanistanAfricaAlbaniaArgentinaArmeniaAsiaAustraliaAustriaBahamasBangladeshBarbadosBelarusBelgiumBelizeBoliviaBosnia and HerzegovinaBrazilBulgariaBurma/MyanmarCabo VerdeCambodiaCameroonCanadaCaribbeanCentral AmericaChileChinaColombiaCongoCosta RicaCroatiaCubaCzechoslovakiaDenmarkDominicaDominican RepublicEastern AfricaEastern AsiaEastern EuropeEcuadorEgyptEl SalvadorEnglandEritreaEthiopiaEuropeFijiFranceGhanaGreeceGrenadaGuatemalaGuyanaHaitiHondurasHong KongHungaryIndiaIndonesiaIranIraqIrelandIsraelItalyJamaicaJapanJordanKazakhstanKenyaKoreaKuwaitLaosLatin AmericaLatviaLebanonLiberiaLithuaniaMalaysiaMexicoMicronesiaMiddle AfricaMoldovaMoroccoNepalNetherlandsNicaraguaNigeriaNorth AmericaNorth MacedoniaNorthern AfricaNorthern EuropeNorwayOceaniaPakistanPanamaPeruPhilippinesPolandPortugalRomaniaRussiaSaudi ArabiaScotlandSenegalSerbiaSierra LeoneSingaporeSomaliaSouth AfricaSouth AmericaSouth Central AsiaSouth Eastern AsiaSouthern EuropeSpainSri LankaSt. Vincent and the GrenadinesSudanSwedenSwitzerlandSyriaTaiwanThailandTrinidad and TobagoTurkeyUgandaUkraineUruguayUzbekistanVenezuelaVietnamWest IndiesWestern AfricaWestern AsiaWestern EuropeYemenZaireZimbabweAzores
3 or more Vehicles in Household
Income
Poverty
Unemployment
Labor Participation
Family Structure
Vehicle Availability
Education Level
Disability

Immigrants from Germany 3 or more Vehicles in Household
Exceptional

20.8%
3+ VEHICLES AVAILABLE
97.4/ 100
METRIC RATING
107th/ 347
METRIC RANK

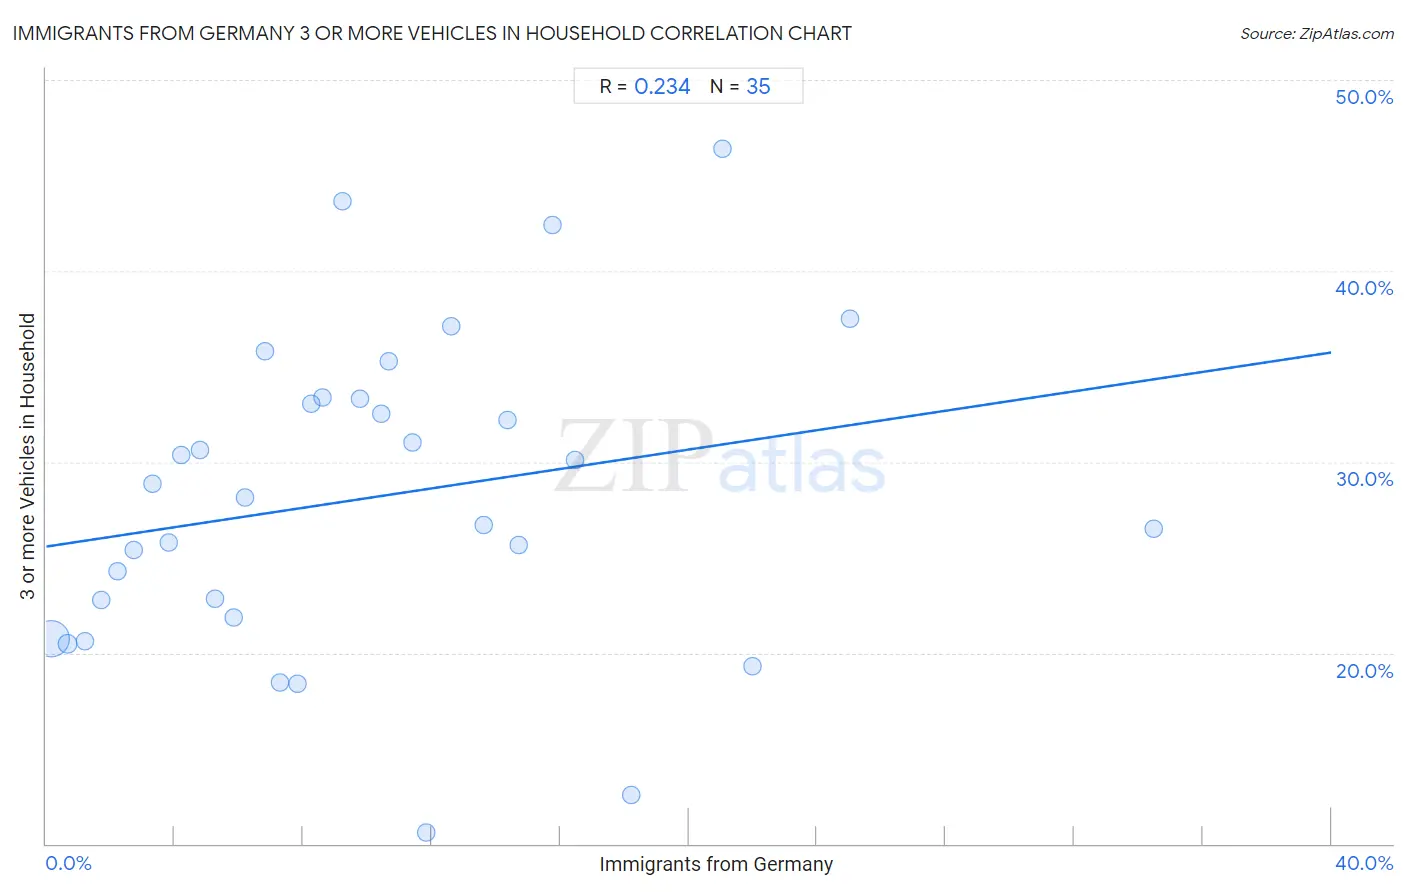
Immigrants from Germany 3 or more Vehicles in Household Correlation Chart

The statistical analysis conducted on geographies consisting of 463,650,570 people shows a weak positive correlation between the proportion of Immigrants from Germany and percentage of households with 3 or more vehicles available in the United States with a correlation coefficient (R) of 0.234 and weighted average of 20.8%. On average, for every 1% (one percent) increase in Immigrants from Germany within a typical geography, there is an increase of 0.25% in percentage of households with 3 or more vehicles available.
Immigrants from Germany 3 or more Vehicles in Household
It is essential to understand that the correlation between the percentage of Immigrants from Germany and percentage of households with 3 or more vehicles available does not imply a direct cause-and-effect relationship. It remains uncertain whether the presence of Immigrants from Germany influences an upward or downward trend in the level of percentage of households with 3 or more vehicles available within an area, or if Immigrants from Germany simply ended up residing in those areas with higher or lower levels of percentage of households with 3 or more vehicles available due to other factors.

Demographics Similar to Immigrants from Germany by 3 or more Vehicles in Household

In terms of 3 or more vehicles in household, the demographic groups most similar to Immigrants from Germany are Bolivian (20.8%, a difference of 0.040%), Austrian (20.9%, a difference of 0.13%), Immigrants from Scotland (20.8%, a difference of 0.15%), Filipino (20.8%, a difference of 0.21%), and Luxembourger (20.9%, a difference of 0.24%).
DemographicsRating | Rank3 or more Vehicles in Household
Comanche
98.2
/100
|
#100
Exceptional
21.0%
Blackfeet
97.9
/100
|
#101
Exceptional
20.9%
Seminole
97.8
/100
|
#102
Exceptional
20.9%
Dutch West Indians
97.8
/100
|
#103
Exceptional
20.9%
Luxembourgers
97.7
/100
|
#104
Exceptional
20.9%
Austrians
97.5
/100
|
#105
Exceptional
20.9%
Bolivians
97.4
/100
|
#106
Exceptional
20.8%
Immigrants from Germany
97.4
/100
|
#107
Exceptional
20.8%
Immigrants from Scotland
97.1
/100
|
#108
Exceptional
20.8%
Filipinos
97.0
/100
|
#109
Exceptional
20.8%
Asians
96.8
/100
|
#110
Exceptional
20.8%
Immigrants from Micronesia
96.7
/100
|
#111
Exceptional
20.7%
Nicaraguans
96.2
/100
|
#112
Exceptional
20.7%
Immigrants from England
96.2
/100
|
#113
Exceptional
20.7%
Burmese
95.8
/100
|
#114
Exceptional
20.6%

Immigrants from Germany 3 or more Vehicles in Household Correlation Summary

MeasurementImmigrants from Germany Data3 or more Vehicles in Household Data
Minimum0.16%10.6%
Maximum34.5%46.4%
Range34.3%35.8%
Mean10.1%28.1%
Median8.6%28.1%
Interquartile 25% (IQ1)4.2%21.9%
Interquartile 75% (IQ3)14.4%33.3%
Interquartile Range (IQR)10.1%11.4%
Standard Deviation (Sample)7.6%8.3%
Standard Deviation (Population)7.5%8.1%

Correlation Details

Immigrants from Germany PercentileSample Size3 or more Vehicles in Household
[
0.0%
-
0.5%
]
0.16%
431,418,83020.7%
[
0.5%
-
1.0%
]
0.66%
26,957,64120.5%
[
1.0%
-
1.5%
]
1.19%
3,562,22420.6%
[
1.5%
-
2.0%
]
1.71%
948,82922.8%
[
2.0%
-
2.5%
]
2.21%
327,13124.3%
[
2.5%
-
3.0%
]
2.71%
204,07725.4%
[
3.0%
-
3.5%
]
3.30%
82,46728.9%
[
3.5%
-
4.0%
]
3.80%
30,39625.7%
[
4.0%
-
4.5%
]
4.22%
29,90330.4%
[
4.5%
-
5.0%
]
4.77%
22,66830.7%
[
5.0%
-
5.5%
]
5.26%
22,98722.8%
[
5.5%
-
6.0%
]
5.86%
7,85621.9%
[
6.0%
-
6.5%
]
6.20%
4,46628.1%
[
6.5%
-
7.0%
]
6.82%
2,87435.8%
[
7.0%
-
7.5%
]
7.27%
6,29018.4%
[
7.5%
-
8.0%
]
7.81%
5,71318.4%
[
8.0%
-
8.5%
]
8.25%
2,14533.0%
[
8.5%
-
9.0%
]
8.60%
8,12533.4%
[
9.0%
-
9.5%
]
9.24%
69343.6%
[
9.5%
-
10.0%
]
9.78%
31733.3%
[
10.0%
-
10.5%
]
10.42%
1,20932.5%
[
10.5%
-
11.0%
]
10.67%
15035.3%
[
11.0%
-
11.5%
]
11.39%
43931.0%
[
11.5%
-
12.0%
]
11.84%
15210.6%
[
12.5%
-
13.0%
]
12.61%
59537.1%
[
13.5%
-
14.0%
]
13.64%
4426.7%
[
14.0%
-
14.5%
]
14.36%
20232.2%
[
14.5%
-
15.0%
]
14.69%
17725.7%
[
15.5%
-
16.0%
]
15.75%
27342.4%
[
16.0%
-
16.5%
]
16.47%
60730.1%
[
18.0%
-
18.5%
]
18.19%
83012.6%
[
21.0%
-
21.5%
]
21.05%
9546.4%
[
21.5%
-
22.0%
]
21.98%
9119.3%
[
25.0%
-
25.5%
]
25.00%
1637.5%
[
34.0%
-
34.5%
]
34.48%
5826.5%