Tohono O'odham 3 or more Vehicles in Household
COMPARE
Tohono O'odham
Select to Compare
3 or more Vehicles in Household
Tohono O'odham 3 or more Vehicles in Household
18.9%
3+ VEHICLES AVAILABLE
14.8/ 100
METRIC RATING
203rd/ 347
METRIC RANK
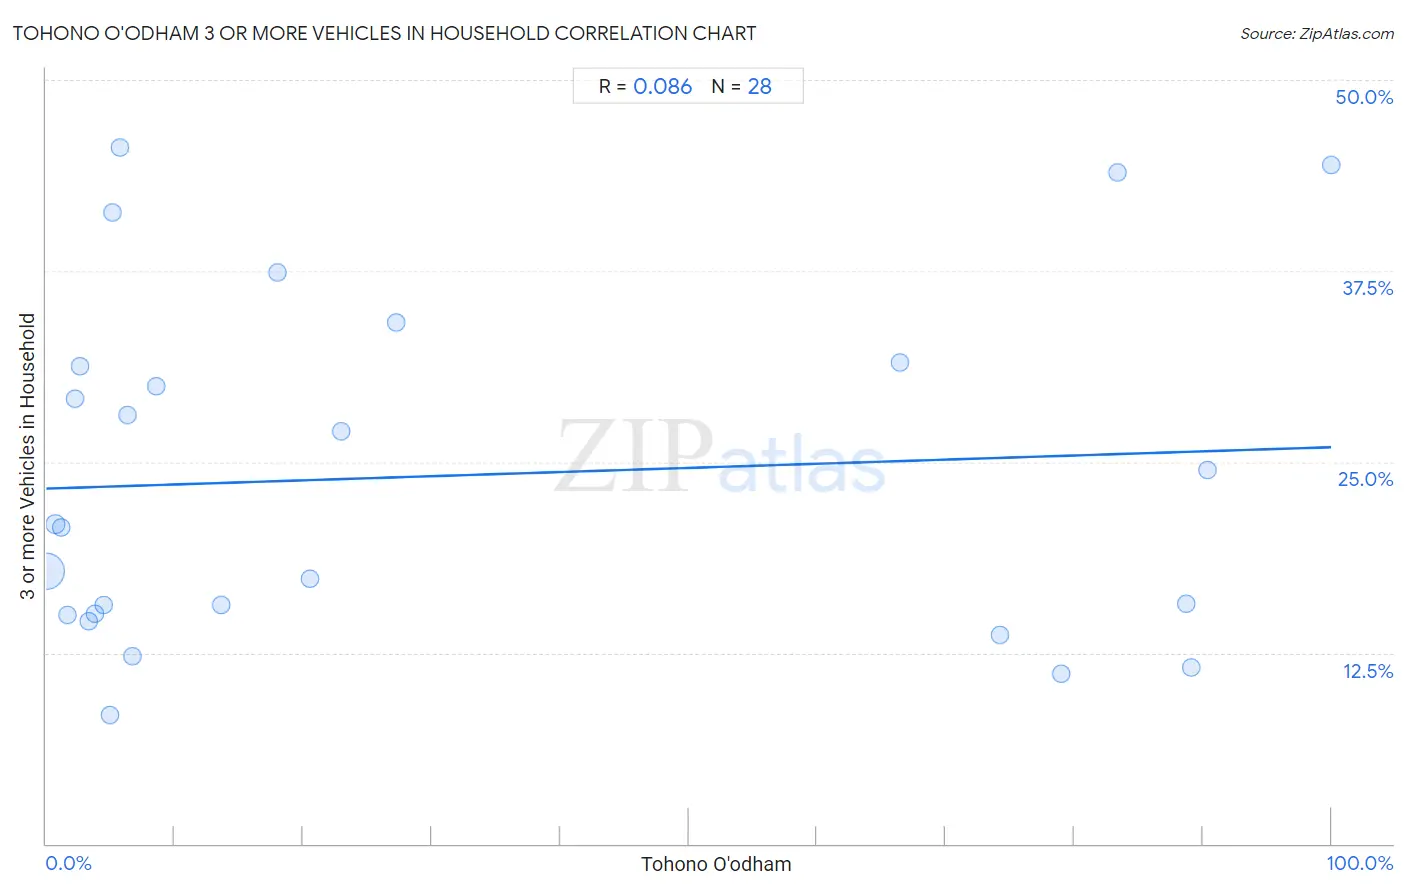
Tohono O'odham 3 or more Vehicles in Household Correlation Chart
The statistical analysis conducted on geographies consisting of 58,717,373 people shows a slight positive correlation between the proportion of Tohono O'odham and percentage of households with 3 or more vehicles available in the United States with a correlation coefficient (R) of 0.086 and weighted average of 18.9%. On average, for every 1% (one percent) increase in Tohono O'odham within a typical geography, there is an increase of 0.027% in percentage of households with 3 or more vehicles available.
It is essential to understand that the correlation between the percentage of Tohono O'odham and percentage of households with 3 or more vehicles available does not imply a direct cause-and-effect relationship. It remains uncertain whether the presence of Tohono O'odham influences an upward or downward trend in the level of percentage of households with 3 or more vehicles available within an area, or if Tohono O'odham simply ended up residing in those areas with higher or lower levels of percentage of households with 3 or more vehicles available due to other factors.
Demographics Similar to Tohono O'odham by 3 or more Vehicles in Household
In terms of 3 or more vehicles in household, the demographic groups most similar to Tohono O'odham are Immigrants from Romania (18.9%, a difference of 0.030%), Immigrants from Austria (18.9%, a difference of 0.090%), Russian (18.8%, a difference of 0.10%), Immigrants from Eastern Asia (18.8%, a difference of 0.11%), and Immigrants from Chile (18.8%, a difference of 0.19%).
| Demographics | Rating | Rank | 3 or more Vehicles in Household |
| Central American Indians | 22.2 /100 | #196 | Fair 19.0% |
| Immigrants from Japan | 22.0 /100 | #197 | Fair 19.0% |
| Egyptians | 19.5 /100 | #198 | Poor 19.0% |
| Immigrants from Norway | 19.0 /100 | #199 | Poor 19.0% |
| Argentineans | 18.2 /100 | #200 | Poor 18.9% |
| Arabs | 17.7 /100 | #201 | Poor 18.9% |
| Immigrants from Austria | 15.4 /100 | #202 | Poor 18.9% |
| Tohono O'odham | 14.8 /100 | #203 | Poor 18.9% |
| Immigrants from Romania | 14.6 /100 | #204 | Poor 18.9% |
| Russians | 14.2 /100 | #205 | Poor 18.8% |
| Immigrants from Eastern Asia | 14.1 /100 | #206 | Poor 18.8% |
| Immigrants from Chile | 13.6 /100 | #207 | Poor 18.8% |
| Immigrants from Burma/Myanmar | 13.6 /100 | #208 | Poor 18.8% |
| Immigrants from Egypt | 13.5 /100 | #209 | Poor 18.8% |
| Bulgarians | 13.1 /100 | #210 | Poor 18.8% |
Tohono O'odham 3 or more Vehicles in Household Correlation Summary
| Measurement | Tohono O'odham Data | 3 or more Vehicles in Household Data |
| Minimum | 0.034% | 8.4% |
| Maximum | 100.0% | 45.6% |
| Range | 100.0% | 37.1% |
| Mean | 29.7% | 24.1% |
| Median | 7.6% | 20.8% |
| Interquartile 25% (IQ1) | 3.6% | 15.0% |
| Interquartile 75% (IQ3) | 70.3% | 31.4% |
| Interquartile Range (IQR) | 66.8% | 16.4% |
| Standard Deviation (Sample) | 36.0% | 11.3% |
| Standard Deviation (Population) | 35.3% | 11.1% |
Correlation Details
| Tohono O'odham Percentile | Sample Size | 3 or more Vehicles in Household |
[ 0.0% - 0.5% ] 0.034% | 56,790,808 | 17.8% |
[ 0.5% - 1.0% ] 0.71% | 1,357,108 | 20.9% |
[ 1.0% - 1.5% ] 1.19% | 386,177 | 20.7% |
[ 1.5% - 2.0% ] 1.66% | 66,171 | 15.0% |
[ 2.0% - 2.5% ] 2.25% | 11,962 | 29.2% |
[ 2.5% - 3.0% ] 2.63% | 56,832 | 31.3% |
[ 3.0% - 3.5% ] 3.31% | 7,515 | 14.5% |
[ 3.5% - 4.0% ] 3.81% | 1,835 | 15.1% |
[ 4.0% - 4.5% ] 4.50% | 1,178 | 15.6% |
[ 4.5% - 5.0% ] 4.93% | 1,824 | 8.4% |
[ 5.0% - 5.5% ] 5.18% | 965 | 41.3% |
[ 5.5% - 6.0% ] 5.77% | 5,820 | 45.6% |
[ 6.0% - 6.5% ] 6.28% | 733 | 28.1% |
[ 6.5% - 7.0% ] 6.68% | 7,685 | 12.3% |
[ 8.5% - 9.0% ] 8.57% | 2,403 | 30.0% |
[ 13.5% - 14.0% ] 13.66% | 454 | 15.6% |
[ 18.0% - 18.5% ] 18.02% | 394 | 37.4% |
[ 20.5% - 21.0% ] 20.52% | 3,621 | 17.4% |
[ 22.5% - 23.0% ] 22.96% | 392 | 27.0% |
[ 27.0% - 27.5% ] 27.26% | 2,021 | 34.1% |
[ 66.0% - 66.5% ] 66.45% | 918 | 31.5% |
[ 74.0% - 74.5% ] 74.20% | 314 | 13.7% |
[ 78.5% - 79.0% ] 78.94% | 8,434 | 11.1% |
[ 83.0% - 83.5% ] 83.33% | 204 | 43.9% |
[ 88.5% - 89.0% ] 88.67% | 353 | 15.7% |
[ 89.0% - 89.5% ] 89.12% | 882 | 11.5% |
[ 90.0% - 90.5% ] 90.37% | 187 | 24.4% |
[ 99.5% - 100.0% ] 100.00% | 183 | 44.4% |