Immigrants from Lebanon 3 or more Vehicles in Household
COMPARE
Immigrants from Lebanon
Select to Compare
3 or more Vehicles in Household
Immigrants from Lebanon 3 or more Vehicles in Household
19.8%
3+ VEHICLES AVAILABLE
67.6/ 100
METRIC RATING
160th/ 347
METRIC RANK
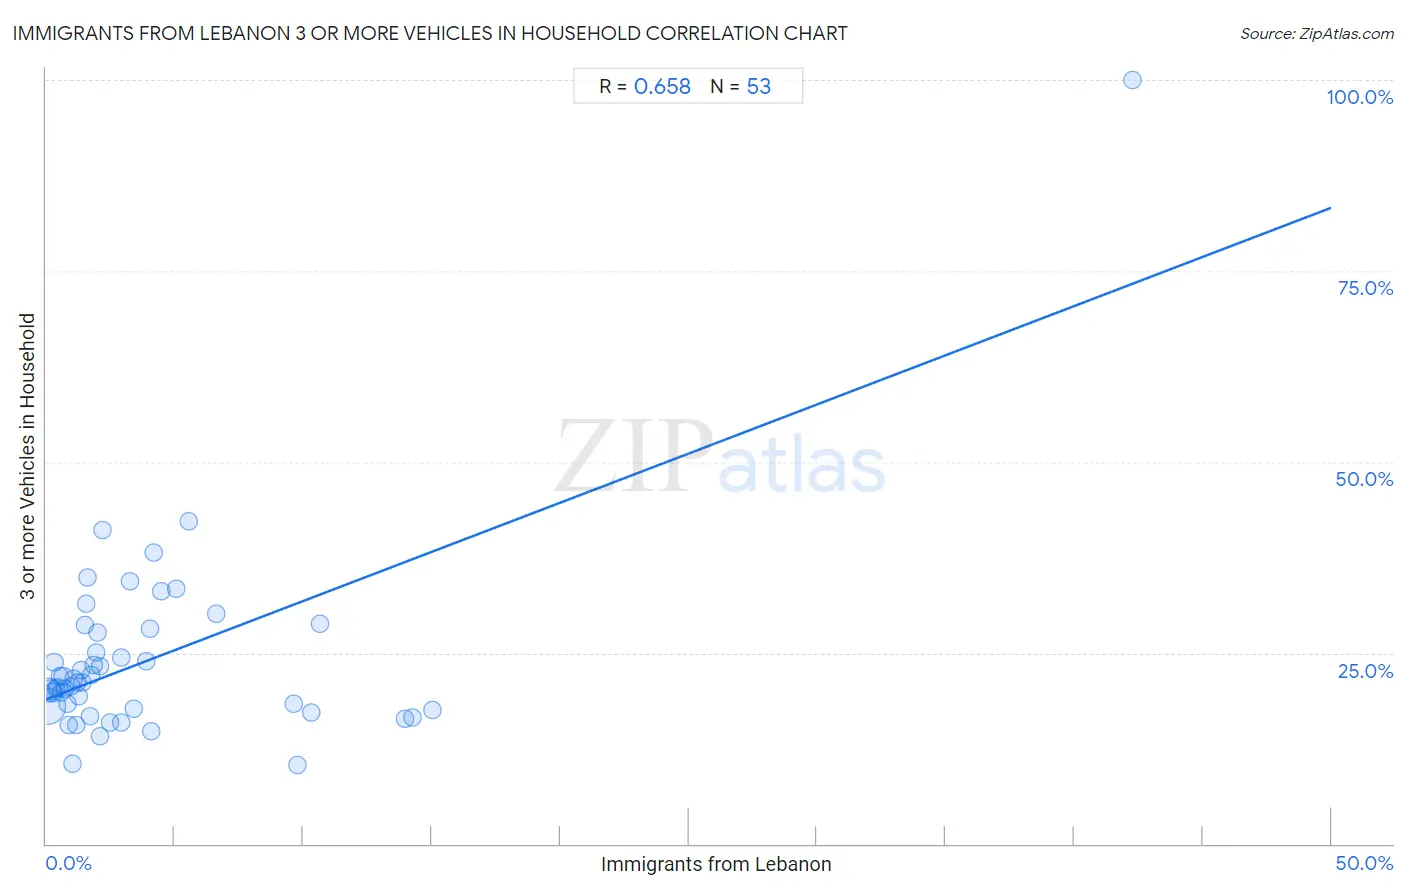
Immigrants from Lebanon 3 or more Vehicles in Household Correlation Chart
The statistical analysis conducted on geographies consisting of 217,088,415 people shows a significant positive correlation between the proportion of Immigrants from Lebanon and percentage of households with 3 or more vehicles available in the United States with a correlation coefficient (R) of 0.658 and weighted average of 19.8%. On average, for every 1% (one percent) increase in Immigrants from Lebanon within a typical geography, there is an increase of 1.3% in percentage of households with 3 or more vehicles available.
It is essential to understand that the correlation between the percentage of Immigrants from Lebanon and percentage of households with 3 or more vehicles available does not imply a direct cause-and-effect relationship. It remains uncertain whether the presence of Immigrants from Lebanon influences an upward or downward trend in the level of percentage of households with 3 or more vehicles available within an area, or if Immigrants from Lebanon simply ended up residing in those areas with higher or lower levels of percentage of households with 3 or more vehicles available due to other factors.
Demographics Similar to Immigrants from Lebanon by 3 or more Vehicles in Household
In terms of 3 or more vehicles in household, the demographic groups most similar to Immigrants from Lebanon are Immigrants from Pakistan (19.8%, a difference of 0.050%), Armenian (19.8%, a difference of 0.11%), Immigrants from Guatemala (19.7%, a difference of 0.16%), Hungarian (19.8%, a difference of 0.26%), and Thai (19.8%, a difference of 0.31%).
| Demographics | Rating | Rank | 3 or more Vehicles in Household |
| Yuman | 75.6 /100 | #153 | Good 19.9% |
| Immigrants from Jordan | 75.0 /100 | #154 | Good 19.9% |
| Tlingit-Haida | 73.4 /100 | #155 | Good 19.9% |
| Thais | 71.1 /100 | #156 | Good 19.8% |
| Hungarians | 70.5 /100 | #157 | Good 19.8% |
| Armenians | 68.8 /100 | #158 | Good 19.8% |
| Immigrants from Pakistan | 68.2 /100 | #159 | Good 19.8% |
| Immigrants from Lebanon | 67.6 /100 | #160 | Good 19.8% |
| Immigrants from Guatemala | 65.6 /100 | #161 | Good 19.7% |
| Estonians | 63.2 /100 | #162 | Good 19.7% |
| Chileans | 63.0 /100 | #163 | Good 19.7% |
| Yugoslavians | 62.9 /100 | #164 | Good 19.7% |
| Immigrants from Costa Rica | 61.9 /100 | #165 | Good 19.7% |
| Immigrants from Cameroon | 60.9 /100 | #166 | Good 19.7% |
| Ukrainians | 58.9 /100 | #167 | Average 19.6% |
Immigrants from Lebanon 3 or more Vehicles in Household Correlation Summary
| Measurement | Immigrants from Lebanon Data | 3 or more Vehicles in Household Data |
| Minimum | 0.032% | 10.3% |
| Maximum | 42.3% | 100.0% |
| Range | 42.2% | 89.7% |
| Mean | 4.0% | 24.1% |
| Median | 1.9% | 21.1% |
| Interquartile 25% (IQ1) | 0.91% | 17.5% |
| Interquartile 75% (IQ3) | 4.1% | 27.9% |
| Interquartile Range (IQR) | 3.2% | 10.4% |
| Standard Deviation (Sample) | 6.6% | 12.8% |
| Standard Deviation (Population) | 6.5% | 12.7% |
Correlation Details
| Immigrants from Lebanon Percentile | Sample Size | 3 or more Vehicles in Household |
[ 0.0% - 0.5% ] 0.032% | 132,049,368 | 18.1% |
[ 0.0% - 0.5% ] 0.096% | 44,559,824 | 20.1% |
[ 0.0% - 0.5% ] 0.17% | 18,030,668 | 20.1% |
[ 0.0% - 0.5% ] 0.24% | 7,616,303 | 19.8% |
[ 0.0% - 0.5% ] 0.31% | 4,214,405 | 23.8% |
[ 0.0% - 0.5% ] 0.38% | 2,706,104 | 20.3% |
[ 0.0% - 0.5% ] 0.46% | 1,649,209 | 20.5% |
[ 0.5% - 1.0% ] 0.53% | 1,521,871 | 22.0% |
[ 0.5% - 1.0% ] 0.59% | 1,237,261 | 19.8% |
[ 0.5% - 1.0% ] 0.66% | 486,617 | 22.0% |
[ 0.5% - 1.0% ] 0.73% | 224,378 | 20.3% |
[ 0.5% - 1.0% ] 0.82% | 337,554 | 18.3% |
[ 0.5% - 1.0% ] 0.87% | 396,072 | 15.6% |
[ 0.5% - 1.0% ] 0.95% | 405,265 | 20.6% |
[ 1.0% - 1.5% ] 1.00% | 135,135 | 10.5% |
[ 1.0% - 1.5% ] 1.09% | 243,728 | 21.5% |
[ 1.0% - 1.5% ] 1.15% | 32,927 | 15.6% |
[ 1.0% - 1.5% ] 1.23% | 210,781 | 21.1% |
[ 1.0% - 1.5% ] 1.27% | 358,285 | 19.4% |
[ 1.0% - 1.5% ] 1.38% | 71,971 | 22.8% |
[ 1.0% - 1.5% ] 1.43% | 29,065 | 21.2% |
[ 1.0% - 1.5% ] 1.49% | 33,278 | 28.6% |
[ 1.5% - 2.0% ] 1.57% | 3,450 | 31.4% |
[ 1.5% - 2.0% ] 1.63% | 6,083 | 34.9% |
[ 1.5% - 2.0% ] 1.70% | 23,589 | 16.7% |
[ 1.5% - 2.0% ] 1.76% | 43,412 | 22.1% |
[ 1.5% - 2.0% ] 1.87% | 20,371 | 23.3% |
[ 1.5% - 2.0% ] 1.93% | 35,408 | 25.1% |
[ 1.5% - 2.0% ] 1.98% | 6,260 | 27.6% |
[ 2.0% - 2.5% ] 2.09% | 24,229 | 14.2% |
[ 2.0% - 2.5% ] 2.11% | 15,377 | 23.2% |
[ 2.0% - 2.5% ] 2.20% | 3,544 | 41.1% |
[ 2.0% - 2.5% ] 2.46% | 284 | 15.8% |
[ 2.5% - 3.0% ] 2.93% | 205 | 24.4% |
[ 2.5% - 3.0% ] 2.94% | 22,831 | 15.9% |
[ 3.0% - 3.5% ] 3.26% | 2,025 | 34.3% |
[ 3.0% - 3.5% ] 3.42% | 34,046 | 17.6% |
[ 3.5% - 4.0% ] 3.89% | 411 | 23.9% |
[ 4.0% - 4.5% ] 4.04% | 99 | 28.2% |
[ 4.0% - 4.5% ] 4.08% | 8,919 | 14.8% |
[ 4.0% - 4.5% ] 4.17% | 2,589 | 38.2% |
[ 4.0% - 4.5% ] 4.46% | 1,501 | 33.0% |
[ 5.0% - 5.5% ] 5.04% | 1,945 | 33.4% |
[ 5.5% - 6.0% ] 5.54% | 3,252 | 42.2% |
[ 6.5% - 7.0% ] 6.61% | 469 | 30.1% |
[ 9.5% - 10.0% ] 9.61% | 108,414 | 18.3% |
[ 9.5% - 10.0% ] 9.79% | 429 | 10.3% |
[ 10.0% - 10.5% ] 10.31% | 62,474 | 17.2% |
[ 10.5% - 11.0% ] 10.66% | 12,405 | 28.8% |
[ 13.5% - 14.0% ] 13.97% | 229 | 16.3% |
[ 14.0% - 14.5% ] 14.27% | 53,044 | 16.5% |
[ 15.0% - 15.5% ] 15.03% | 40,392 | 17.4% |
[ 42.0% - 42.5% ] 42.27% | 660 | 100.0% |