Immigrants from Southern Europe 3 or more Vehicles in Household

COMPARE

Immigrants from Southern Europe
Race
Ancestry
AfghanAfricanAlaska NativeAlaskan AthabascanAlbanianAleutAlsatianAmericanApacheArabArapahoArgentineanArmenianAssyrian/Chaldean/SyriacAustralianAustrianBahamianBangladeshiBarbadianBasqueBelgianBelizeanBermudanBhutaneseBlackfeetBolivianBrazilianBritishBritish West IndianBulgarianBurmeseCajunCambodianCanadianCape VerdeanCarpatho RusynCelticCentral AmericanCentral American IndianCherokeeCheyenneChickasawChileanChineseChippewaChoctawColombianColvilleComancheCosta RicanCreeCreekCroatianCrowCubanCypriotCzechCzechoslovakianDanishDelawareDominicanDutchDutch West IndianEastern EuropeanEcuadorianEgyptianEnglishEstonianEthiopianEuropeanFijianFilipinoFinnishFrenchFrench American IndianFrench CanadianGermanGerman RussianGhanaianGreekGuamanian/ChamorroGuatemalanGuyaneseHaitianHmongHonduranHopiHoumaHungarianIcelanderIndian (Asian)IndonesianInupiatIranianIraqiIrishIroquoisIsraeliItalianJamaicanJapaneseJordanianKenyanKiowaKoreanLaotianLatvianLebaneseLiberianLithuanianLumbeeLuxembourgerMacedonianMalaysianMalteseMarshalleseMenomineeMexicanMexican American IndianMongolianMoroccanNative HawaiianNavajoNepaleseNew ZealanderNicaraguanNigerianNorthern EuropeanNorwegianOkinawanOsageOttawaPaiutePakistaniPalestinianPanamanianParaguayanPennsylvania GermanPeruvianPimaPolishPortuguesePotawatomiPuebloPuerto RicanPuget Sound SalishRomanianRussianSalvadoranSamoanScandinavianScotch-IrishScottishSeminoleSenegaleseSerbianShoshoneSierra LeoneanSiouxSlavicSlovakSloveneSomaliSouth AfricanSouth AmericanSouth American IndianSoviet UnionSpaniardSpanishSpanish AmericanSpanish American IndianSri LankanSubsaharan AfricanSudaneseSwedishSwissSyrianTaiwaneseThaiTlingit-HaidaTohono O'OdhamTonganTrinidadian and TobagonianTsimshianTurkishU.S. Virgin IslanderUgandanUkrainianUruguayanUteVenezuelanVietnameseWelshWest IndianYakamaYaquiYugoslavianYumanYup'ikZimbabwean
Immigration
NonimmigrantsImmigrantsAfghanistanAfricaAlbaniaArgentinaArmeniaAsiaAustraliaAustriaBahamasBangladeshBarbadosBelarusBelgiumBelizeBoliviaBosnia and HerzegovinaBrazilBulgariaBurma/MyanmarCabo VerdeCambodiaCameroonCanadaCaribbeanCentral AmericaChileChinaColombiaCongoCosta RicaCroatiaCubaCzechoslovakiaDenmarkDominicaDominican RepublicEastern AfricaEastern AsiaEastern EuropeEcuadorEgyptEl SalvadorEnglandEritreaEthiopiaEuropeFijiFranceGermanyGhanaGreeceGrenadaGuatemalaGuyanaHaitiHondurasHong KongHungaryIndiaIndonesiaIranIraqIrelandIsraelItalyJamaicaJapanJordanKazakhstanKenyaKoreaKuwaitLaosLatin AmericaLatviaLebanonLiberiaLithuaniaMalaysiaMexicoMicronesiaMiddle AfricaMoldovaMoroccoNepalNetherlandsNicaraguaNigeriaNorth AmericaNorth MacedoniaNorthern AfricaNorthern EuropeNorwayOceaniaPakistanPanamaPeruPhilippinesPolandPortugalRomaniaRussiaSaudi ArabiaScotlandSenegalSerbiaSierra LeoneSingaporeSomaliaSouth AfricaSouth AmericaSouth Central AsiaSouth Eastern AsiaSouthern EuropeSpainSri LankaSt. Vincent and the GrenadinesSudanSwedenSwitzerlandSyriaTaiwanThailandTrinidad and TobagoTurkeyUgandaUkraineUruguayUzbekistanVenezuelaVietnamWest IndiesWestern AfricaWestern AsiaWestern EuropeYemenZaireZimbabweAzores
Select to Compare
Race
Ancestry
AfghanAfricanAlaska NativeAlaskan AthabascanAlbanianAleutAlsatianAmericanApacheArabArapahoArgentineanArmenianAssyrian/Chaldean/SyriacAustralianAustrianBahamianBangladeshiBarbadianBasqueBelgianBelizeanBermudanBhutaneseBlackfeetBolivianBrazilianBritishBritish West IndianBulgarianBurmeseCajunCambodianCanadianCape VerdeanCarpatho RusynCelticCentral AmericanCentral American IndianCherokeeCheyenneChickasawChileanChineseChippewaChoctawColombianColvilleComancheCosta RicanCreeCreekCroatianCrowCubanCypriotCzechCzechoslovakianDanishDelawareDominicanDutchDutch West IndianEastern EuropeanEcuadorianEgyptianEnglishEstonianEthiopianEuropeanFijianFilipinoFinnishFrenchFrench American IndianFrench CanadianGermanGerman RussianGhanaianGreekGuamanian/ChamorroGuatemalanGuyaneseHaitianHmongHonduranHopiHoumaHungarianIcelanderIndian (Asian)IndonesianInupiatIranianIraqiIrishIroquoisIsraeliItalianJamaicanJapaneseJordanianKenyanKiowaKoreanLaotianLatvianLebaneseLiberianLithuanianLumbeeLuxembourgerMacedonianMalaysianMalteseMarshalleseMenomineeMexicanMexican American IndianMongolianMoroccanNative HawaiianNavajoNepaleseNew ZealanderNicaraguanNigerianNorthern EuropeanNorwegianOkinawanOsageOttawaPaiutePakistaniPalestinianPanamanianParaguayanPennsylvania GermanPeruvianPimaPolishPortuguesePotawatomiPuebloPuerto RicanPuget Sound SalishRomanianRussianSalvadoranSamoanScandinavianScotch-IrishScottishSeminoleSenegaleseSerbianShoshoneSierra LeoneanSiouxSlavicSlovakSloveneSomaliSouth AfricanSouth AmericanSouth American IndianSoviet UnionSpaniardSpanishSpanish AmericanSpanish American IndianSri LankanSubsaharan AfricanSudaneseSwedishSwissSyrianTaiwaneseThaiTlingit-HaidaTohono O'OdhamTonganTrinidadian and TobagonianTsimshianTurkishU.S. Virgin IslanderUgandanUkrainianUruguayanUteVenezuelanVietnameseWelshWest IndianYakamaYaquiYugoslavianYumanYup'ikZimbabwean
Immigration
NonimmigrantsImmigrantsAfghanistanAfricaAlbaniaArgentinaArmeniaAsiaAustraliaAustriaBahamasBangladeshBarbadosBelarusBelgiumBelizeBoliviaBosnia and HerzegovinaBrazilBulgariaBurma/MyanmarCabo VerdeCambodiaCameroonCanadaCaribbeanCentral AmericaChileChinaColombiaCongoCosta RicaCroatiaCubaCzechoslovakiaDenmarkDominicaDominican RepublicEastern AfricaEastern AsiaEastern EuropeEcuadorEgyptEl SalvadorEnglandEritreaEthiopiaEuropeFijiFranceGermanyGhanaGreeceGrenadaGuatemalaGuyanaHaitiHondurasHong KongHungaryIndiaIndonesiaIranIraqIrelandIsraelItalyJamaicaJapanJordanKazakhstanKenyaKoreaKuwaitLaosLatin AmericaLatviaLebanonLiberiaLithuaniaMalaysiaMexicoMicronesiaMiddle AfricaMoldovaMoroccoNepalNetherlandsNicaraguaNigeriaNorth AmericaNorth MacedoniaNorthern AfricaNorthern EuropeNorwayOceaniaPakistanPanamaPeruPhilippinesPolandPortugalRomaniaRussiaSaudi ArabiaScotlandSenegalSerbiaSierra LeoneSingaporeSomaliaSouth AfricaSouth AmericaSouth Central AsiaSouth Eastern AsiaSpainSri LankaSt. Vincent and the GrenadinesSudanSwedenSwitzerlandSyriaTaiwanThailandTrinidad and TobagoTurkeyUgandaUkraineUruguayUzbekistanVenezuelaVietnamWest IndiesWestern AfricaWestern AsiaWestern EuropeYemenZaireZimbabweAzores
3 or more Vehicles in Household
Income
Poverty
Unemployment
Labor Participation
Family Structure
Vehicle Availability
Education Level
Disability

Immigrants from Southern Europe 3 or more Vehicles in Household
Tragic

17.9%
3+ VEHICLES AVAILABLE
1.4/ 100
METRIC RATING
252nd/ 347
METRIC RANK

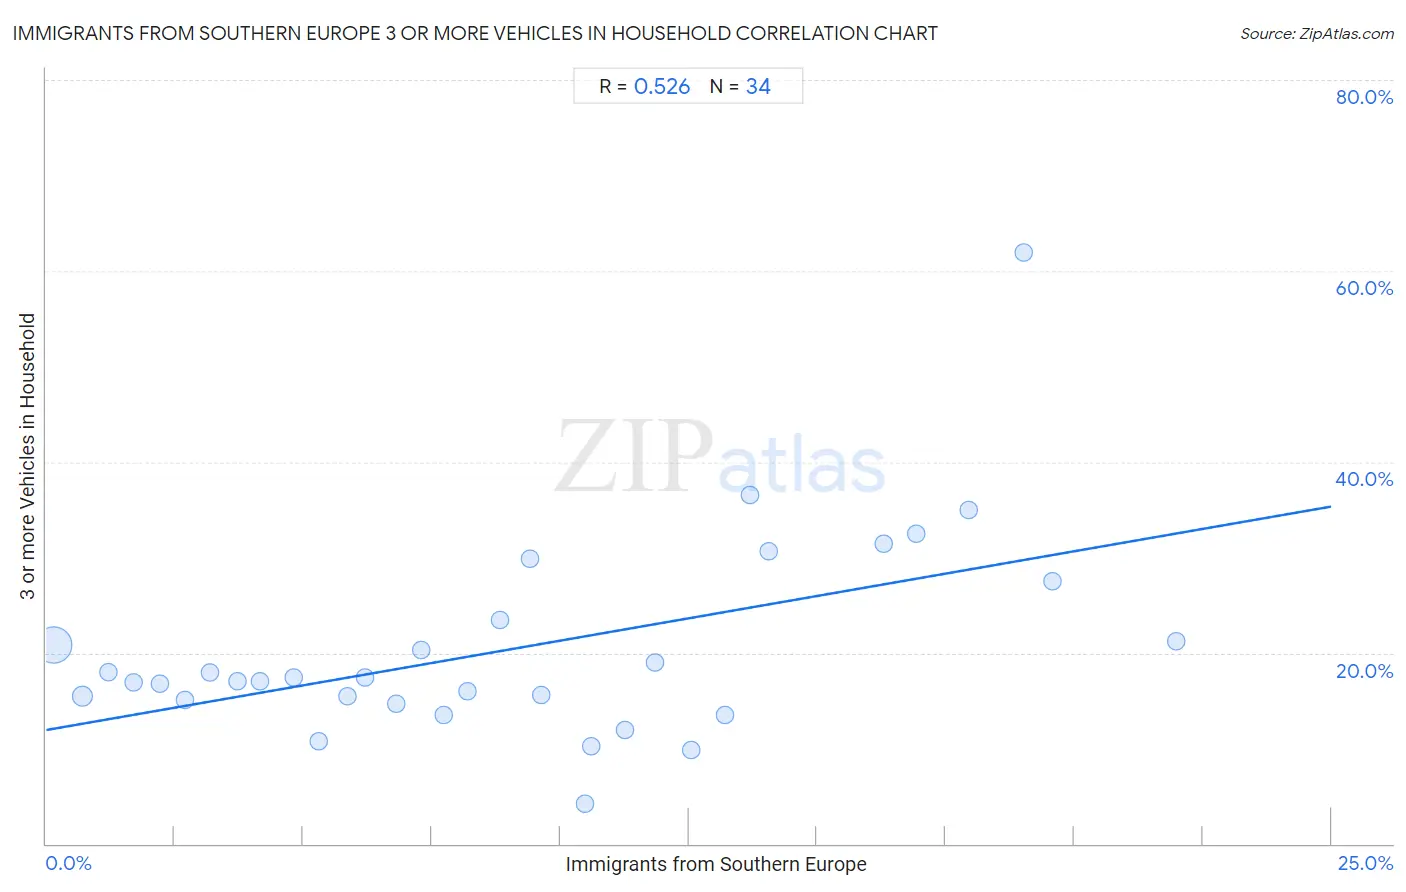
Immigrants from Southern Europe 3 or more Vehicles in Household Correlation Chart

The statistical analysis conducted on geographies consisting of 402,485,312 people shows a substantial positive correlation between the proportion of Immigrants from Southern Europe and percentage of households with 3 or more vehicles available in the United States with a correlation coefficient (R) of 0.526 and weighted average of 17.9%. On average, for every 1% (one percent) increase in Immigrants from Southern Europe within a typical geography, there is an increase of 0.94% in percentage of households with 3 or more vehicles available.
Immigrants from Southern Europe 3 or more Vehicles in Household
It is essential to understand that the correlation between the percentage of Immigrants from Southern Europe and percentage of households with 3 or more vehicles available does not imply a direct cause-and-effect relationship. It remains uncertain whether the presence of Immigrants from Southern Europe influences an upward or downward trend in the level of percentage of households with 3 or more vehicles available within an area, or if Immigrants from Southern Europe simply ended up residing in those areas with higher or lower levels of percentage of households with 3 or more vehicles available due to other factors.

Demographics Similar to Immigrants from Southern Europe by 3 or more Vehicles in Household

In terms of 3 or more vehicles in household, the demographic groups most similar to Immigrants from Southern Europe are Immigrants from Ethiopia (17.9%, a difference of 0.21%), Ethiopian (17.9%, a difference of 0.22%), Alsatian (18.0%, a difference of 0.23%), Immigrants from Turkey (17.9%, a difference of 0.25%), and Subsaharan African (17.9%, a difference of 0.40%).
DemographicsRating | Rank3 or more Vehicles in Household
Immigrants from Belize
2.1
/100
|
#245
Tragic
18.1%
Immigrants from Australia
2.0
/100
|
#246
Tragic
18.1%
Carpatho Rusyns
1.9
/100
|
#247
Tragic
18.0%
Immigrants from Eastern Africa
1.8
/100
|
#248
Tragic
18.0%
Immigrants from Saudi Arabia
1.7
/100
|
#249
Tragic
18.0%
Venezuelans
1.7
/100
|
#250
Tragic
18.0%
Alsatians
1.5
/100
|
#251
Tragic
18.0%
Immigrants from Southern Europe
1.4
/100
|
#252
Tragic
17.9%
Immigrants from Ethiopia
1.3
/100
|
#253
Tragic
17.9%
Ethiopians
1.2
/100
|
#254
Tragic
17.9%
Immigrants from Turkey
1.2
/100
|
#255
Tragic
17.9%
Sub-Saharan Africans
1.1
/100
|
#256
Tragic
17.9%
Immigrants from Eritrea
1.1
/100
|
#257
Tragic
17.8%
Sudanese
1.1
/100
|
#258
Tragic
17.8%
Uruguayans
1.0
/100
|
#259
Tragic
17.8%

Immigrants from Southern Europe 3 or more Vehicles in Household Correlation Summary

MeasurementImmigrants from Southern Europe Data3 or more Vehicles in Household Data
Minimum0.15%4.2%
Maximum22.0%61.9%
Range21.8%57.7%
Mean9.1%20.4%
Median8.5%17.2%
Interquartile 25% (IQ1)4.2%15.0%
Interquartile 75% (IQ3)13.2%23.4%
Interquartile Range (IQR)9.1%8.4%
Standard Deviation (Sample)5.9%10.6%
Standard Deviation (Population)5.9%10.4%

Correlation Details

Immigrants from Southern Europe PercentileSample Size3 or more Vehicles in Household
[
0.0%
-
0.5%
]
0.15%
333,114,91920.8%
[
0.5%
-
1.0%
]
0.71%
45,887,82315.5%
[
1.0%
-
1.5%
]
1.21%
11,987,41418.0%
[
1.5%
-
2.0%
]
1.70%
4,674,99216.9%
[
2.0%
-
2.5%
]
2.21%
1,860,28716.8%
[
2.5%
-
3.0%
]
2.71%
1,718,11815.0%
[
3.0%
-
3.5%
]
3.20%
903,87517.9%
[
3.5%
-
4.0%
]
3.72%
579,62317.1%
[
4.0%
-
4.5%
]
4.16%
259,87017.0%
[
4.5%
-
5.0%
]
4.82%
289,18717.4%
[
5.0%
-
5.5%
]
5.30%
206,37210.8%
[
5.5%
-
6.0%
]
5.86%
93,41415.5%
[
6.0%
-
6.5%
]
6.19%
93,91217.4%
[
6.5%
-
7.0%
]
6.80%
100,45014.7%
[
7.0%
-
7.5%
]
7.29%
18,19720.3%
[
7.5%
-
8.0%
]
7.72%
219,76413.5%
[
8.0%
-
8.5%
]
8.19%
85,59015.9%
[
8.5%
-
9.0%
]
8.83%
55,87423.4%
[
9.0%
-
9.5%
]
9.41%
82929.8%
[
9.5%
-
10.0%
]
9.63%
46,10215.6%
[
10.0%
-
10.5%
]
10.48%
59,3334.2%
[
10.5%
-
11.0%
]
10.61%
12,46510.2%
[
11.0%
-
11.5%
]
11.27%
125,12311.9%
[
11.5%
-
12.0%
]
11.85%
26,34519.0%
[
12.5%
-
13.0%
]
12.55%
26,8079.9%
[
13.0%
-
13.5%
]
13.21%
24,74013.5%
[
13.5%
-
14.0%
]
13.69%
6,90336.5%
[
14.0%
-
14.5%
]
14.05%
12130.6%
[
16.0%
-
16.5%
]
16.30%
9231.4%
[
16.5%
-
17.0%
]
16.92%
4,92832.5%
[
17.5%
-
18.0%
]
17.95%
23435.0%
[
19.0%
-
19.5%
]
19.01%
14261.9%
[
19.5%
-
20.0%
]
19.58%
1,14427.5%
[
21.5%
-
22.0%
]
21.98%
32321.2%