Egyptian 3 or more Vehicles in Household
COMPARE
Egyptian
Select to Compare
3 or more Vehicles in Household
Egyptian 3 or more Vehicles in Household
19.0%
3+ VEHICLES AVAILABLE
19.5/ 100
METRIC RATING
198th/ 347
METRIC RANK
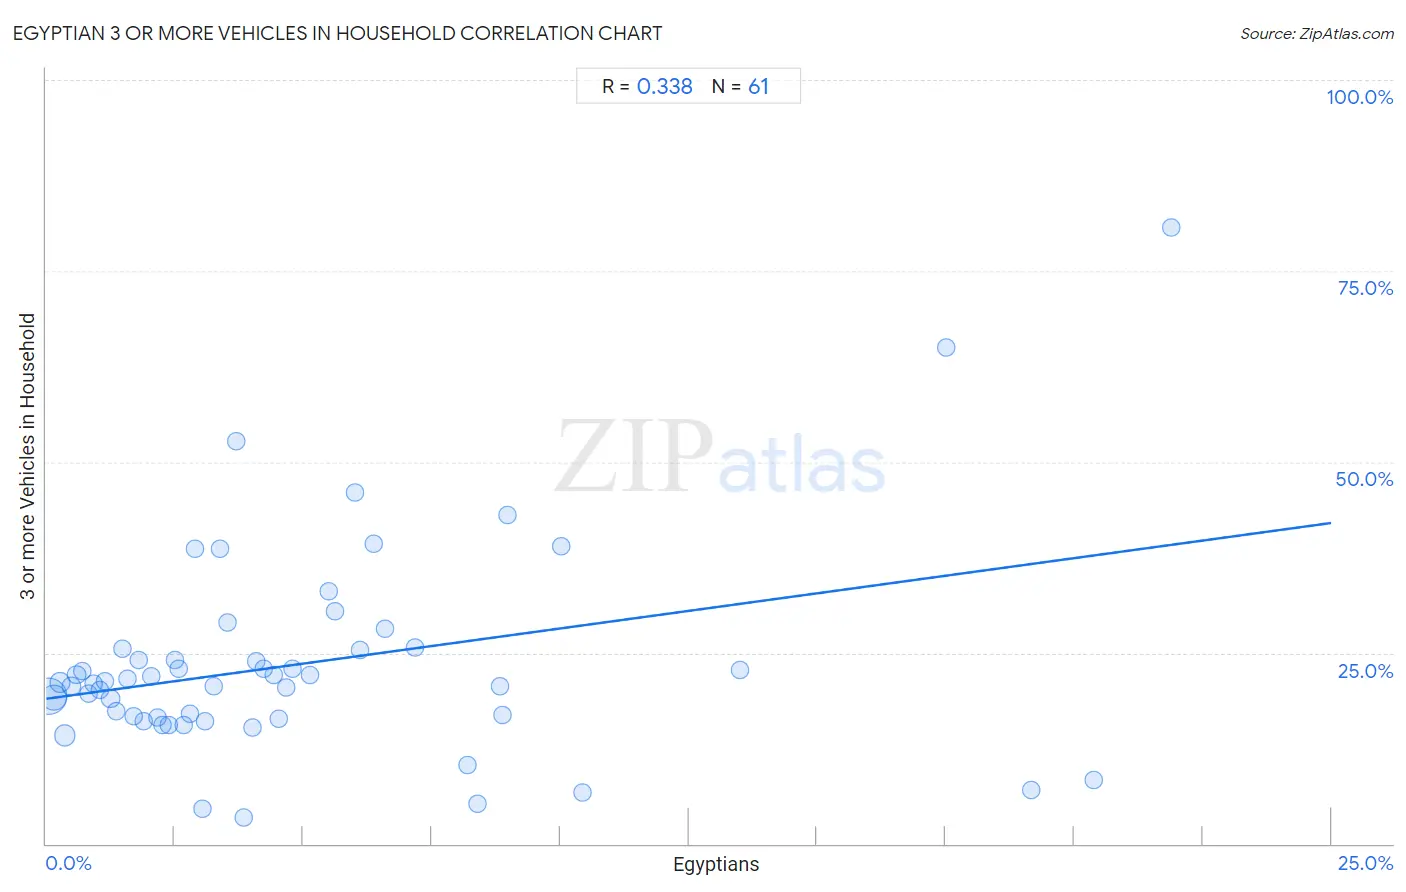
Egyptian 3 or more Vehicles in Household Correlation Chart
The statistical analysis conducted on geographies consisting of 276,676,150 people shows a mild positive correlation between the proportion of Egyptians and percentage of households with 3 or more vehicles available in the United States with a correlation coefficient (R) of 0.338 and weighted average of 19.0%. On average, for every 1% (one percent) increase in Egyptians within a typical geography, there is an increase of 0.92% in percentage of households with 3 or more vehicles available.
It is essential to understand that the correlation between the percentage of Egyptians and percentage of households with 3 or more vehicles available does not imply a direct cause-and-effect relationship. It remains uncertain whether the presence of Egyptians influences an upward or downward trend in the level of percentage of households with 3 or more vehicles available within an area, or if Egyptians simply ended up residing in those areas with higher or lower levels of percentage of households with 3 or more vehicles available due to other factors.
Demographics Similar to Egyptians by 3 or more Vehicles in Household
In terms of 3 or more vehicles in household, the demographic groups most similar to Egyptians are Immigrants from Norway (19.0%, a difference of 0.060%), Argentinean (18.9%, a difference of 0.17%), Arab (18.9%, a difference of 0.22%), Immigrants from Japan (19.0%, a difference of 0.30%), and Central American Indian (19.0%, a difference of 0.32%).
| Demographics | Rating | Rank | 3 or more Vehicles in Household |
| South American Indians | 25.4 /100 | #191 | Fair 19.1% |
| Kenyans | 24.7 /100 | #192 | Fair 19.1% |
| Tsimshian | 24.4 /100 | #193 | Fair 19.1% |
| Serbians | 24.0 /100 | #194 | Fair 19.1% |
| Immigrants from Moldova | 23.6 /100 | #195 | Fair 19.1% |
| Central American Indians | 22.2 /100 | #196 | Fair 19.0% |
| Immigrants from Japan | 22.0 /100 | #197 | Fair 19.0% |
| Egyptians | 19.5 /100 | #198 | Poor 19.0% |
| Immigrants from Norway | 19.0 /100 | #199 | Poor 19.0% |
| Argentineans | 18.2 /100 | #200 | Poor 18.9% |
| Arabs | 17.7 /100 | #201 | Poor 18.9% |
| Immigrants from Austria | 15.4 /100 | #202 | Poor 18.9% |
| Tohono O'odham | 14.8 /100 | #203 | Poor 18.9% |
| Immigrants from Romania | 14.6 /100 | #204 | Poor 18.9% |
| Russians | 14.2 /100 | #205 | Poor 18.8% |
Egyptian 3 or more Vehicles in Household Correlation Summary
| Measurement | Egyptian Data | 3 or more Vehicles in Household Data |
| Minimum | 0.048% | 3.4% |
| Maximum | 21.9% | 80.8% |
| Range | 21.8% | 77.3% |
| Mean | 4.9% | 23.5% |
| Median | 3.4% | 21.1% |
| Interquartile 25% (IQ1) | 1.6% | 16.5% |
| Interquartile 75% (IQ3) | 6.2% | 25.5% |
| Interquartile Range (IQR) | 4.6% | 9.0% |
| Standard Deviation (Sample) | 4.9% | 13.4% |
| Standard Deviation (Population) | 4.9% | 13.3% |
Correlation Details
| Egyptian Percentile | Sample Size | 3 or more Vehicles in Household |
[ 0.0% - 0.5% ] 0.048% | 148,513,424 | 19.3% |
[ 0.0% - 0.5% ] 0.16% | 57,285,051 | 19.1% |
[ 0.0% - 0.5% ] 0.27% | 20,109,747 | 21.1% |
[ 0.0% - 0.5% ] 0.36% | 22,755,337 | 14.2% |
[ 0.0% - 0.5% ] 0.49% | 7,440,668 | 20.7% |
[ 0.5% - 1.0% ] 0.60% | 4,831,139 | 22.1% |
[ 0.5% - 1.0% ] 0.70% | 3,224,368 | 22.6% |
[ 0.5% - 1.0% ] 0.82% | 2,417,282 | 19.6% |
[ 0.5% - 1.0% ] 0.93% | 1,797,091 | 20.9% |
[ 1.0% - 1.5% ] 1.04% | 1,979,180 | 20.2% |
[ 1.0% - 1.5% ] 1.14% | 855,863 | 21.3% |
[ 1.0% - 1.5% ] 1.25% | 676,576 | 19.0% |
[ 1.0% - 1.5% ] 1.35% | 774,686 | 17.3% |
[ 1.0% - 1.5% ] 1.48% | 391,296 | 25.6% |
[ 1.5% - 2.0% ] 1.59% | 416,568 | 21.6% |
[ 1.5% - 2.0% ] 1.69% | 513,256 | 16.6% |
[ 1.5% - 2.0% ] 1.80% | 290,419 | 24.0% |
[ 1.5% - 2.0% ] 1.89% | 742,845 | 16.1% |
[ 2.0% - 2.5% ] 2.04% | 262,183 | 22.0% |
[ 2.0% - 2.5% ] 2.16% | 122,258 | 16.6% |
[ 2.0% - 2.5% ] 2.27% | 28,023 | 15.5% |
[ 2.0% - 2.5% ] 2.37% | 77,570 | 15.5% |
[ 2.5% - 3.0% ] 2.51% | 9,255 | 24.0% |
[ 2.5% - 3.0% ] 2.58% | 159,607 | 23.0% |
[ 2.5% - 3.0% ] 2.66% | 145,756 | 15.5% |
[ 2.5% - 3.0% ] 2.79% | 96,434 | 17.1% |
[ 2.5% - 3.0% ] 2.90% | 3,965 | 38.7% |
[ 3.0% - 3.5% ] 3.03% | 77,913 | 4.6% |
[ 3.0% - 3.5% ] 3.10% | 113,794 | 16.1% |
[ 3.0% - 3.5% ] 3.25% | 9,596 | 20.6% |
[ 3.0% - 3.5% ] 3.38% | 5,444 | 38.6% |
[ 3.5% - 4.0% ] 3.53% | 18,086 | 28.9% |
[ 3.5% - 4.0% ] 3.70% | 81 | 52.8% |
[ 3.5% - 4.0% ] 3.83% | 58,053 | 3.4% |
[ 4.0% - 4.5% ] 4.01% | 5,835 | 15.2% |
[ 4.0% - 4.5% ] 4.09% | 60,303 | 23.8% |
[ 4.0% - 4.5% ] 4.22% | 13,070 | 22.9% |
[ 4.0% - 4.5% ] 4.44% | 36,823 | 22.1% |
[ 4.5% - 5.0% ] 4.52% | 155 | 16.4% |
[ 4.5% - 5.0% ] 4.67% | 52,230 | 20.5% |
[ 4.5% - 5.0% ] 4.79% | 4,782 | 22.8% |
[ 5.0% - 5.5% ] 5.13% | 99,800 | 22.1% |
[ 5.0% - 5.5% ] 5.49% | 601 | 33.0% |
[ 5.5% - 6.0% ] 5.61% | 659 | 30.5% |
[ 5.5% - 6.0% ] 5.99% | 3,553 | 45.9% |
[ 6.0% - 6.5% ] 6.10% | 6,952 | 25.3% |
[ 6.0% - 6.5% ] 6.36% | 14,518 | 39.3% |
[ 6.5% - 7.0% ] 6.59% | 8,410 | 28.2% |
[ 7.0% - 7.5% ] 7.17% | 7,017 | 25.8% |
[ 8.0% - 8.5% ] 8.20% | 140,994 | 10.3% |
[ 8.0% - 8.5% ] 8.40% | 750 | 5.3% |
[ 8.5% - 9.0% ] 8.83% | 1,155 | 20.7% |
[ 8.5% - 9.0% ] 8.89% | 1,429 | 16.9% |
[ 8.5% - 9.0% ] 8.97% | 747 | 43.0% |
[ 10.0% - 10.5% ] 10.02% | 5,751 | 38.9% |
[ 10.0% - 10.5% ] 10.44% | 5,000 | 6.7% |
[ 13.0% - 13.5% ] 13.49% | 1,394 | 22.7% |
[ 17.0% - 17.5% ] 17.50% | 120 | 65.0% |
[ 19.0% - 19.5% ] 19.16% | 981 | 7.1% |
[ 20.0% - 20.5% ] 20.38% | 211 | 8.3% |
[ 21.5% - 22.0% ] 21.88% | 96 | 80.8% |