Immigrants from Burma/Myanmar 3 or more Vehicles in Household
COMPARE
Immigrants from Burma/Myanmar
Select to Compare
3 or more Vehicles in Household
Immigrants from Burma/Myanmar 3 or more Vehicles in Household
18.8%
3+ VEHICLES AVAILABLE
13.6/ 100
METRIC RATING
208th/ 347
METRIC RANK
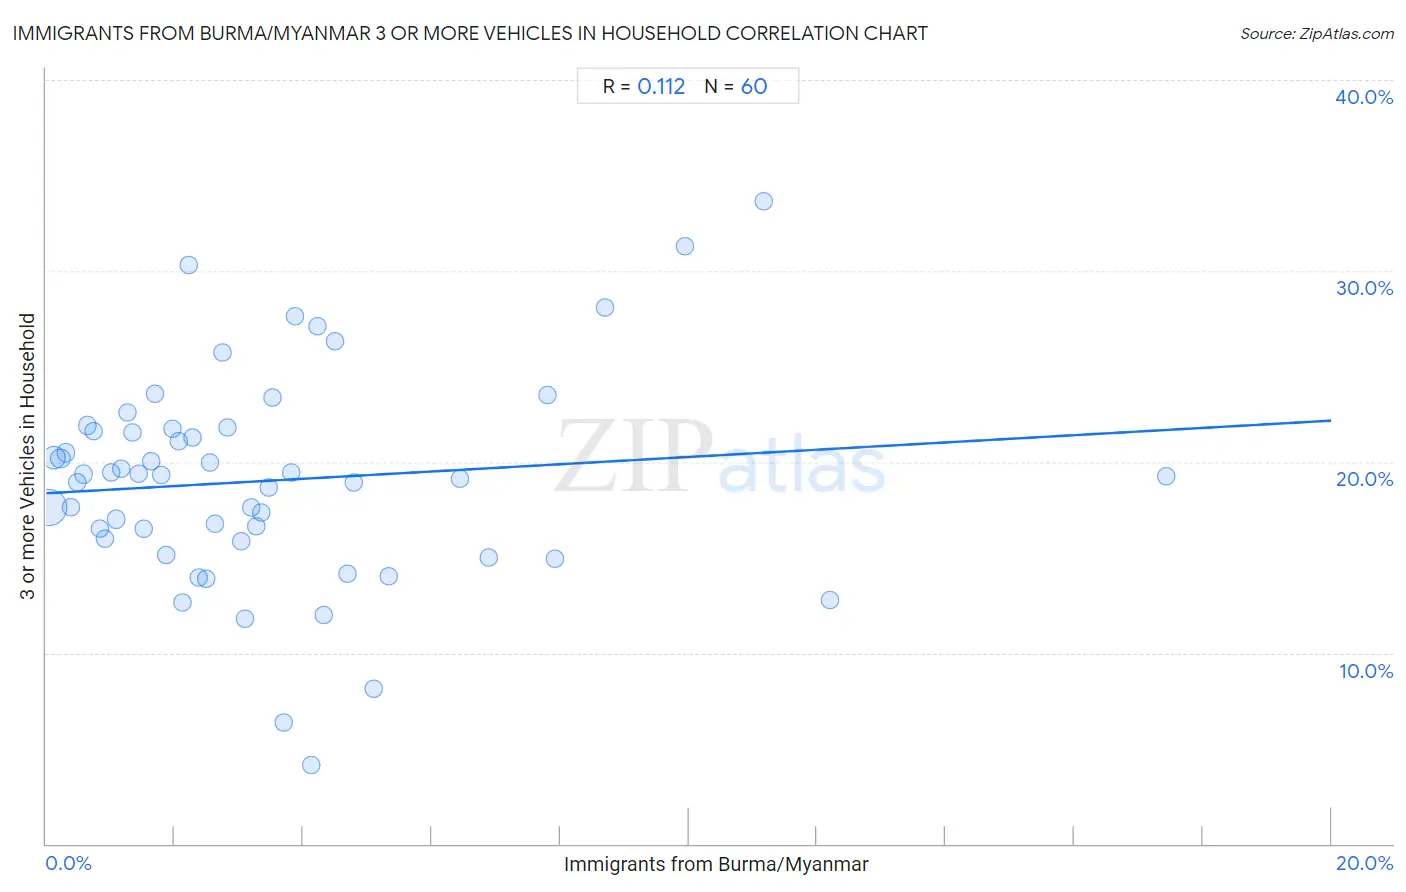
Immigrants from Burma/Myanmar 3 or more Vehicles in Household Correlation Chart
The statistical analysis conducted on geographies consisting of 172,233,426 people shows a poor positive correlation between the proportion of Immigrants from Burma/Myanmar and percentage of households with 3 or more vehicles available in the United States with a correlation coefficient (R) of 0.112 and weighted average of 18.8%. On average, for every 1% (one percent) increase in Immigrants from Burma/Myanmar within a typical geography, there is an increase of 0.19% in percentage of households with 3 or more vehicles available.
It is essential to understand that the correlation between the percentage of Immigrants from Burma/Myanmar and percentage of households with 3 or more vehicles available does not imply a direct cause-and-effect relationship. It remains uncertain whether the presence of Immigrants from Burma/Myanmar influences an upward or downward trend in the level of percentage of households with 3 or more vehicles available within an area, or if Immigrants from Burma/Myanmar simply ended up residing in those areas with higher or lower levels of percentage of households with 3 or more vehicles available due to other factors.
Demographics Similar to Immigrants from Burma/Myanmar by 3 or more Vehicles in Household
In terms of 3 or more vehicles in household, the demographic groups most similar to Immigrants from Burma/Myanmar are Immigrants from Chile (18.8%, a difference of 0.010%), Immigrants from Egypt (18.8%, a difference of 0.010%), Immigrants from Eastern Asia (18.8%, a difference of 0.090%), Bulgarian (18.8%, a difference of 0.090%), and Russian (18.8%, a difference of 0.10%).
| Demographics | Rating | Rank | 3 or more Vehicles in Household |
| Arabs | 17.7 /100 | #201 | Poor 18.9% |
| Immigrants from Austria | 15.4 /100 | #202 | Poor 18.9% |
| Tohono O'odham | 14.8 /100 | #203 | Poor 18.9% |
| Immigrants from Romania | 14.6 /100 | #204 | Poor 18.9% |
| Russians | 14.2 /100 | #205 | Poor 18.8% |
| Immigrants from Eastern Asia | 14.1 /100 | #206 | Poor 18.8% |
| Immigrants from Chile | 13.6 /100 | #207 | Poor 18.8% |
| Immigrants from Burma/Myanmar | 13.6 /100 | #208 | Poor 18.8% |
| Immigrants from Egypt | 13.5 /100 | #209 | Poor 18.8% |
| Bulgarians | 13.1 /100 | #210 | Poor 18.8% |
| Immigrants from Kenya | 12.4 /100 | #211 | Poor 18.8% |
| Panamanians | 11.6 /100 | #212 | Poor 18.8% |
| Immigrants from Cuba | 11.6 /100 | #213 | Poor 18.8% |
| Immigrants from Sierra Leone | 10.8 /100 | #214 | Poor 18.7% |
| Eastern Europeans | 10.6 /100 | #215 | Poor 18.7% |
Immigrants from Burma/Myanmar 3 or more Vehicles in Household Correlation Summary
| Measurement | Immigrants from Burma/Myanmar Data | 3 or more Vehicles in Household Data |
| Minimum | 0.038% | 4.1% |
| Maximum | 17.4% | 33.6% |
| Range | 17.4% | 29.5% |
| Mean | 3.5% | 19.0% |
| Median | 2.6% | 19.3% |
| Interquartile 25% (IQ1) | 1.3% | 15.9% |
| Interquartile 75% (IQ3) | 4.3% | 21.7% |
| Interquartile Range (IQR) | 3.0% | 5.8% |
| Standard Deviation (Sample) | 3.3% | 5.6% |
| Standard Deviation (Population) | 3.2% | 5.5% |
Correlation Details
| Immigrants from Burma/Myanmar Percentile | Sample Size | 3 or more Vehicles in Household |
[ 0.0% - 0.5% ] 0.038% | 109,795,283 | 17.6% |
[ 0.0% - 0.5% ] 0.12% | 28,009,549 | 20.2% |
[ 0.0% - 0.5% ] 0.22% | 10,625,437 | 20.2% |
[ 0.0% - 0.5% ] 0.30% | 4,417,125 | 20.5% |
[ 0.0% - 0.5% ] 0.38% | 3,395,169 | 17.6% |
[ 0.0% - 0.5% ] 0.48% | 2,409,188 | 18.9% |
[ 0.5% - 1.0% ] 0.58% | 2,459,066 | 19.4% |
[ 0.5% - 1.0% ] 0.65% | 1,513,851 | 21.9% |
[ 0.5% - 1.0% ] 0.73% | 1,356,368 | 21.6% |
[ 0.5% - 1.0% ] 0.84% | 1,123,551 | 16.5% |
[ 0.5% - 1.0% ] 0.92% | 636,007 | 16.0% |
[ 1.0% - 1.5% ] 1.00% | 592,676 | 19.5% |
[ 1.0% - 1.5% ] 1.08% | 1,357,765 | 17.0% |
[ 1.0% - 1.5% ] 1.17% | 419,756 | 19.7% |
[ 1.0% - 1.5% ] 1.26% | 438,016 | 22.6% |
[ 1.0% - 1.5% ] 1.34% | 223,860 | 21.5% |
[ 1.0% - 1.5% ] 1.43% | 406,228 | 19.4% |
[ 1.5% - 2.0% ] 1.51% | 310,391 | 16.5% |
[ 1.5% - 2.0% ] 1.63% | 392,187 | 20.0% |
[ 1.5% - 2.0% ] 1.69% | 182,155 | 23.6% |
[ 1.5% - 2.0% ] 1.79% | 185,148 | 19.3% |
[ 1.5% - 2.0% ] 1.86% | 432,147 | 15.1% |
[ 1.5% - 2.0% ] 1.97% | 19,626 | 21.7% |
[ 2.0% - 2.5% ] 2.06% | 256,522 | 21.1% |
[ 2.0% - 2.5% ] 2.13% | 35,419 | 12.6% |
[ 2.0% - 2.5% ] 2.22% | 55,094 | 30.3% |
[ 2.0% - 2.5% ] 2.29% | 12,866 | 21.3% |
[ 2.0% - 2.5% ] 2.37% | 51,767 | 14.0% |
[ 2.0% - 2.5% ] 2.48% | 133,569 | 13.9% |
[ 2.5% - 3.0% ] 2.55% | 126,252 | 20.0% |
[ 2.5% - 3.0% ] 2.63% | 48,939 | 16.8% |
[ 2.5% - 3.0% ] 2.74% | 85,513 | 25.7% |
[ 2.5% - 3.0% ] 2.81% | 33,467 | 21.8% |
[ 3.0% - 3.5% ] 3.03% | 24,684 | 15.8% |
[ 3.0% - 3.5% ] 3.10% | 94,089 | 11.8% |
[ 3.0% - 3.5% ] 3.19% | 24,971 | 17.6% |
[ 3.0% - 3.5% ] 3.27% | 33,912 | 16.7% |
[ 3.0% - 3.5% ] 3.34% | 15,556 | 17.4% |
[ 3.0% - 3.5% ] 3.47% | 58,574 | 18.7% |
[ 3.5% - 4.0% ] 3.53% | 12,010 | 23.4% |
[ 3.5% - 4.0% ] 3.70% | 23,980 | 6.3% |
[ 3.5% - 4.0% ] 3.81% | 57,662 | 19.5% |
[ 3.5% - 4.0% ] 3.88% | 15,899 | 27.6% |
[ 4.0% - 4.5% ] 4.12% | 25,699 | 4.1% |
[ 4.0% - 4.5% ] 4.21% | 23,879 | 27.1% |
[ 4.0% - 4.5% ] 4.31% | 81,015 | 12.0% |
[ 4.0% - 4.5% ] 4.48% | 2,029 | 26.3% |
[ 4.5% - 5.0% ] 4.69% | 14,553 | 14.1% |
[ 4.5% - 5.0% ] 4.78% | 2,219 | 18.9% |
[ 5.0% - 5.5% ] 5.11% | 5,268 | 8.1% |
[ 5.0% - 5.5% ] 5.33% | 37,834 | 14.0% |
[ 6.0% - 6.5% ] 6.45% | 19,501 | 19.1% |
[ 6.5% - 7.0% ] 6.88% | 19,613 | 15.0% |
[ 7.5% - 8.0% ] 7.81% | 39,082 | 23.5% |
[ 7.5% - 8.0% ] 7.92% | 56,794 | 14.9% |
[ 8.5% - 9.0% ] 8.70% | 1,035 | 28.1% |
[ 9.5% - 10.0% ] 9.95% | 382 | 31.3% |
[ 11.0% - 11.5% ] 11.17% | 403 | 33.6% |
[ 12.0% - 12.5% ] 12.20% | 738 | 12.8% |
[ 17.0% - 17.5% ] 17.43% | 2,088 | 19.2% |