Yaqui 3 or more Vehicles in Household

COMPARE

Yaqui
Race
Ancestry
AfghanAfricanAlaska NativeAlaskan AthabascanAlbanianAleutAlsatianAmericanApacheArabArapahoArgentineanArmenianAssyrian/Chaldean/SyriacAustralianAustrianBahamianBangladeshiBarbadianBasqueBelgianBelizeanBermudanBhutaneseBlackfeetBolivianBrazilianBritishBritish West IndianBulgarianBurmeseCajunCambodianCanadianCape VerdeanCarpatho RusynCelticCentral AmericanCentral American IndianCherokeeCheyenneChickasawChileanChineseChippewaChoctawColombianColvilleComancheCosta RicanCreeCreekCroatianCrowCubanCypriotCzechCzechoslovakianDanishDelawareDominicanDutchDutch West IndianEastern EuropeanEcuadorianEgyptianEnglishEstonianEthiopianEuropeanFijianFilipinoFinnishFrenchFrench American IndianFrench CanadianGermanGerman RussianGhanaianGreekGuamanian/ChamorroGuatemalanGuyaneseHaitianHmongHonduranHopiHoumaHungarianIcelanderIndian (Asian)IndonesianInupiatIranianIraqiIrishIroquoisIsraeliItalianJamaicanJapaneseJordanianKenyanKiowaKoreanLaotianLatvianLebaneseLiberianLithuanianLumbeeLuxembourgerMacedonianMalaysianMalteseMarshalleseMenomineeMexicanMexican American IndianMongolianMoroccanNative HawaiianNavajoNepaleseNew ZealanderNicaraguanNigerianNorthern EuropeanNorwegianOkinawanOsageOttawaPaiutePakistaniPalestinianPanamanianParaguayanPennsylvania GermanPeruvianPimaPolishPortuguesePotawatomiPuebloPuerto RicanPuget Sound SalishRomanianRussianSalvadoranSamoanScandinavianScotch-IrishScottishSeminoleSenegaleseSerbianShoshoneSierra LeoneanSiouxSlavicSlovakSloveneSomaliSouth AfricanSouth AmericanSouth American IndianSoviet UnionSpaniardSpanishSpanish AmericanSpanish American IndianSri LankanSubsaharan AfricanSudaneseSwedishSwissSyrianTaiwaneseThaiTlingit-HaidaTohono O'OdhamTonganTrinidadian and TobagonianTsimshianTurkishU.S. Virgin IslanderUgandanUkrainianUruguayanUteVenezuelanVietnameseWelshWest IndianYakamaYaquiYugoslavianYumanYup'ikZimbabwean
Immigration
NonimmigrantsImmigrantsAfghanistanAfricaAlbaniaArgentinaArmeniaAsiaAustraliaAustriaBahamasBangladeshBarbadosBelarusBelgiumBelizeBoliviaBosnia and HerzegovinaBrazilBulgariaBurma/MyanmarCabo VerdeCambodiaCameroonCanadaCaribbeanCentral AmericaChileChinaColombiaCongoCosta RicaCroatiaCubaCzechoslovakiaDenmarkDominicaDominican RepublicEastern AfricaEastern AsiaEastern EuropeEcuadorEgyptEl SalvadorEnglandEritreaEthiopiaEuropeFijiFranceGermanyGhanaGreeceGrenadaGuatemalaGuyanaHaitiHondurasHong KongHungaryIndiaIndonesiaIranIraqIrelandIsraelItalyJamaicaJapanJordanKazakhstanKenyaKoreaKuwaitLaosLatin AmericaLatviaLebanonLiberiaLithuaniaMalaysiaMexicoMicronesiaMiddle AfricaMoldovaMoroccoNepalNetherlandsNicaraguaNigeriaNorth AmericaNorth MacedoniaNorthern AfricaNorthern EuropeNorwayOceaniaPakistanPanamaPeruPhilippinesPolandPortugalRomaniaRussiaSaudi ArabiaScotlandSenegalSerbiaSierra LeoneSingaporeSomaliaSouth AfricaSouth AmericaSouth Central AsiaSouth Eastern AsiaSouthern EuropeSpainSri LankaSt. Vincent and the GrenadinesSudanSwedenSwitzerlandSyriaTaiwanThailandTrinidad and TobagoTurkeyUgandaUkraineUruguayUzbekistanVenezuelaVietnamWest IndiesWestern AfricaWestern AsiaWestern EuropeYemenZaireZimbabweAzores
Select to Compare
Race
Ancestry
AfghanAfricanAlaska NativeAlaskan AthabascanAlbanianAleutAlsatianAmericanApacheArabArapahoArgentineanArmenianAssyrian/Chaldean/SyriacAustralianAustrianBahamianBangladeshiBarbadianBasqueBelgianBelizeanBermudanBhutaneseBlackfeetBolivianBrazilianBritishBritish West IndianBulgarianBurmeseCajunCambodianCanadianCape VerdeanCarpatho RusynCelticCentral AmericanCentral American IndianCherokeeCheyenneChickasawChileanChineseChippewaChoctawColombianColvilleComancheCosta RicanCreeCreekCroatianCrowCubanCypriotCzechCzechoslovakianDanishDelawareDominicanDutchDutch West IndianEastern EuropeanEcuadorianEgyptianEnglishEstonianEthiopianEuropeanFijianFilipinoFinnishFrenchFrench American IndianFrench CanadianGermanGerman RussianGhanaianGreekGuamanian/ChamorroGuatemalanGuyaneseHaitianHmongHonduranHopiHoumaHungarianIcelanderIndian (Asian)IndonesianInupiatIranianIraqiIrishIroquoisIsraeliItalianJamaicanJapaneseJordanianKenyanKiowaKoreanLaotianLatvianLebaneseLiberianLithuanianLumbeeLuxembourgerMacedonianMalaysianMalteseMarshalleseMenomineeMexicanMexican American IndianMongolianMoroccanNative HawaiianNavajoNepaleseNew ZealanderNicaraguanNigerianNorthern EuropeanNorwegianOkinawanOsageOttawaPaiutePakistaniPalestinianPanamanianParaguayanPennsylvania GermanPeruvianPimaPolishPortuguesePotawatomiPuebloPuerto RicanPuget Sound SalishRomanianRussianSalvadoranSamoanScandinavianScotch-IrishScottishSeminoleSenegaleseSerbianShoshoneSierra LeoneanSiouxSlavicSlovakSloveneSomaliSouth AfricanSouth AmericanSouth American IndianSoviet UnionSpaniardSpanishSpanish AmericanSpanish American IndianSri LankanSubsaharan AfricanSudaneseSwedishSwissSyrianTaiwaneseThaiTlingit-HaidaTohono O'OdhamTonganTrinidadian and TobagonianTsimshianTurkishU.S. Virgin IslanderUgandanUkrainianUruguayanUteVenezuelanVietnameseWelshWest IndianYakamaYugoslavianYumanYup'ikZimbabwean
Immigration
NonimmigrantsImmigrantsAfghanistanAfricaAlbaniaArgentinaArmeniaAsiaAustraliaAustriaBahamasBangladeshBarbadosBelarusBelgiumBelizeBoliviaBosnia and HerzegovinaBrazilBulgariaBurma/MyanmarCabo VerdeCambodiaCameroonCanadaCaribbeanCentral AmericaChileChinaColombiaCongoCosta RicaCroatiaCubaCzechoslovakiaDenmarkDominicaDominican RepublicEastern AfricaEastern AsiaEastern EuropeEcuadorEgyptEl SalvadorEnglandEritreaEthiopiaEuropeFijiFranceGermanyGhanaGreeceGrenadaGuatemalaGuyanaHaitiHondurasHong KongHungaryIndiaIndonesiaIranIraqIrelandIsraelItalyJamaicaJapanJordanKazakhstanKenyaKoreaKuwaitLaosLatin AmericaLatviaLebanonLiberiaLithuaniaMalaysiaMexicoMicronesiaMiddle AfricaMoldovaMoroccoNepalNetherlandsNicaraguaNigeriaNorth AmericaNorth MacedoniaNorthern AfricaNorthern EuropeNorwayOceaniaPakistanPanamaPeruPhilippinesPolandPortugalRomaniaRussiaSaudi ArabiaScotlandSenegalSerbiaSierra LeoneSingaporeSomaliaSouth AfricaSouth AmericaSouth Central AsiaSouth Eastern AsiaSouthern EuropeSpainSri LankaSt. Vincent and the GrenadinesSudanSwedenSwitzerlandSyriaTaiwanThailandTrinidad and TobagoTurkeyUgandaUkraineUruguayUzbekistanVenezuelaVietnamWest IndiesWestern AfricaWestern AsiaWestern EuropeYemenZaireZimbabweAzores
3 or more Vehicles in Household
Income
Poverty
Unemployment
Labor Participation
Family Structure
Vehicle Availability
Education Level
Disability

Yaqui 3 or more Vehicles in Household
Exceptional

22.9%
3+ VEHICLES AVAILABLE
100.0/ 100
METRIC RATING
39th/ 347
METRIC RANK

Yaqui 3 or more Vehicles in Household Correlation Chart

The statistical analysis conducted on geographies consisting of 107,706,857 people shows a poor positive correlation between the proportion of Yaqui and percentage of households with 3 or more vehicles available in the United States with a correlation coefficient (R) of 0.136 and weighted average of 22.9%. On average, for every 1% (one percent) increase in Yaqui within a typical geography, there is an increase of 0.25% in percentage of households with 3 or more vehicles available.
Yaqui 3 or more Vehicles in Household
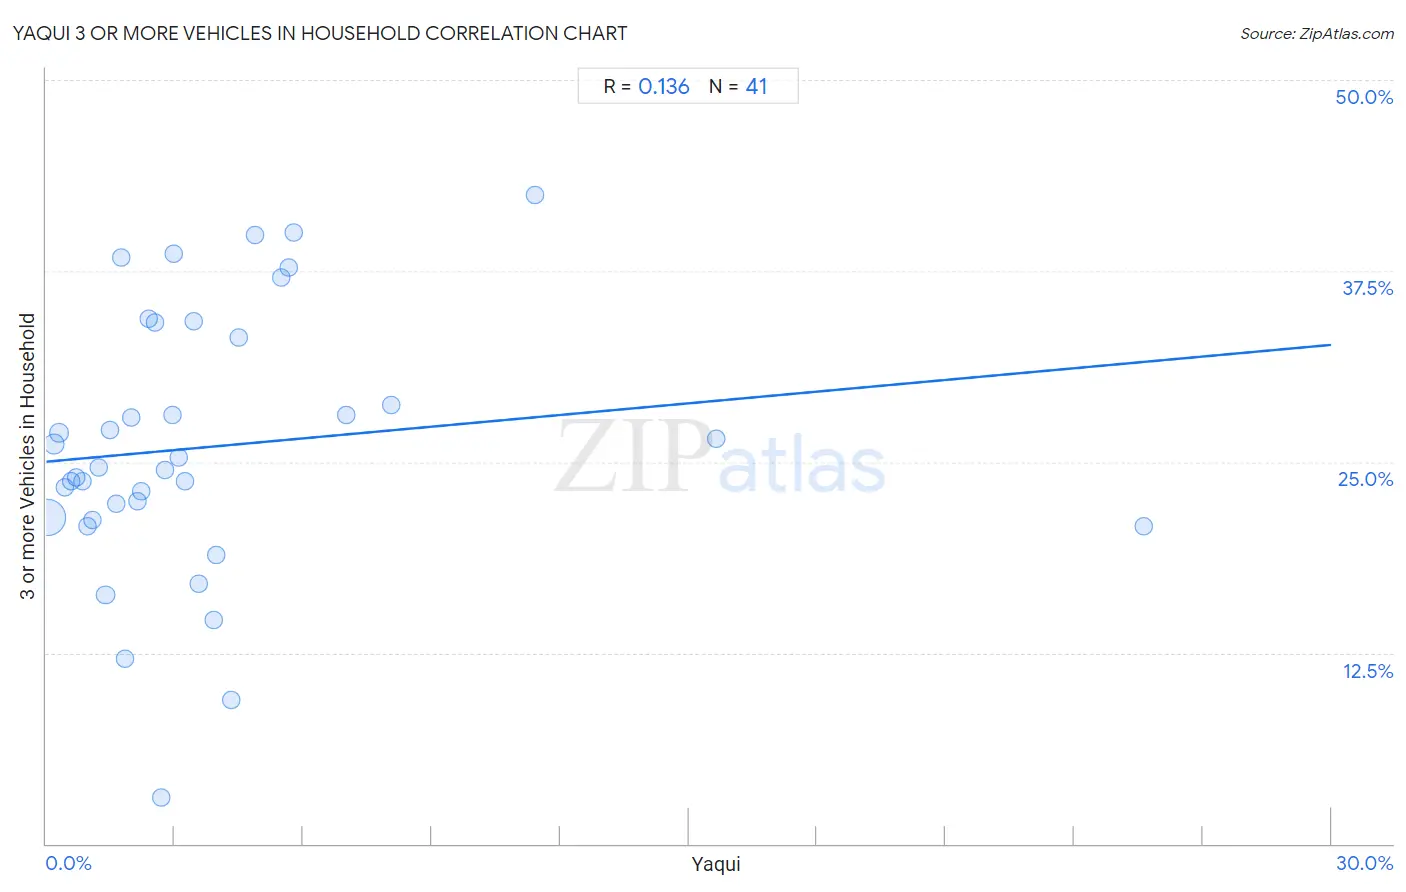
It is essential to understand that the correlation between the percentage of Yaqui and percentage of households with 3 or more vehicles available does not imply a direct cause-and-effect relationship. It remains uncertain whether the presence of Yaqui influences an upward or downward trend in the level of percentage of households with 3 or more vehicles available within an area, or if Yaqui simply ended up residing in those areas with higher or lower levels of percentage of households with 3 or more vehicles available due to other factors.

Demographics Similar to Yaqui by 3 or more Vehicles in Household

In terms of 3 or more vehicles in household, the demographic groups most similar to Yaqui are Dutch (22.9%, a difference of 0.10%), European (22.9%, a difference of 0.25%), Swedish (23.0%, a difference of 0.32%), Cherokee (23.0%, a difference of 0.35%), and Choctaw (23.0%, a difference of 0.39%).
DemographicsRating | Rank3 or more Vehicles in Household
Pueblo
100.0
/100
|
#32
Exceptional
23.0%
Spanish Americans
100.0
/100
|
#33
Exceptional
23.0%
Swiss
100.0
/100
|
#34
Exceptional
23.0%
Choctaw
100.0
/100
|
#35
Exceptional
23.0%
Cherokee
100.0
/100
|
#36
Exceptional
23.0%
Swedes
100.0
/100
|
#37
Exceptional
23.0%
Dutch
100.0
/100
|
#38
Exceptional
22.9%
Yaqui
100.0
/100
|
#39
Exceptional
22.9%
Europeans
100.0
/100
|
#40
Exceptional
22.9%
Germans
100.0
/100
|
#41
Exceptional
22.7%
Natives/Alaskans
100.0
/100
|
#42
Exceptional
22.7%
Osage
100.0
/100
|
#43
Exceptional
22.7%
Cheyenne
100.0
/100
|
#44
Exceptional
22.7%
Ute
100.0
/100
|
#45
Exceptional
22.7%
Americans
100.0
/100
|
#46
Exceptional
22.6%

Yaqui 3 or more Vehicles in Household Correlation Summary

MeasurementYaqui Data3 or more Vehicles in Household Data
Minimum0.033%3.0%
Maximum25.6%42.5%
Range25.6%39.5%
Mean3.8%26.0%
Median2.7%24.6%
Interquartile 25% (IQ1)1.3%21.3%
Interquartile 75% (IQ3)4.4%33.6%
Interquartile Range (IQR)3.1%12.3%
Standard Deviation (Sample)4.6%8.7%
Standard Deviation (Population)4.6%8.6%

Correlation Details

Yaqui PercentileSample Size3 or more Vehicles in Household
[
0.0%
-
0.5%
]
0.033%
90,905,80321.4%
[
0.0%
-
0.5%
]
0.18%
9,590,39126.2%
[
0.0%
-
0.5%
]
0.30%
2,976,47926.9%
[
0.0%
-
0.5%
]
0.44%
1,587,38923.4%
[
0.5%
-
1.0%
]
0.58%
437,75823.7%
[
0.5%
-
1.0%
]
0.69%
356,82623.9%
[
0.5%
-
1.0%
]
0.83%
303,43223.7%
[
0.5%
-
1.0%
]
0.96%
224,71420.8%
[
1.0%
-
1.5%
]
1.08%
79,63221.2%
[
1.0%
-
1.5%
]
1.22%
162,23624.6%
[
1.0%
-
1.5%
]
1.39%
585,53516.3%
[
1.0%
-
1.5%
]
1.48%
25,70227.1%
[
1.5%
-
2.0%
]
1.65%
6,06622.3%
[
1.5%
-
2.0%
]
1.76%
16,93738.4%
[
1.5%
-
2.0%
]
1.83%
61,13912.1%
[
1.5%
-
2.0%
]
1.97%
8,06827.9%
[
2.0%
-
2.5%
]
2.13%
23,88522.4%
[
2.0%
-
2.5%
]
2.21%
96,19123.1%
[
2.0%
-
2.5%
]
2.41%
36,65034.3%
[
2.5%
-
3.0%
]
2.55%
78434.1%
[
2.5%
-
3.0%
]
2.68%
1,4543.0%
[
2.5%
-
3.0%
]
2.78%
14424.5%
[
2.5%
-
3.0%
]
2.94%
7,35928.0%
[
2.5%
-
3.0%
]
2.96%
2,93638.7%
[
3.0%
-
3.5%
]
3.08%
6,26025.3%
[
3.0%
-
3.5%
]
3.23%
36,82823.7%
[
3.0%
-
3.5%
]
3.43%
37934.2%
[
3.5%
-
4.0%
]
3.55%
45,88117.0%
[
3.5%
-
4.0%
]
3.90%
15,90914.7%
[
3.5%
-
4.0%
]
3.98%
57,89718.9%
[
4.0%
-
4.5%
]
4.31%
5,1259.4%
[
4.0%
-
4.5%
]
4.50%
1,84533.1%
[
4.5%
-
5.0%
]
4.87%
1,06739.8%
[
5.0%
-
5.5%
]
5.49%
5,57437.1%
[
5.5%
-
6.0%
]
5.65%
4,33737.7%
[
5.5%
-
6.0%
]
5.77%
5240.0%
[
7.0%
-
7.5%
]
7.00%
45728.0%
[
8.0%
-
8.5%
]
8.06%
1,26628.7%
[
11.0%
-
11.5%
]
11.40%
11442.5%
[
15.5%
-
16.0%
]
15.65%
21,02126.5%
[
25.5%
-
26.0%
]
25.62%
5,33520.8%