Jordanian 3 or more Vehicles in Household

COMPARE

Jordanian
Race
Ancestry
AfghanAfricanAlaska NativeAlaskan AthabascanAlbanianAleutAlsatianAmericanApacheArabArapahoArgentineanArmenianAssyrian/Chaldean/SyriacAustralianAustrianBahamianBangladeshiBarbadianBasqueBelgianBelizeanBermudanBhutaneseBlackfeetBolivianBrazilianBritishBritish West IndianBulgarianBurmeseCajunCambodianCanadianCape VerdeanCarpatho RusynCelticCentral AmericanCentral American IndianCherokeeCheyenneChickasawChileanChineseChippewaChoctawColombianColvilleComancheCosta RicanCreeCreekCroatianCrowCubanCypriotCzechCzechoslovakianDanishDelawareDominicanDutchDutch West IndianEastern EuropeanEcuadorianEgyptianEnglishEstonianEthiopianEuropeanFijianFilipinoFinnishFrenchFrench American IndianFrench CanadianGermanGerman RussianGhanaianGreekGuamanian/ChamorroGuatemalanGuyaneseHaitianHmongHonduranHopiHoumaHungarianIcelanderIndian (Asian)IndonesianInupiatIranianIraqiIrishIroquoisIsraeliItalianJamaicanJapaneseJordanianKenyanKiowaKoreanLaotianLatvianLebaneseLiberianLithuanianLumbeeLuxembourgerMacedonianMalaysianMalteseMarshalleseMenomineeMexicanMexican American IndianMongolianMoroccanNative HawaiianNavajoNepaleseNew ZealanderNicaraguanNigerianNorthern EuropeanNorwegianOkinawanOsageOttawaPaiutePakistaniPalestinianPanamanianParaguayanPennsylvania GermanPeruvianPimaPolishPortuguesePotawatomiPuebloPuerto RicanPuget Sound SalishRomanianRussianSalvadoranSamoanScandinavianScotch-IrishScottishSeminoleSenegaleseSerbianShoshoneSierra LeoneanSiouxSlavicSlovakSloveneSomaliSouth AfricanSouth AmericanSouth American IndianSoviet UnionSpaniardSpanishSpanish AmericanSpanish American IndianSri LankanSubsaharan AfricanSudaneseSwedishSwissSyrianTaiwaneseThaiTlingit-HaidaTohono O'OdhamTonganTrinidadian and TobagonianTsimshianTurkishU.S. Virgin IslanderUgandanUkrainianUruguayanUteVenezuelanVietnameseWelshWest IndianYakamaYaquiYugoslavianYumanYup'ikZimbabwean
Immigration
NonimmigrantsImmigrantsAfghanistanAfricaAlbaniaArgentinaArmeniaAsiaAustraliaAustriaBahamasBangladeshBarbadosBelarusBelgiumBelizeBoliviaBosnia and HerzegovinaBrazilBulgariaBurma/MyanmarCabo VerdeCambodiaCameroonCanadaCaribbeanCentral AmericaChileChinaColombiaCongoCosta RicaCroatiaCubaCzechoslovakiaDenmarkDominicaDominican RepublicEastern AfricaEastern AsiaEastern EuropeEcuadorEgyptEl SalvadorEnglandEritreaEthiopiaEuropeFijiFranceGermanyGhanaGreeceGrenadaGuatemalaGuyanaHaitiHondurasHong KongHungaryIndiaIndonesiaIranIraqIrelandIsraelItalyJamaicaJapanJordanKazakhstanKenyaKoreaKuwaitLaosLatin AmericaLatviaLebanonLiberiaLithuaniaMalaysiaMexicoMicronesiaMiddle AfricaMoldovaMoroccoNepalNetherlandsNicaraguaNigeriaNorth AmericaNorth MacedoniaNorthern AfricaNorthern EuropeNorwayOceaniaPakistanPanamaPeruPhilippinesPolandPortugalRomaniaRussiaSaudi ArabiaScotlandSenegalSerbiaSierra LeoneSingaporeSomaliaSouth AfricaSouth AmericaSouth Central AsiaSouth Eastern AsiaSouthern EuropeSpainSri LankaSt. Vincent and the GrenadinesSudanSwedenSwitzerlandSyriaTaiwanThailandTrinidad and TobagoTurkeyUgandaUkraineUruguayUzbekistanVenezuelaVietnamWest IndiesWestern AfricaWestern AsiaWestern EuropeYemenZaireZimbabweAzores
Select to Compare
Race
Ancestry
AfghanAfricanAlaska NativeAlaskan AthabascanAlbanianAleutAlsatianAmericanApacheArabArapahoArgentineanArmenianAssyrian/Chaldean/SyriacAustralianAustrianBahamianBangladeshiBarbadianBasqueBelgianBelizeanBermudanBhutaneseBlackfeetBolivianBrazilianBritishBritish West IndianBulgarianBurmeseCajunCambodianCanadianCape VerdeanCarpatho RusynCelticCentral AmericanCentral American IndianCherokeeCheyenneChickasawChileanChineseChippewaChoctawColombianColvilleComancheCosta RicanCreeCreekCroatianCrowCubanCypriotCzechCzechoslovakianDanishDelawareDominicanDutchDutch West IndianEastern EuropeanEcuadorianEgyptianEnglishEstonianEthiopianEuropeanFijianFilipinoFinnishFrenchFrench American IndianFrench CanadianGermanGerman RussianGhanaianGreekGuamanian/ChamorroGuatemalanGuyaneseHaitianHmongHonduranHopiHoumaHungarianIcelanderIndian (Asian)IndonesianInupiatIranianIraqiIrishIroquoisIsraeliItalianJamaicanJapaneseKenyanKiowaKoreanLaotianLatvianLebaneseLiberianLithuanianLumbeeLuxembourgerMacedonianMalaysianMalteseMarshalleseMenomineeMexicanMexican American IndianMongolianMoroccanNative HawaiianNavajoNepaleseNew ZealanderNicaraguanNigerianNorthern EuropeanNorwegianOkinawanOsageOttawaPaiutePakistaniPalestinianPanamanianParaguayanPennsylvania GermanPeruvianPimaPolishPortuguesePotawatomiPuebloPuerto RicanPuget Sound SalishRomanianRussianSalvadoranSamoanScandinavianScotch-IrishScottishSeminoleSenegaleseSerbianShoshoneSierra LeoneanSiouxSlavicSlovakSloveneSomaliSouth AfricanSouth AmericanSouth American IndianSoviet UnionSpaniardSpanishSpanish AmericanSpanish American IndianSri LankanSubsaharan AfricanSudaneseSwedishSwissSyrianTaiwaneseThaiTlingit-HaidaTohono O'OdhamTonganTrinidadian and TobagonianTsimshianTurkishU.S. Virgin IslanderUgandanUkrainianUruguayanUteVenezuelanVietnameseWelshWest IndianYakamaYaquiYugoslavianYumanYup'ikZimbabwean
Immigration
NonimmigrantsImmigrantsAfghanistanAfricaAlbaniaArgentinaArmeniaAsiaAustraliaAustriaBahamasBangladeshBarbadosBelarusBelgiumBelizeBoliviaBosnia and HerzegovinaBrazilBulgariaBurma/MyanmarCabo VerdeCambodiaCameroonCanadaCaribbeanCentral AmericaChileChinaColombiaCongoCosta RicaCroatiaCubaCzechoslovakiaDenmarkDominicaDominican RepublicEastern AfricaEastern AsiaEastern EuropeEcuadorEgyptEl SalvadorEnglandEritreaEthiopiaEuropeFijiFranceGermanyGhanaGreeceGrenadaGuatemalaGuyanaHaitiHondurasHong KongHungaryIndiaIndonesiaIranIraqIrelandIsraelItalyJamaicaJapanJordanKazakhstanKenyaKoreaKuwaitLaosLatin AmericaLatviaLebanonLiberiaLithuaniaMalaysiaMexicoMicronesiaMiddle AfricaMoldovaMoroccoNepalNetherlandsNicaraguaNigeriaNorth AmericaNorth MacedoniaNorthern AfricaNorthern EuropeNorwayOceaniaPakistanPanamaPeruPhilippinesPolandPortugalRomaniaRussiaSaudi ArabiaScotlandSenegalSerbiaSierra LeoneSingaporeSomaliaSouth AfricaSouth AmericaSouth Central AsiaSouth Eastern AsiaSouthern EuropeSpainSri LankaSt. Vincent and the GrenadinesSudanSwedenSwitzerlandSyriaTaiwanThailandTrinidad and TobagoTurkeyUgandaUkraineUruguayUzbekistanVenezuelaVietnamWest IndiesWestern AfricaWestern AsiaWestern EuropeYemenZaireZimbabweAzores
3 or more Vehicles in Household
Income
Poverty
Unemployment
Labor Participation
Family Structure
Vehicle Availability
Education Level
Disability

Jordanian 3 or more Vehicles in Household
Excellent

20.1%
3+ VEHICLES AVAILABLE
84.4/ 100
METRIC RATING
142nd/ 347
METRIC RANK

Jordanian 3 or more Vehicles in Household Correlation Chart

The statistical analysis conducted on geographies consisting of 166,358,031 people shows a significant positive correlation between the proportion of Jordanians and percentage of households with 3 or more vehicles available in the United States with a correlation coefficient (R) of 0.617 and weighted average of 20.1%. On average, for every 1% (one percent) increase in Jordanians within a typical geography, there is an increase of 2.1% in percentage of households with 3 or more vehicles available.
Jordanian 3 or more Vehicles in Household
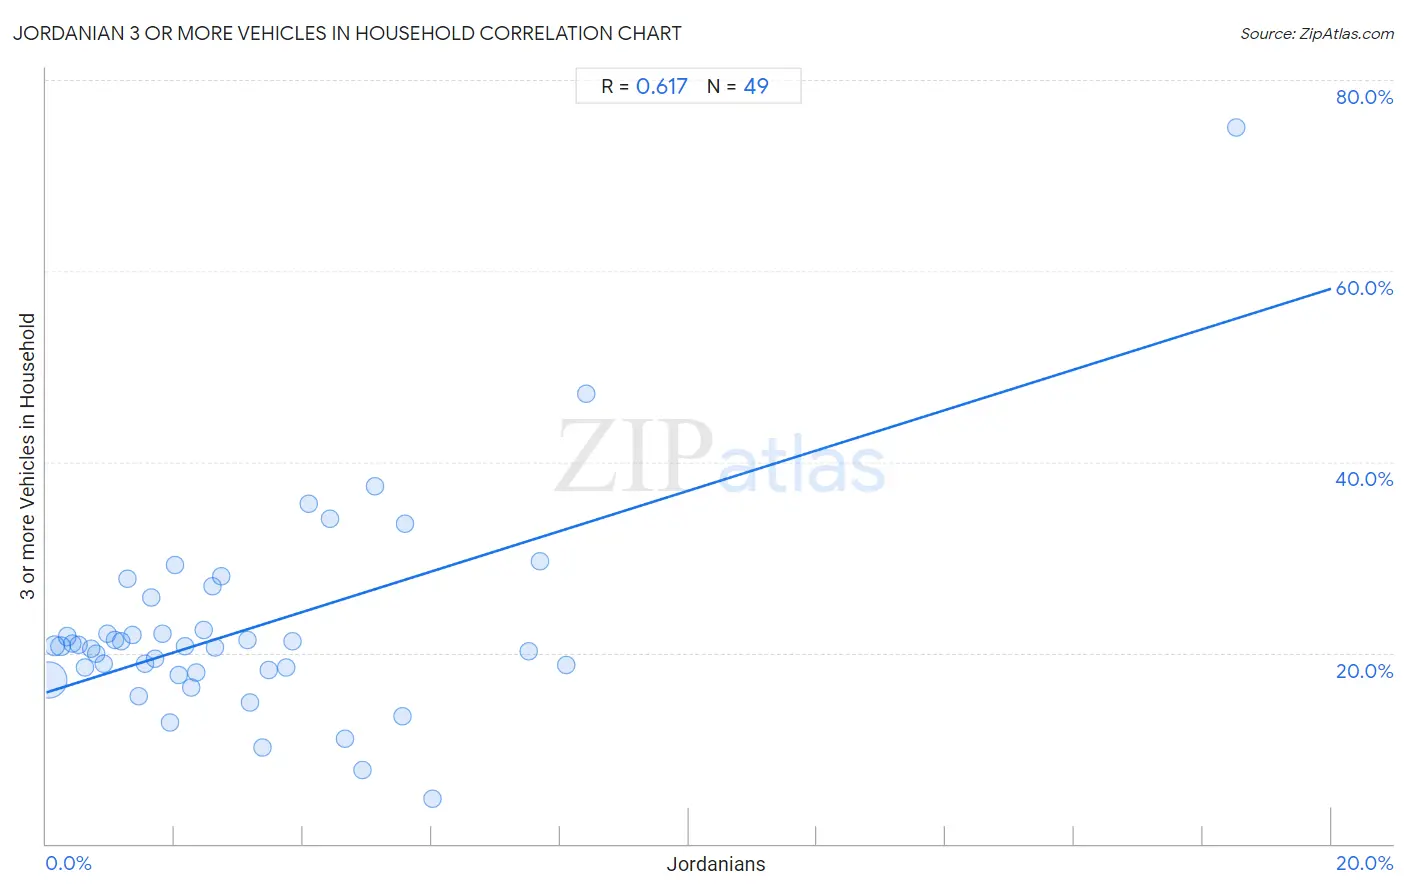
It is essential to understand that the correlation between the percentage of Jordanians and percentage of households with 3 or more vehicles available does not imply a direct cause-and-effect relationship. It remains uncertain whether the presence of Jordanians influences an upward or downward trend in the level of percentage of households with 3 or more vehicles available within an area, or if Jordanians simply ended up residing in those areas with higher or lower levels of percentage of households with 3 or more vehicles available due to other factors.

Demographics Similar to Jordanians by 3 or more Vehicles in Household

In terms of 3 or more vehicles in household, the demographic groups most similar to Jordanians are Lithuanian (20.1%, a difference of 0.0%), Ottawa (20.1%, a difference of 0.060%), Iranian (20.1%, a difference of 0.060%), Palestinian (20.1%, a difference of 0.070%), and Australian (20.1%, a difference of 0.11%).
DemographicsRating | Rank3 or more Vehicles in Household
Immigrants from India
87.2
/100
|
#135
Excellent
20.2%
Immigrants from Nicaragua
87.1
/100
|
#136
Excellent
20.2%
Immigrants from Iraq
87.1
/100
|
#137
Excellent
20.2%
Aleuts
86.3
/100
|
#138
Excellent
20.2%
Slovenes
85.5
/100
|
#139
Excellent
20.2%
French American Indians
85.3
/100
|
#140
Excellent
20.1%
Ottawa
84.9
/100
|
#141
Excellent
20.1%
Jordanians
84.4
/100
|
#142
Excellent
20.1%
Lithuanians
84.4
/100
|
#143
Excellent
20.1%
Iranians
84.0
/100
|
#144
Excellent
20.1%
Palestinians
83.9
/100
|
#145
Excellent
20.1%
Australians
83.6
/100
|
#146
Excellent
20.1%
Slovaks
83.0
/100
|
#147
Excellent
20.1%
Guatemalans
82.6
/100
|
#148
Excellent
20.1%
Immigrants from Iran
80.9
/100
|
#149
Excellent
20.0%

Jordanian 3 or more Vehicles in Household Correlation Summary

MeasurementJordanian Data3 or more Vehicles in Household Data
Minimum0.034%4.7%
Maximum18.5%75.0%
Range18.5%70.3%
Mean3.1%22.4%
Median2.3%20.7%
Interquartile 25% (IQ1)1.1%18.0%
Interquartile 75% (IQ3)4.3%24.1%
Interquartile Range (IQR)3.1%6.0%
Standard Deviation (Sample)3.1%10.8%
Standard Deviation (Population)3.1%10.7%

Correlation Details

Jordanian PercentileSample Size3 or more Vehicles in Household
[
0.0%
-
0.5%
]
0.034%
122,903,34517.2%
[
0.0%
-
0.5%
]
0.13%
22,143,73220.7%
[
0.0%
-
0.5%
]
0.22%
8,457,23320.7%
[
0.0%
-
0.5%
]
0.32%
3,366,45121.7%
[
0.0%
-
0.5%
]
0.41%
2,328,54521.0%
[
0.5%
-
1.0%
]
0.51%
2,327,29020.8%
[
0.5%
-
1.0%
]
0.60%
861,64618.4%
[
0.5%
-
1.0%
]
0.69%
672,00320.4%
[
0.5%
-
1.0%
]
0.79%
663,27519.9%
[
0.5%
-
1.0%
]
0.89%
480,92818.8%
[
0.5%
-
1.0%
]
0.96%
434,65622.0%
[
1.0%
-
1.5%
]
1.06%
443,46121.3%
[
1.0%
-
1.5%
]
1.17%
82,25021.3%
[
1.0%
-
1.5%
]
1.26%
112,75527.7%
[
1.0%
-
1.5%
]
1.34%
154,05021.8%
[
1.0%
-
1.5%
]
1.43%
190,53715.5%
[
1.5%
-
2.0%
]
1.54%
119,42718.9%
[
1.5%
-
2.0%
]
1.63%
117,44425.8%
[
1.5%
-
2.0%
]
1.70%
22,76919.4%
[
1.5%
-
2.0%
]
1.81%
43,54122.0%
[
1.5%
-
2.0%
]
1.92%
39,86112.7%
[
2.0%
-
2.5%
]
2.01%
50,56129.2%
[
2.0%
-
2.5%
]
2.06%
11,18917.7%
[
2.0%
-
2.5%
]
2.16%
1,15520.7%
[
2.0%
-
2.5%
]
2.26%
31,25916.4%
[
2.0%
-
2.5%
]
2.33%
14,91517.9%
[
2.0%
-
2.5%
]
2.46%
55,02522.4%
[
2.5%
-
3.0%
]
2.59%
23,17327.0%
[
2.5%
-
3.0%
]
2.62%
38,14420.5%
[
2.5%
-
3.0%
]
2.71%
17,28028.1%
[
3.0%
-
3.5%
]
3.14%
3,31721.3%
[
3.0%
-
3.5%
]
3.16%
8,53514.7%
[
3.0%
-
3.5%
]
3.36%
2,02610.1%
[
3.0%
-
3.5%
]
3.46%
7,80418.1%
[
3.5%
-
4.0%
]
3.74%
11,08418.5%
[
3.5%
-
4.0%
]
3.82%
11,97721.2%
[
4.0%
-
4.5%
]
4.09%
38,01035.6%
[
4.0%
-
4.5%
]
4.42%
8,22034.0%
[
4.5%
-
5.0%
]
4.65%
20,56411.0%
[
4.5%
-
5.0%
]
4.92%
1,3817.7%
[
5.0%
-
5.5%
]
5.11%
1,46837.4%
[
5.5%
-
6.0%
]
5.55%
9,96013.3%
[
5.5%
-
6.0%
]
5.59%
6,49633.6%
[
6.0%
-
6.5%
]
6.01%
8,0244.7%
[
7.0%
-
7.5%
]
7.50%
40020.2%
[
7.5%
-
8.0%
]
7.69%
18229.6%
[
8.0%
-
8.5%
]
8.09%
37118.8%
[
8.0%
-
8.5%
]
8.41%
10,25847.1%
[
18.5%
-
19.0%
]
18.52%
5475.0%