Alsatian 3 or more Vehicles in Household
COMPARE
Alsatian
Select to Compare
3 or more Vehicles in Household
Alsatian 3 or more Vehicles in Household
18.0%
3+ VEHICLES AVAILABLE
1.5/ 100
METRIC RATING
251st/ 347
METRIC RANK
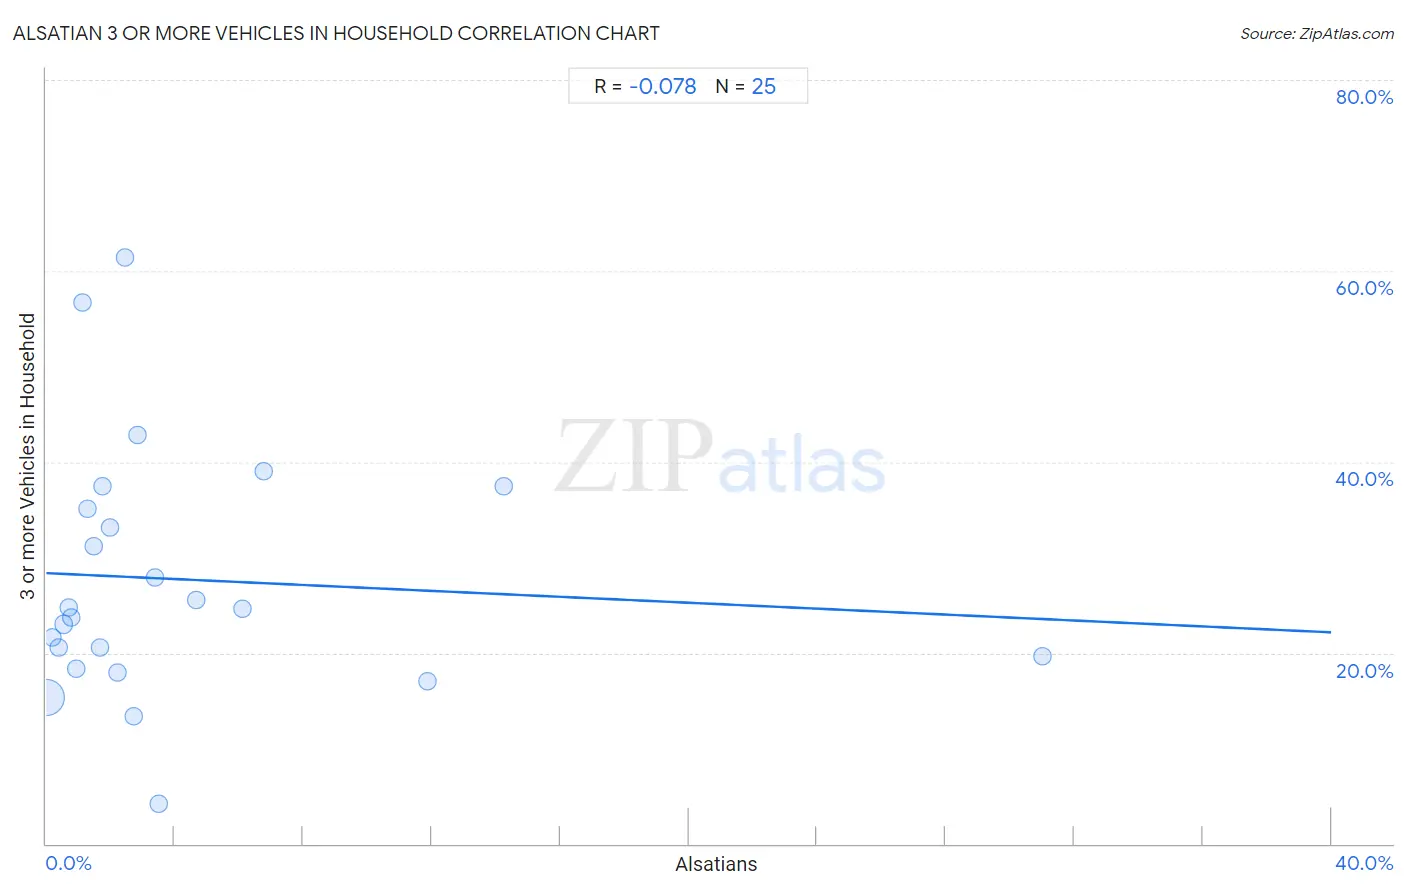
Alsatian 3 or more Vehicles in Household Correlation Chart
The statistical analysis conducted on geographies consisting of 82,678,763 people shows a slight negative correlation between the proportion of Alsatians and percentage of households with 3 or more vehicles available in the United States with a correlation coefficient (R) of -0.078 and weighted average of 18.0%. On average, for every 1% (one percent) increase in Alsatians within a typical geography, there is a decrease of 0.16% in percentage of households with 3 or more vehicles available.
It is essential to understand that the correlation between the percentage of Alsatians and percentage of households with 3 or more vehicles available does not imply a direct cause-and-effect relationship. It remains uncertain whether the presence of Alsatians influences an upward or downward trend in the level of percentage of households with 3 or more vehicles available within an area, or if Alsatians simply ended up residing in those areas with higher or lower levels of percentage of households with 3 or more vehicles available due to other factors.
Demographics Similar to Alsatians by 3 or more Vehicles in Household
In terms of 3 or more vehicles in household, the demographic groups most similar to Alsatians are Venezuelan (18.0%, a difference of 0.20%), Immigrants from Saudi Arabia (18.0%, a difference of 0.22%), Immigrants from Southern Europe (17.9%, a difference of 0.23%), Immigrants from Eastern Africa (18.0%, a difference of 0.28%), and Carpatho Rusyn (18.0%, a difference of 0.41%).
| Demographics | Rating | Rank | 3 or more Vehicles in Household |
| Mongolians | 2.3 /100 | #244 | Tragic 18.1% |
| Immigrants from Belize | 2.1 /100 | #245 | Tragic 18.1% |
| Immigrants from Australia | 2.0 /100 | #246 | Tragic 18.1% |
| Carpatho Rusyns | 1.9 /100 | #247 | Tragic 18.0% |
| Immigrants from Eastern Africa | 1.8 /100 | #248 | Tragic 18.0% |
| Immigrants from Saudi Arabia | 1.7 /100 | #249 | Tragic 18.0% |
| Venezuelans | 1.7 /100 | #250 | Tragic 18.0% |
| Alsatians | 1.5 /100 | #251 | Tragic 18.0% |
| Immigrants from Southern Europe | 1.4 /100 | #252 | Tragic 17.9% |
| Immigrants from Ethiopia | 1.3 /100 | #253 | Tragic 17.9% |
| Ethiopians | 1.2 /100 | #254 | Tragic 17.9% |
| Immigrants from Turkey | 1.2 /100 | #255 | Tragic 17.9% |
| Sub-Saharan Africans | 1.1 /100 | #256 | Tragic 17.9% |
| Immigrants from Eritrea | 1.1 /100 | #257 | Tragic 17.8% |
| Sudanese | 1.1 /100 | #258 | Tragic 17.8% |
Alsatian 3 or more Vehicles in Household Correlation Summary
| Measurement | Alsatian Data | 3 or more Vehicles in Household Data |
| Minimum | 0.016% | 4.2% |
| Maximum | 31.0% | 61.3% |
| Range | 31.0% | 57.1% |
| Mean | 4.2% | 27.7% |
| Median | 2.0% | 24.6% |
| Interquartile 25% (IQ1) | 0.87% | 19.0% |
| Interquartile 75% (IQ3) | 4.1% | 36.3% |
| Interquartile Range (IQR) | 3.2% | 17.3% |
| Standard Deviation (Sample) | 6.6% | 13.1% |
| Standard Deviation (Population) | 6.5% | 12.8% |
Correlation Details
| Alsatian Percentile | Sample Size | 3 or more Vehicles in Household |
[ 0.0% - 0.5% ] 0.016% | 81,405,599 | 15.4% |
[ 0.0% - 0.5% ] 0.20% | 928,029 | 21.6% |
[ 0.0% - 0.5% ] 0.38% | 110,747 | 20.5% |
[ 0.5% - 1.0% ] 0.56% | 119,006 | 23.0% |
[ 0.5% - 1.0% ] 0.72% | 32,091 | 24.8% |
[ 0.5% - 1.0% ] 0.79% | 42,079 | 23.7% |
[ 0.5% - 1.0% ] 0.95% | 5,784 | 18.4% |
[ 1.0% - 1.5% ] 1.15% | 262 | 56.7% |
[ 1.0% - 1.5% ] 1.29% | 4,355 | 35.1% |
[ 1.0% - 1.5% ] 1.47% | 2,792 | 31.2% |
[ 1.5% - 2.0% ] 1.65% | 5,440 | 20.6% |
[ 1.5% - 2.0% ] 1.75% | 1,604 | 37.5% |
[ 1.5% - 2.0% ] 1.97% | 1,017 | 33.1% |
[ 2.0% - 2.5% ] 2.23% | 1,573 | 18.0% |
[ 2.0% - 2.5% ] 2.47% | 243 | 61.3% |
[ 2.5% - 3.0% ] 2.73% | 1,321 | 13.4% |
[ 2.5% - 3.0% ] 2.86% | 70 | 42.9% |
[ 3.0% - 3.5% ] 3.39% | 827 | 27.9% |
[ 3.5% - 4.0% ] 3.52% | 1,848 | 4.2% |
[ 4.5% - 5.0% ] 4.67% | 707 | 25.6% |
[ 6.0% - 6.5% ] 6.11% | 2,994 | 24.6% |
[ 6.5% - 7.0% ] 6.77% | 9,202 | 39.0% |
[ 11.5% - 12.0% ] 11.86% | 118 | 17.1% |
[ 14.0% - 14.5% ] 14.25% | 723 | 37.5% |
[ 31.0% - 31.5% ] 31.02% | 332 | 19.7% |