Honduran 3 or more Vehicles in Household
COMPARE
Honduran
Select to Compare
3 or more Vehicles in Household
Honduran 3 or more Vehicles in Household
18.4%
3+ VEHICLES AVAILABLE
4.6/ 100
METRIC RATING
233rd/ 347
METRIC RANK
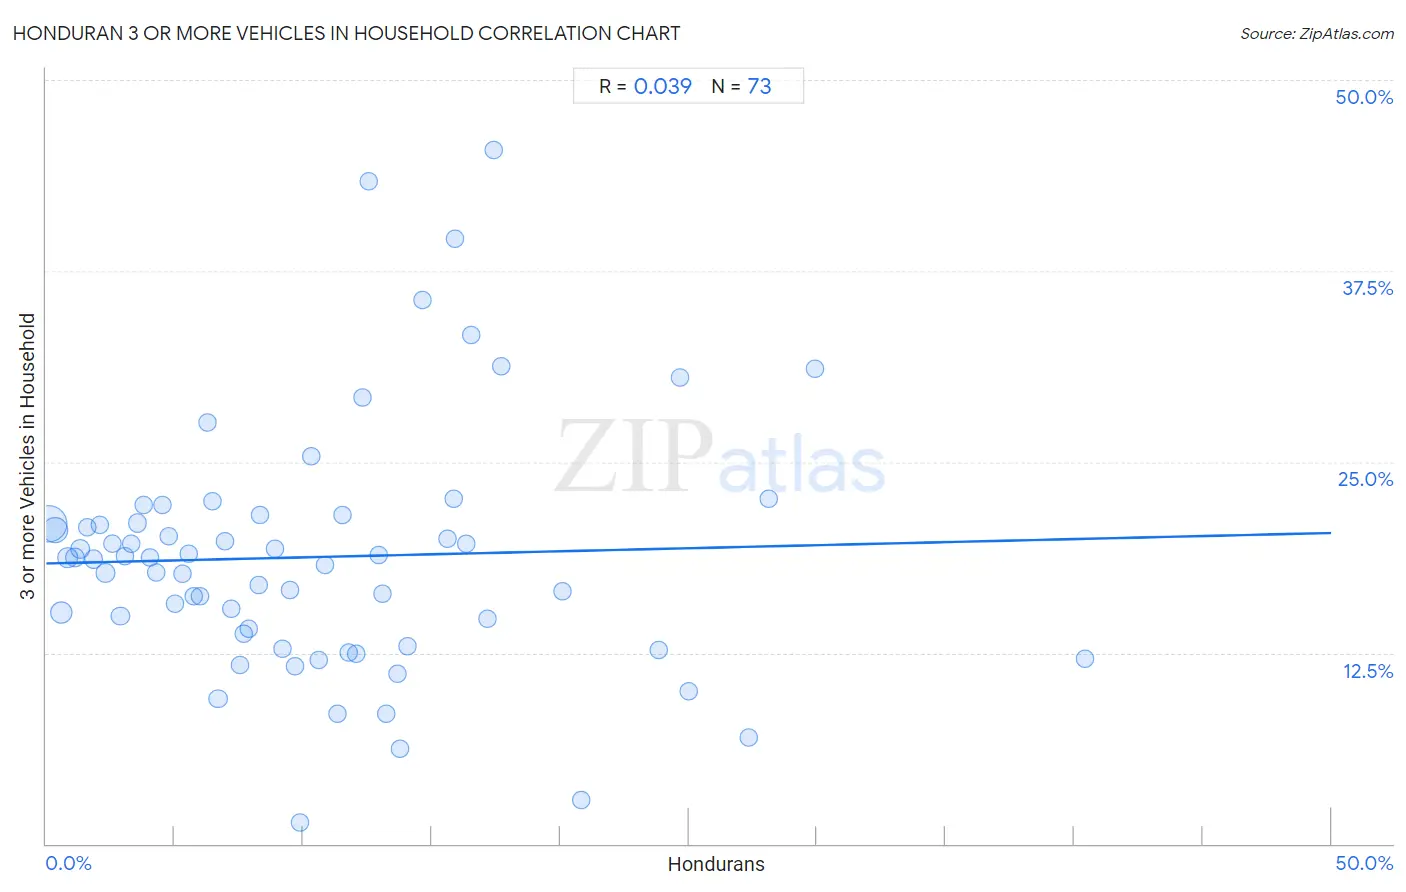
Honduran 3 or more Vehicles in Household Correlation Chart
The statistical analysis conducted on geographies consisting of 357,545,810 people shows no correlation between the proportion of Hondurans and percentage of households with 3 or more vehicles available in the United States with a correlation coefficient (R) of 0.039 and weighted average of 18.4%. On average, for every 1% (one percent) increase in Hondurans within a typical geography, there is an increase of 0.040% in percentage of households with 3 or more vehicles available.
It is essential to understand that the correlation between the percentage of Hondurans and percentage of households with 3 or more vehicles available does not imply a direct cause-and-effect relationship. It remains uncertain whether the presence of Hondurans influences an upward or downward trend in the level of percentage of households with 3 or more vehicles available within an area, or if Hondurans simply ended up residing in those areas with higher or lower levels of percentage of households with 3 or more vehicles available due to other factors.
Demographics Similar to Hondurans by 3 or more Vehicles in Household
In terms of 3 or more vehicles in household, the demographic groups most similar to Hondurans are Immigrants from Uganda (18.4%, a difference of 0.020%), Immigrants from North Macedonia (18.4%, a difference of 0.070%), Immigrants from Belgium (18.4%, a difference of 0.080%), Immigrants from Western Asia (18.4%, a difference of 0.11%), and Immigrants from Switzerland (18.4%, a difference of 0.16%).
| Demographics | Rating | Rank | 3 or more Vehicles in Household |
| Immigrants from Hungary | 5.5 /100 | #226 | Tragic 18.5% |
| Immigrants from Singapore | 5.4 /100 | #227 | Tragic 18.4% |
| Turks | 5.4 /100 | #228 | Tragic 18.4% |
| Immigrants from Switzerland | 5.0 /100 | #229 | Tragic 18.4% |
| Immigrants from Western Asia | 4.8 /100 | #230 | Tragic 18.4% |
| Immigrants from Belgium | 4.8 /100 | #231 | Tragic 18.4% |
| Immigrants from Uganda | 4.6 /100 | #232 | Tragic 18.4% |
| Hondurans | 4.6 /100 | #233 | Tragic 18.4% |
| Immigrants from North Macedonia | 4.4 /100 | #234 | Tragic 18.4% |
| Sierra Leoneans | 3.9 /100 | #235 | Tragic 18.3% |
| Immigrants from Malaysia | 3.6 /100 | #236 | Tragic 18.3% |
| Indonesians | 3.5 /100 | #237 | Tragic 18.3% |
| Immigrants from Honduras | 3.1 /100 | #238 | Tragic 18.2% |
| Immigrants from Middle Africa | 3.1 /100 | #239 | Tragic 18.2% |
| Immigrants from China | 2.9 /100 | #240 | Tragic 18.2% |
Honduran 3 or more Vehicles in Household Correlation Summary
| Measurement | Honduran Data | 3 or more Vehicles in Household Data |
| Minimum | 0.10% | 1.4% |
| Maximum | 40.4% | 45.5% |
| Range | 40.3% | 44.0% |
| Mean | 10.5% | 18.8% |
| Median | 9.2% | 18.7% |
| Interquartile 25% (IQ1) | 4.4% | 13.3% |
| Interquartile 75% (IQ3) | 14.3% | 21.2% |
| Interquartile Range (IQR) | 9.9% | 7.9% |
| Standard Deviation (Sample) | 8.0% | 8.2% |
| Standard Deviation (Population) | 7.9% | 8.1% |
Correlation Details
| Honduran Percentile | Sample Size | 3 or more Vehicles in Household |
[ 0.0% - 0.5% ] 0.10% | 181,075,426 | 21.0% |
[ 0.0% - 0.5% ] 0.36% | 69,785,652 | 20.6% |
[ 0.5% - 1.0% ] 0.59% | 35,541,962 | 15.1% |
[ 0.5% - 1.0% ] 0.83% | 20,436,536 | 18.7% |
[ 1.0% - 1.5% ] 1.10% | 13,106,595 | 18.7% |
[ 1.0% - 1.5% ] 1.33% | 7,997,488 | 19.3% |
[ 1.5% - 2.0% ] 1.58% | 4,130,968 | 20.7% |
[ 1.5% - 2.0% ] 1.83% | 3,816,861 | 18.6% |
[ 2.0% - 2.5% ] 2.09% | 2,631,827 | 20.9% |
[ 2.0% - 2.5% ] 2.30% | 3,354,880 | 17.7% |
[ 2.5% - 3.0% ] 2.57% | 1,994,322 | 19.7% |
[ 2.5% - 3.0% ] 2.88% | 4,250,046 | 14.9% |
[ 3.0% - 3.5% ] 3.05% | 1,544,167 | 18.8% |
[ 3.0% - 3.5% ] 3.32% | 750,024 | 19.6% |
[ 3.5% - 4.0% ] 3.54% | 918,199 | 21.0% |
[ 3.5% - 4.0% ] 3.78% | 718,313 | 22.2% |
[ 4.0% - 4.5% ] 4.02% | 615,093 | 18.8% |
[ 4.0% - 4.5% ] 4.27% | 524,093 | 17.8% |
[ 4.5% - 5.0% ] 4.53% | 660,797 | 22.2% |
[ 4.5% - 5.0% ] 4.78% | 333,675 | 20.1% |
[ 5.0% - 5.5% ] 5.01% | 463,437 | 15.7% |
[ 5.0% - 5.5% ] 5.29% | 425,284 | 17.7% |
[ 5.5% - 6.0% ] 5.53% | 75,900 | 19.0% |
[ 5.5% - 6.0% ] 5.74% | 202,669 | 16.2% |
[ 5.5% - 6.0% ] 5.96% | 190,727 | 16.2% |
[ 6.0% - 6.5% ] 6.30% | 77,005 | 27.6% |
[ 6.0% - 6.5% ] 6.48% | 39,601 | 22.4% |
[ 6.5% - 7.0% ] 6.69% | 607,938 | 9.5% |
[ 6.5% - 7.0% ] 6.96% | 154,358 | 19.8% |
[ 7.0% - 7.5% ] 7.19% | 93,374 | 15.4% |
[ 7.5% - 8.0% ] 7.52% | 48,198 | 11.7% |
[ 7.5% - 8.0% ] 7.66% | 67,559 | 13.7% |
[ 7.5% - 8.0% ] 7.88% | 84,865 | 14.1% |
[ 8.0% - 8.5% ] 8.26% | 3,390 | 16.9% |
[ 8.0% - 8.5% ] 8.34% | 10,431 | 21.6% |
[ 8.5% - 9.0% ] 8.91% | 28,839 | 19.3% |
[ 9.0% - 9.5% ] 9.20% | 133,846 | 12.7% |
[ 9.5% - 10.0% ] 9.51% | 68,158 | 16.6% |
[ 9.5% - 10.0% ] 9.67% | 11,924 | 11.6% |
[ 9.5% - 10.0% ] 9.87% | 152 | 1.4% |
[ 10.0% - 10.5% ] 10.29% | 35,189 | 25.4% |
[ 10.5% - 11.0% ] 10.62% | 70,778 | 12.0% |
[ 10.5% - 11.0% ] 10.85% | 60,388 | 18.3% |
[ 11.0% - 11.5% ] 11.32% | 74,024 | 8.5% |
[ 11.5% - 12.0% ] 11.54% | 61,156 | 21.5% |
[ 11.5% - 12.0% ] 11.76% | 8,750 | 12.5% |
[ 12.0% - 12.5% ] 12.06% | 2,247 | 12.4% |
[ 12.0% - 12.5% ] 12.32% | 406 | 29.2% |
[ 12.5% - 13.0% ] 12.54% | 1,699 | 43.4% |
[ 12.5% - 13.0% ] 12.92% | 9,070 | 18.9% |
[ 13.0% - 13.5% ] 13.08% | 36,642 | 16.4% |
[ 13.0% - 13.5% ] 13.21% | 18,496 | 8.5% |
[ 13.5% - 14.0% ] 13.67% | 18,017 | 11.2% |
[ 13.5% - 14.0% ] 13.79% | 28,306 | 6.2% |
[ 14.0% - 14.5% ] 14.04% | 62,599 | 12.9% |
[ 14.5% - 15.0% ] 14.64% | 1,762 | 35.6% |
[ 15.5% - 16.0% ] 15.62% | 1,088 | 19.9% |
[ 15.5% - 16.0% ] 15.86% | 3,392 | 22.6% |
[ 15.5% - 16.0% ] 15.92% | 2,581 | 39.6% |
[ 16.0% - 16.5% ] 16.37% | 28,120 | 19.7% |
[ 16.5% - 17.0% ] 16.53% | 7,556 | 33.3% |
[ 17.0% - 17.5% ] 17.16% | 16,930 | 14.7% |
[ 17.0% - 17.5% ] 17.42% | 999 | 45.5% |
[ 17.5% - 18.0% ] 17.69% | 944 | 31.2% |
[ 20.0% - 20.5% ] 20.10% | 2,304 | 16.5% |
[ 20.5% - 21.0% ] 20.80% | 8,989 | 2.8% |
[ 23.5% - 24.0% ] 23.86% | 2,712 | 12.7% |
[ 24.5% - 25.0% ] 24.67% | 3,559 | 30.5% |
[ 25.0% - 25.5% ] 25.00% | 16 | 10.0% |
[ 27.0% - 27.5% ] 27.34% | 673 | 6.9% |
[ 28.0% - 28.5% ] 28.12% | 64 | 22.6% |
[ 29.5% - 30.0% ] 29.94% | 1,540 | 31.1% |
[ 40.0% - 40.5% ] 40.43% | 235 | 12.1% |