Russian 3 or more Vehicles in Household
COMPARE
Russian
Select to Compare
3 or more Vehicles in Household
Russian 3 or more Vehicles in Household
18.8%
3+ VEHICLES AVAILABLE
14.2/ 100
METRIC RATING
205th/ 347
METRIC RANK
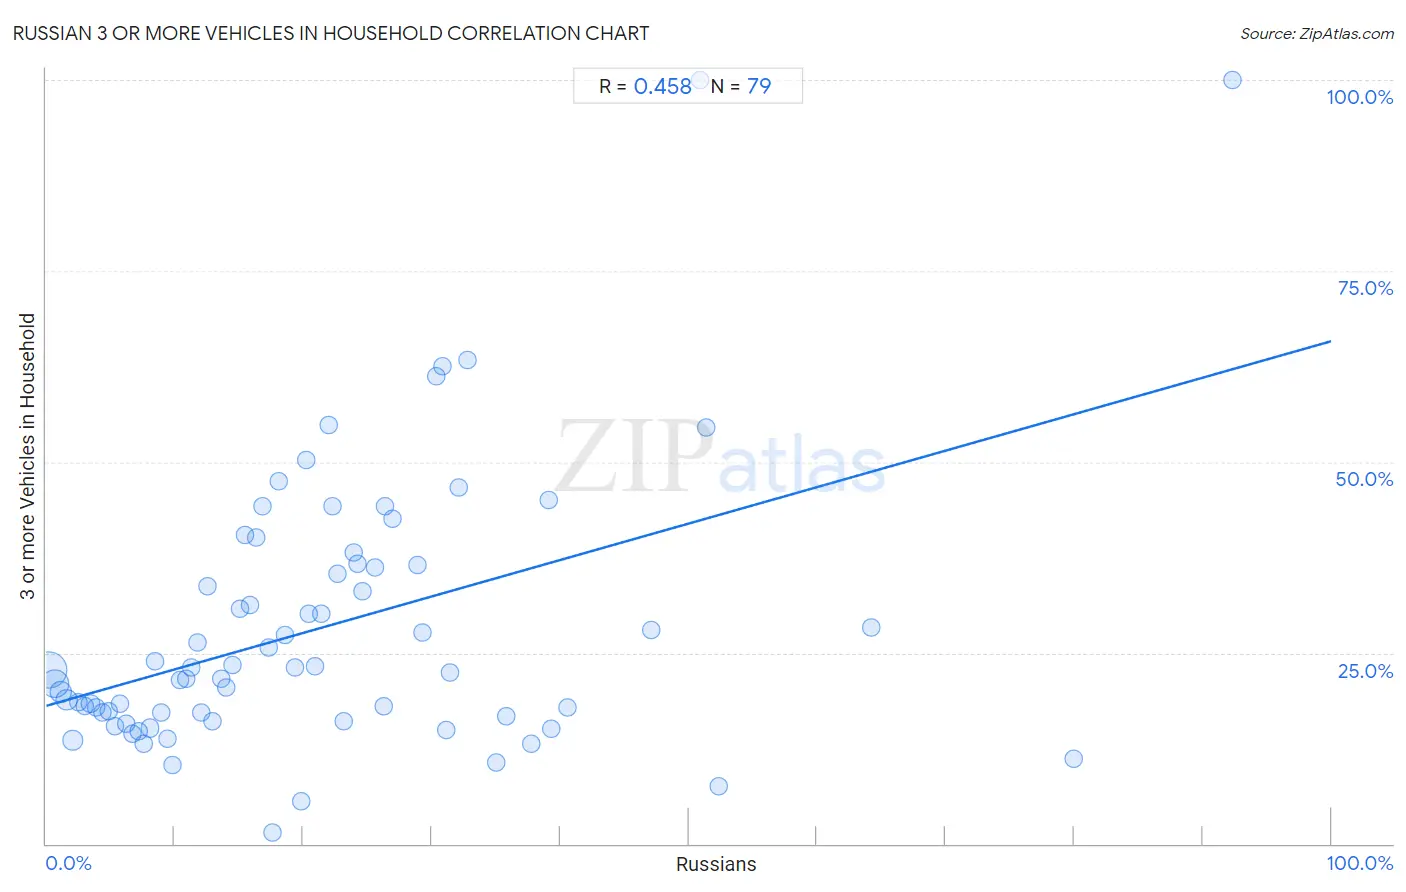
Russian 3 or more Vehicles in Household Correlation Chart
The statistical analysis conducted on geographies consisting of 511,489,860 people shows a moderate positive correlation between the proportion of Russians and percentage of households with 3 or more vehicles available in the United States with a correlation coefficient (R) of 0.458 and weighted average of 18.8%. On average, for every 1% (one percent) increase in Russians within a typical geography, there is an increase of 0.48% in percentage of households with 3 or more vehicles available.
It is essential to understand that the correlation between the percentage of Russians and percentage of households with 3 or more vehicles available does not imply a direct cause-and-effect relationship. It remains uncertain whether the presence of Russians influences an upward or downward trend in the level of percentage of households with 3 or more vehicles available within an area, or if Russians simply ended up residing in those areas with higher or lower levels of percentage of households with 3 or more vehicles available due to other factors.
Demographics Similar to Russians by 3 or more Vehicles in Household
In terms of 3 or more vehicles in household, the demographic groups most similar to Russians are Immigrants from Eastern Asia (18.8%, a difference of 0.010%), Immigrants from Romania (18.9%, a difference of 0.070%), Immigrants from Chile (18.8%, a difference of 0.090%), Tohono O'odham (18.9%, a difference of 0.10%), and Immigrants from Burma/Myanmar (18.8%, a difference of 0.10%).
| Demographics | Rating | Rank | 3 or more Vehicles in Household |
| Egyptians | 19.5 /100 | #198 | Poor 19.0% |
| Immigrants from Norway | 19.0 /100 | #199 | Poor 19.0% |
| Argentineans | 18.2 /100 | #200 | Poor 18.9% |
| Arabs | 17.7 /100 | #201 | Poor 18.9% |
| Immigrants from Austria | 15.4 /100 | #202 | Poor 18.9% |
| Tohono O'odham | 14.8 /100 | #203 | Poor 18.9% |
| Immigrants from Romania | 14.6 /100 | #204 | Poor 18.9% |
| Russians | 14.2 /100 | #205 | Poor 18.8% |
| Immigrants from Eastern Asia | 14.1 /100 | #206 | Poor 18.8% |
| Immigrants from Chile | 13.6 /100 | #207 | Poor 18.8% |
| Immigrants from Burma/Myanmar | 13.6 /100 | #208 | Poor 18.8% |
| Immigrants from Egypt | 13.5 /100 | #209 | Poor 18.8% |
| Bulgarians | 13.1 /100 | #210 | Poor 18.8% |
| Immigrants from Kenya | 12.4 /100 | #211 | Poor 18.8% |
| Panamanians | 11.6 /100 | #212 | Poor 18.8% |
Russian 3 or more Vehicles in Household Correlation Summary
| Measurement | Russian Data | 3 or more Vehicles in Household Data |
| Minimum | 0.22% | 1.4% |
| Maximum | 92.3% | 100.0% |
| Range | 92.1% | 98.6% |
| Mean | 21.4% | 28.3% |
| Median | 18.1% | 22.8% |
| Interquartile 25% (IQ1) | 8.9% | 16.7% |
| Interquartile 75% (IQ3) | 29.2% | 36.5% |
| Interquartile Range (IQR) | 20.3% | 19.9% |
| Standard Deviation (Sample) | 17.3% | 18.0% |
| Standard Deviation (Population) | 17.2% | 17.9% |
Correlation Details
| Russian Percentile | Sample Size | 3 or more Vehicles in Household |
[ 0.0% - 0.5% ] 0.22% | 235,283,659 | 22.8% |
[ 0.5% - 1.0% ] 0.67% | 127,002,857 | 20.9% |
[ 1.0% - 1.5% ] 1.12% | 59,089,367 | 19.9% |
[ 1.5% - 2.0% ] 1.60% | 36,113,404 | 18.8% |
[ 2.0% - 2.5% ] 2.07% | 24,954,500 | 13.6% |
[ 2.5% - 3.0% ] 2.51% | 8,395,069 | 18.6% |
[ 2.5% - 3.0% ] 2.98% | 5,685,815 | 18.0% |
[ 3.0% - 3.5% ] 3.44% | 3,357,017 | 18.3% |
[ 3.5% - 4.0% ] 3.92% | 2,473,160 | 17.9% |
[ 4.0% - 4.5% ] 4.34% | 2,292,151 | 17.1% |
[ 4.5% - 5.0% ] 4.82% | 1,266,122 | 17.3% |
[ 5.0% - 5.5% ] 5.30% | 1,319,418 | 15.4% |
[ 5.5% - 6.0% ] 5.73% | 750,981 | 18.3% |
[ 6.0% - 6.5% ] 6.23% | 785,806 | 15.7% |
[ 6.5% - 7.0% ] 6.71% | 629,854 | 14.5% |
[ 7.0% - 7.5% ] 7.18% | 391,787 | 14.8% |
[ 7.5% - 8.0% ] 7.63% | 465,483 | 13.1% |
[ 8.0% - 8.5% ] 8.08% | 297,356 | 15.1% |
[ 8.0% - 8.5% ] 8.49% | 120,470 | 23.9% |
[ 8.5% - 9.0% ] 8.92% | 226,952 | 17.2% |
[ 9.0% - 9.5% ] 9.39% | 151,185 | 13.7% |
[ 9.5% - 10.0% ] 9.80% | 87,172 | 10.3% |
[ 10.0% - 10.5% ] 10.39% | 62,421 | 21.5% |
[ 10.5% - 11.0% ] 10.88% | 28,274 | 21.6% |
[ 11.0% - 11.5% ] 11.29% | 28,675 | 23.1% |
[ 11.5% - 12.0% ] 11.76% | 14,386 | 26.4% |
[ 12.0% - 12.5% ] 12.07% | 32,505 | 17.3% |
[ 12.5% - 13.0% ] 12.54% | 4,475 | 33.8% |
[ 12.5% - 13.0% ] 12.93% | 14,112 | 16.0% |
[ 13.5% - 14.0% ] 13.66% | 3,896 | 21.5% |
[ 14.0% - 14.5% ] 14.01% | 17,047 | 20.5% |
[ 14.0% - 14.5% ] 14.45% | 13,935 | 23.4% |
[ 15.0% - 15.5% ] 15.08% | 7,299 | 30.8% |
[ 15.0% - 15.5% ] 15.49% | 1,504 | 40.4% |
[ 15.5% - 16.0% ] 15.81% | 5,237 | 31.3% |
[ 16.0% - 16.5% ] 16.31% | 3,096 | 40.2% |
[ 16.5% - 17.0% ] 16.83% | 4,903 | 44.2% |
[ 17.0% - 17.5% ] 17.31% | 2,606 | 25.7% |
[ 17.5% - 18.0% ] 17.59% | 83,126 | 1.4% |
[ 18.0% - 18.5% ] 18.14% | 397 | 47.4% |
[ 18.5% - 19.0% ] 18.61% | 2,289 | 27.4% |
[ 19.0% - 19.5% ] 19.35% | 31 | 23.1% |
[ 19.5% - 20.0% ] 19.83% | 237 | 5.5% |
[ 20.0% - 20.5% ] 20.23% | 2,640 | 50.3% |
[ 20.0% - 20.5% ] 20.48% | 840 | 30.1% |
[ 20.5% - 21.0% ] 20.92% | 980 | 23.2% |
[ 21.0% - 21.5% ] 21.36% | 618 | 30.2% |
[ 21.5% - 22.0% ] 21.96% | 510 | 54.8% |
[ 22.0% - 22.5% ] 22.32% | 2,943 | 44.2% |
[ 22.5% - 23.0% ] 22.68% | 291 | 35.3% |
[ 23.0% - 23.5% ] 23.19% | 789 | 16.0% |
[ 23.5% - 24.0% ] 23.93% | 610 | 38.1% |
[ 24.0% - 24.5% ] 24.21% | 318 | 36.6% |
[ 24.5% - 25.0% ] 24.57% | 867 | 33.1% |
[ 25.5% - 26.0% ] 25.57% | 395 | 36.2% |
[ 26.0% - 26.5% ] 26.24% | 789 | 18.0% |
[ 26.0% - 26.5% ] 26.35% | 353 | 44.2% |
[ 26.5% - 27.0% ] 26.92% | 78 | 42.5% |
[ 28.5% - 29.0% ] 28.89% | 90 | 36.5% |
[ 29.0% - 29.5% ] 29.23% | 1,683 | 27.7% |
[ 30.0% - 30.5% ] 30.30% | 462 | 61.1% |
[ 30.5% - 31.0% ] 30.83% | 120 | 62.5% |
[ 31.0% - 31.5% ] 31.13% | 681 | 14.8% |
[ 31.0% - 31.5% ] 31.43% | 70 | 22.5% |
[ 32.0% - 32.5% ] 32.13% | 305 | 46.6% |
[ 32.5% - 33.0% ] 32.80% | 503 | 63.3% |
[ 34.5% - 35.0% ] 35.00% | 640 | 10.6% |
[ 35.5% - 36.0% ] 35.79% | 95 | 16.7% |
[ 37.5% - 38.0% ] 37.74% | 106 | 13.1% |
[ 39.0% - 39.5% ] 39.12% | 979 | 44.9% |
[ 39.0% - 39.5% ] 39.32% | 234 | 15.0% |
[ 40.5% - 41.0% ] 40.56% | 143 | 17.8% |
[ 47.0% - 47.5% ] 47.06% | 51 | 28.0% |
[ 50.5% - 51.0% ] 50.90% | 167 | 100.0% |
[ 51.0% - 51.5% ] 51.39% | 72 | 54.5% |
[ 52.0% - 52.5% ] 52.38% | 105 | 7.6% |
[ 64.0% - 64.5% ] 64.23% | 274 | 28.4% |
[ 80.0% - 80.5% ] 80.00% | 10 | 11.1% |
[ 92.0% - 92.5% ] 92.31% | 13 | 100.0% |