Latvian 3 or more Vehicles in Household
COMPARE
Latvian
Select to Compare
3 or more Vehicles in Household
Latvian 3 or more Vehicles in Household
19.3%
3+ VEHICLES AVAILABLE
35.7/ 100
METRIC RATING
184th/ 347
METRIC RANK
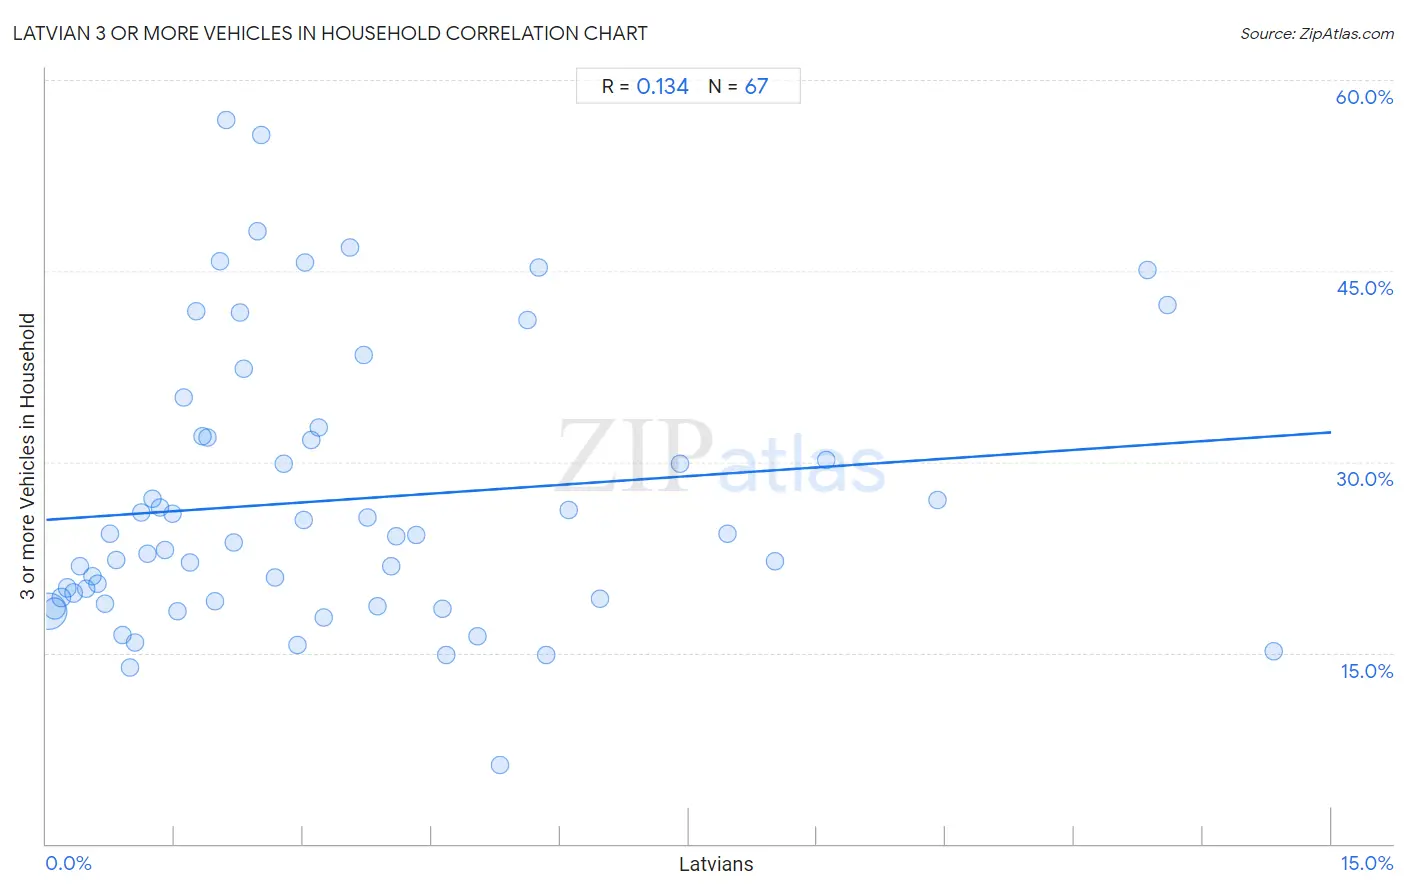
Latvian 3 or more Vehicles in Household Correlation Chart
The statistical analysis conducted on geographies consisting of 220,591,398 people shows a poor positive correlation between the proportion of Latvians and percentage of households with 3 or more vehicles available in the United States with a correlation coefficient (R) of 0.134 and weighted average of 19.3%. On average, for every 1% (one percent) increase in Latvians within a typical geography, there is an increase of 0.46% in percentage of households with 3 or more vehicles available.
It is essential to understand that the correlation between the percentage of Latvians and percentage of households with 3 or more vehicles available does not imply a direct cause-and-effect relationship. It remains uncertain whether the presence of Latvians influences an upward or downward trend in the level of percentage of households with 3 or more vehicles available within an area, or if Latvians simply ended up residing in those areas with higher or lower levels of percentage of households with 3 or more vehicles available due to other factors.
Demographics Similar to Latvians by 3 or more Vehicles in Household
In terms of 3 or more vehicles in household, the demographic groups most similar to Latvians are Cajun (19.3%, a difference of 0.020%), Cuban (19.3%, a difference of 0.070%), Romanian (19.3%, a difference of 0.11%), South African (19.3%, a difference of 0.15%), and Immigrants from South Central Asia (19.3%, a difference of 0.26%).
| Demographics | Rating | Rank | 3 or more Vehicles in Household |
| Immigrants from Peru | 41.1 /100 | #177 | Average 19.4% |
| Immigrants from Syria | 40.3 /100 | #178 | Average 19.4% |
| Immigrants from South Central Asia | 38.9 /100 | #179 | Fair 19.3% |
| South Africans | 37.5 /100 | #180 | Fair 19.3% |
| Romanians | 37.1 /100 | #181 | Fair 19.3% |
| Cubans | 36.6 /100 | #182 | Fair 19.3% |
| Cajuns | 36.0 /100 | #183 | Fair 19.3% |
| Latvians | 35.7 /100 | #184 | Fair 19.3% |
| Immigrants from Sri Lanka | 30.7 /100 | #185 | Fair 19.2% |
| Immigrants from Sweden | 29.0 /100 | #186 | Fair 19.2% |
| Immigrants from Hong Kong | 28.3 /100 | #187 | Fair 19.2% |
| Immigrants from Kuwait | 26.1 /100 | #188 | Fair 19.1% |
| Indians (Asian) | 26.0 /100 | #189 | Fair 19.1% |
| Immigrants from Zimbabwe | 25.5 /100 | #190 | Fair 19.1% |
| South American Indians | 25.4 /100 | #191 | Fair 19.1% |
Latvian 3 or more Vehicles in Household Correlation Summary
| Measurement | Latvian Data | 3 or more Vehicles in Household Data |
| Minimum | 0.030% | 6.2% |
| Maximum | 14.3% | 56.8% |
| Range | 14.3% | 50.6% |
| Mean | 3.4% | 27.0% |
| Median | 2.5% | 24.2% |
| Interquartile 25% (IQ1) | 1.2% | 19.0% |
| Interquartile 75% (IQ3) | 4.6% | 32.0% |
| Interquartile Range (IQR) | 3.4% | 13.0% |
| Standard Deviation (Sample) | 3.2% | 10.9% |
| Standard Deviation (Population) | 3.2% | 10.9% |
Correlation Details
| Latvian Percentile | Sample Size | 3 or more Vehicles in Household |
[ 0.0% - 0.5% ] 0.030% | 161,491,256 | 18.2% |
[ 0.0% - 0.5% ] 0.100% | 37,586,827 | 18.5% |
[ 0.0% - 0.5% ] 0.17% | 10,108,886 | 19.4% |
[ 0.0% - 0.5% ] 0.25% | 4,585,220 | 20.1% |
[ 0.0% - 0.5% ] 0.32% | 2,638,204 | 19.7% |
[ 0.0% - 0.5% ] 0.39% | 1,353,368 | 21.8% |
[ 0.0% - 0.5% ] 0.47% | 592,742 | 20.0% |
[ 0.5% - 1.0% ] 0.53% | 614,493 | 21.0% |
[ 0.5% - 1.0% ] 0.60% | 467,655 | 20.4% |
[ 0.5% - 1.0% ] 0.68% | 282,488 | 18.9% |
[ 0.5% - 1.0% ] 0.75% | 188,907 | 24.3% |
[ 0.5% - 1.0% ] 0.81% | 87,279 | 22.3% |
[ 0.5% - 1.0% ] 0.89% | 119,240 | 16.4% |
[ 0.5% - 1.0% ] 0.97% | 76,776 | 13.8% |
[ 1.0% - 1.5% ] 1.03% | 107,968 | 15.8% |
[ 1.0% - 1.5% ] 1.11% | 10,507 | 26.0% |
[ 1.0% - 1.5% ] 1.18% | 31,071 | 22.8% |
[ 1.0% - 1.5% ] 1.24% | 6,472 | 27.1% |
[ 1.0% - 1.5% ] 1.33% | 21,033 | 26.4% |
[ 1.0% - 1.5% ] 1.39% | 13,943 | 23.1% |
[ 1.0% - 1.5% ] 1.48% | 11,493 | 25.9% |
[ 1.5% - 2.0% ] 1.53% | 47,136 | 18.3% |
[ 1.5% - 2.0% ] 1.61% | 10,210 | 35.0% |
[ 1.5% - 2.0% ] 1.68% | 12,516 | 22.1% |
[ 1.5% - 2.0% ] 1.75% | 4,502 | 41.8% |
[ 1.5% - 2.0% ] 1.82% | 11,282 | 32.0% |
[ 1.5% - 2.0% ] 1.88% | 9,435 | 32.0% |
[ 1.5% - 2.0% ] 1.98% | 13,973 | 19.0% |
[ 2.0% - 2.5% ] 2.03% | 4,276 | 45.7% |
[ 2.0% - 2.5% ] 2.10% | 1,807 | 56.8% |
[ 2.0% - 2.5% ] 2.19% | 20,529 | 23.7% |
[ 2.0% - 2.5% ] 2.26% | 3,635 | 41.8% |
[ 2.0% - 2.5% ] 2.31% | 1,861 | 37.3% |
[ 2.0% - 2.5% ] 2.46% | 1,745 | 48.1% |
[ 2.5% - 3.0% ] 2.51% | 1,392 | 55.6% |
[ 2.5% - 3.0% ] 2.67% | 13,497 | 20.9% |
[ 2.5% - 3.0% ] 2.77% | 3,575 | 29.8% |
[ 2.5% - 3.0% ] 2.94% | 2,010 | 15.6% |
[ 3.0% - 3.5% ] 3.01% | 133 | 25.5% |
[ 3.0% - 3.5% ] 3.03% | 8,425 | 45.7% |
[ 3.0% - 3.5% ] 3.09% | 162 | 31.7% |
[ 3.0% - 3.5% ] 3.17% | 441 | 32.7% |
[ 3.0% - 3.5% ] 3.23% | 402 | 17.8% |
[ 3.5% - 4.0% ] 3.55% | 732 | 46.8% |
[ 3.5% - 4.0% ] 3.70% | 811 | 38.4% |
[ 3.5% - 4.0% ] 3.74% | 187 | 25.6% |
[ 3.5% - 4.0% ] 3.87% | 1,472 | 18.7% |
[ 4.0% - 4.5% ] 4.03% | 2,036 | 21.8% |
[ 4.0% - 4.5% ] 4.09% | 220 | 24.2% |
[ 4.0% - 4.5% ] 4.32% | 1,343 | 24.2% |
[ 4.5% - 5.0% ] 4.62% | 2,143 | 18.5% |
[ 4.5% - 5.0% ] 4.67% | 300 | 14.8% |
[ 5.0% - 5.5% ] 5.03% | 159 | 16.3% |
[ 5.0% - 5.5% ] 5.30% | 774 | 6.2% |
[ 5.5% - 6.0% ] 5.62% | 4,611 | 41.2% |
[ 5.5% - 6.0% ] 5.75% | 226 | 45.3% |
[ 5.5% - 6.0% ] 5.83% | 223 | 14.9% |
[ 6.0% - 6.5% ] 6.10% | 771 | 26.2% |
[ 6.0% - 6.5% ] 6.46% | 449 | 19.2% |
[ 7.0% - 7.5% ] 7.39% | 2,313 | 29.9% |
[ 7.5% - 8.0% ] 7.95% | 390 | 24.3% |
[ 8.5% - 9.0% ] 8.51% | 94 | 22.2% |
[ 9.0% - 9.5% ] 9.11% | 428 | 30.1% |
[ 10.0% - 10.5% ] 10.41% | 442 | 27.0% |
[ 12.5% - 13.0% ] 12.85% | 428 | 45.0% |
[ 13.0% - 13.5% ] 13.10% | 84 | 42.3% |
[ 14.0% - 14.5% ] 14.32% | 1,990 | 15.1% |