Carpatho Rusyn 3 or more Vehicles in Household
COMPARE
Carpatho Rusyn
Select to Compare
3 or more Vehicles in Household
Carpatho Rusyn 3 or more Vehicles in Household
18.0%
3+ VEHICLES AVAILABLE
1.9/ 100
METRIC RATING
247th/ 347
METRIC RANK
Carpatho Rusyn 3 or more Vehicles in Household Correlation Chart
The statistical analysis conducted on geographies consisting of 58,865,227 people shows no correlation between the proportion of Carpatho Rusyns and percentage of households with 3 or more vehicles available in the United States with a correlation coefficient (R) of -0.008 and weighted average of 18.0%. On average, for every 1% (one percent) increase in Carpatho Rusyns within a typical geography, there is a decrease of 0.048% in percentage of households with 3 or more vehicles available.
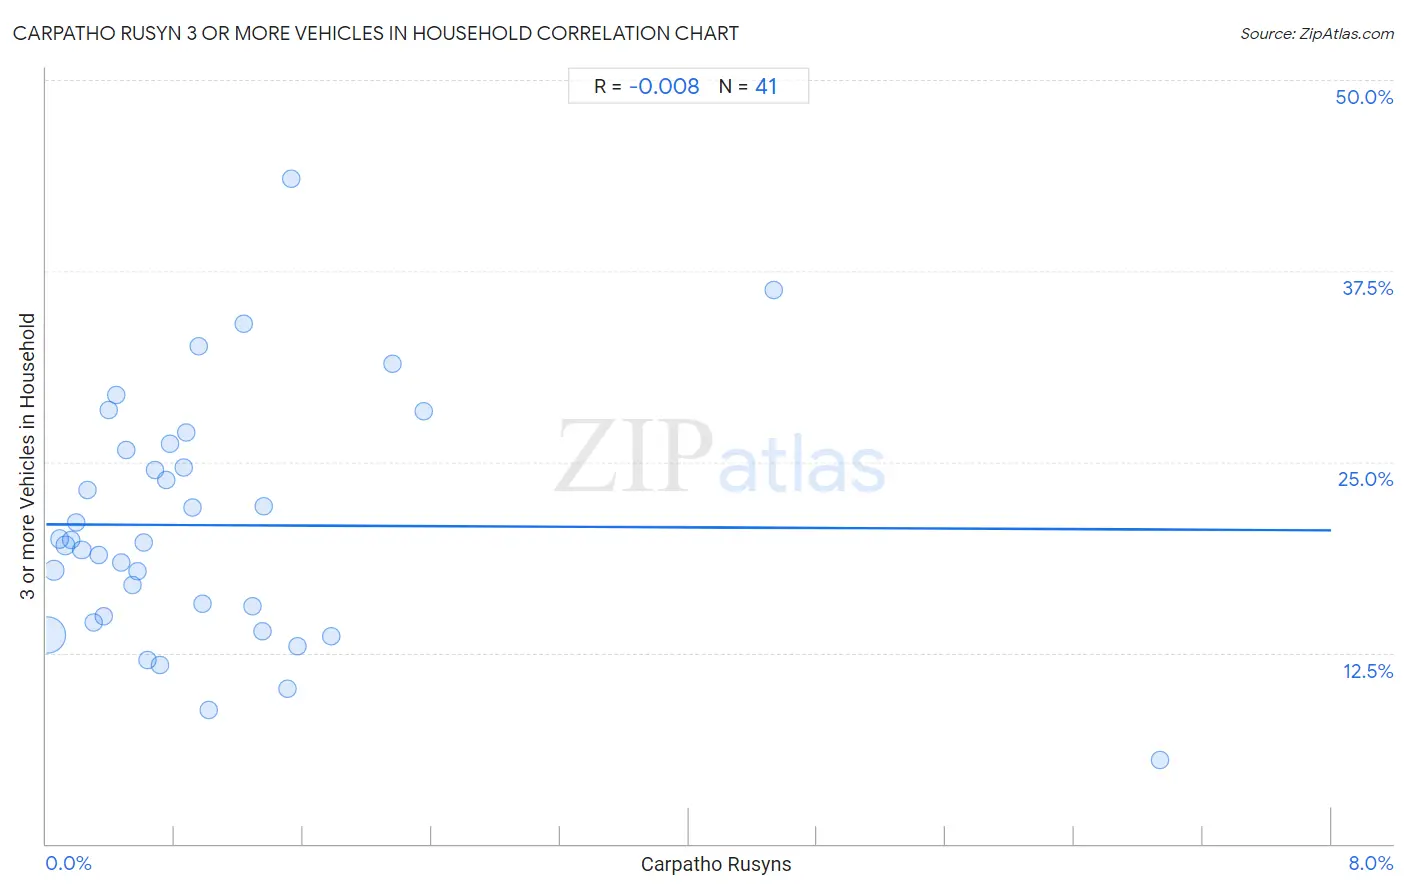
It is essential to understand that the correlation between the percentage of Carpatho Rusyns and percentage of households with 3 or more vehicles available does not imply a direct cause-and-effect relationship. It remains uncertain whether the presence of Carpatho Rusyns influences an upward or downward trend in the level of percentage of households with 3 or more vehicles available within an area, or if Carpatho Rusyns simply ended up residing in those areas with higher or lower levels of percentage of households with 3 or more vehicles available due to other factors.
Demographics Similar to Carpatho Rusyns by 3 or more Vehicles in Household
In terms of 3 or more vehicles in household, the demographic groups most similar to Carpatho Rusyns are Immigrants from Eastern Africa (18.0%, a difference of 0.13%), Immigrants from Australia (18.1%, a difference of 0.16%), Immigrants from Saudi Arabia (18.0%, a difference of 0.19%), Venezuelan (18.0%, a difference of 0.21%), and Immigrants from Belize (18.1%, a difference of 0.23%).
| Demographics | Rating | Rank | 3 or more Vehicles in Household |
| Immigrants from China | 2.9 /100 | #240 | Tragic 18.2% |
| Africans | 2.7 /100 | #241 | Tragic 18.2% |
| Hopi | 2.5 /100 | #242 | Tragic 18.2% |
| Immigrants from Europe | 2.4 /100 | #243 | Tragic 18.1% |
| Mongolians | 2.3 /100 | #244 | Tragic 18.1% |
| Immigrants from Belize | 2.1 /100 | #245 | Tragic 18.1% |
| Immigrants from Australia | 2.0 /100 | #246 | Tragic 18.1% |
| Carpatho Rusyns | 1.9 /100 | #247 | Tragic 18.0% |
| Immigrants from Eastern Africa | 1.8 /100 | #248 | Tragic 18.0% |
| Immigrants from Saudi Arabia | 1.7 /100 | #249 | Tragic 18.0% |
| Venezuelans | 1.7 /100 | #250 | Tragic 18.0% |
| Alsatians | 1.5 /100 | #251 | Tragic 18.0% |
| Immigrants from Southern Europe | 1.4 /100 | #252 | Tragic 17.9% |
| Immigrants from Ethiopia | 1.3 /100 | #253 | Tragic 17.9% |
| Ethiopians | 1.2 /100 | #254 | Tragic 17.9% |
Carpatho Rusyn 3 or more Vehicles in Household Correlation Summary
| Measurement | Carpatho Rusyn Data | 3 or more Vehicles in Household Data |
| Minimum | 0.0073% | 5.5% |
| Maximum | 6.9% | 43.5% |
| Range | 6.9% | 38.0% |
| Mean | 1.0% | 20.9% |
| Median | 0.71% | 19.7% |
| Interquartile 25% (IQ1) | 0.34% | 14.7% |
| Interquartile 75% (IQ3) | 1.3% | 26.0% |
| Interquartile Range (IQR) | 0.97% | 11.3% |
| Standard Deviation (Sample) | 1.2% | 8.0% |
| Standard Deviation (Population) | 1.2% | 7.9% |
Correlation Details
| Carpatho Rusyn Percentile | Sample Size | 3 or more Vehicles in Household |
[ 0.0% - 0.5% ] 0.0073% | 48,800,227 | 13.7% |
[ 0.0% - 0.5% ] 0.047% | 4,982,615 | 17.9% |
[ 0.0% - 0.5% ] 0.083% | 1,902,285 | 19.9% |
[ 0.0% - 0.5% ] 0.12% | 1,197,439 | 19.5% |
[ 0.0% - 0.5% ] 0.16% | 397,987 | 19.9% |
[ 0.0% - 0.5% ] 0.19% | 325,327 | 21.0% |
[ 0.0% - 0.5% ] 0.22% | 312,934 | 19.2% |
[ 0.0% - 0.5% ] 0.26% | 124,552 | 23.2% |
[ 0.0% - 0.5% ] 0.29% | 231,207 | 14.5% |
[ 0.0% - 0.5% ] 0.33% | 104,929 | 18.9% |
[ 0.0% - 0.5% ] 0.36% | 53,874 | 14.9% |
[ 0.0% - 0.5% ] 0.39% | 54,755 | 28.4% |
[ 0.0% - 0.5% ] 0.43% | 30,200 | 29.4% |
[ 0.0% - 0.5% ] 0.47% | 123,172 | 18.4% |
[ 0.0% - 0.5% ] 0.50% | 28,082 | 25.7% |
[ 0.5% - 1.0% ] 0.54% | 10,950 | 16.9% |
[ 0.5% - 1.0% ] 0.56% | 10,632 | 17.9% |
[ 0.5% - 1.0% ] 0.61% | 61,067 | 19.7% |
[ 0.5% - 1.0% ] 0.63% | 12,042 | 12.0% |
[ 0.5% - 1.0% ] 0.67% | 3,560 | 24.5% |
[ 0.5% - 1.0% ] 0.71% | 8,503 | 11.7% |
[ 0.5% - 1.0% ] 0.75% | 17,748 | 23.8% |
[ 0.5% - 1.0% ] 0.77% | 1,550 | 26.2% |
[ 0.5% - 1.0% ] 0.85% | 3,275 | 24.6% |
[ 0.5% - 1.0% ] 0.88% | 20,914 | 26.9% |
[ 0.5% - 1.0% ] 0.91% | 3,853 | 22.0% |
[ 0.5% - 1.0% ] 0.95% | 5,584 | 32.6% |
[ 0.5% - 1.0% ] 0.97% | 617 | 15.8% |
[ 1.0% - 1.5% ] 1.01% | 7,408 | 8.7% |
[ 1.0% - 1.5% ] 1.23% | 9,985 | 34.0% |
[ 1.0% - 1.5% ] 1.29% | 3,031 | 15.5% |
[ 1.0% - 1.5% ] 1.34% | 7,514 | 13.9% |
[ 1.0% - 1.5% ] 1.36% | 1,841 | 22.1% |
[ 1.5% - 2.0% ] 1.50% | 466 | 10.2% |
[ 1.5% - 2.0% ] 1.53% | 721 | 43.5% |
[ 1.5% - 2.0% ] 1.56% | 831 | 13.0% |
[ 1.5% - 2.0% ] 1.78% | 957 | 13.6% |
[ 2.0% - 2.5% ] 2.15% | 325 | 31.5% |
[ 2.0% - 2.5% ] 2.35% | 85 | 28.3% |
[ 4.5% - 5.0% ] 4.53% | 265 | 36.2% |
[ 6.5% - 7.0% ] 6.93% | 1,918 | 5.5% |