Immigrants from Switzerland 3 or more Vehicles in Household
COMPARE
Immigrants from Switzerland
Select to Compare
3 or more Vehicles in Household
Immigrants from Switzerland 3 or more Vehicles in Household
18.4%
3+ VEHICLES AVAILABLE
5.0/ 100
METRIC RATING
229th/ 347
METRIC RANK
Immigrants from Switzerland 3 or more Vehicles in Household Correlation Chart
The statistical analysis conducted on geographies consisting of 148,020,738 people shows a weak negative correlation between the proportion of Immigrants from Switzerland and percentage of households with 3 or more vehicles available in the United States with a correlation coefficient (R) of -0.220 and weighted average of 18.4%. On average, for every 1% (one percent) increase in Immigrants from Switzerland within a typical geography, there is a decrease of 1.1% in percentage of households with 3 or more vehicles available.
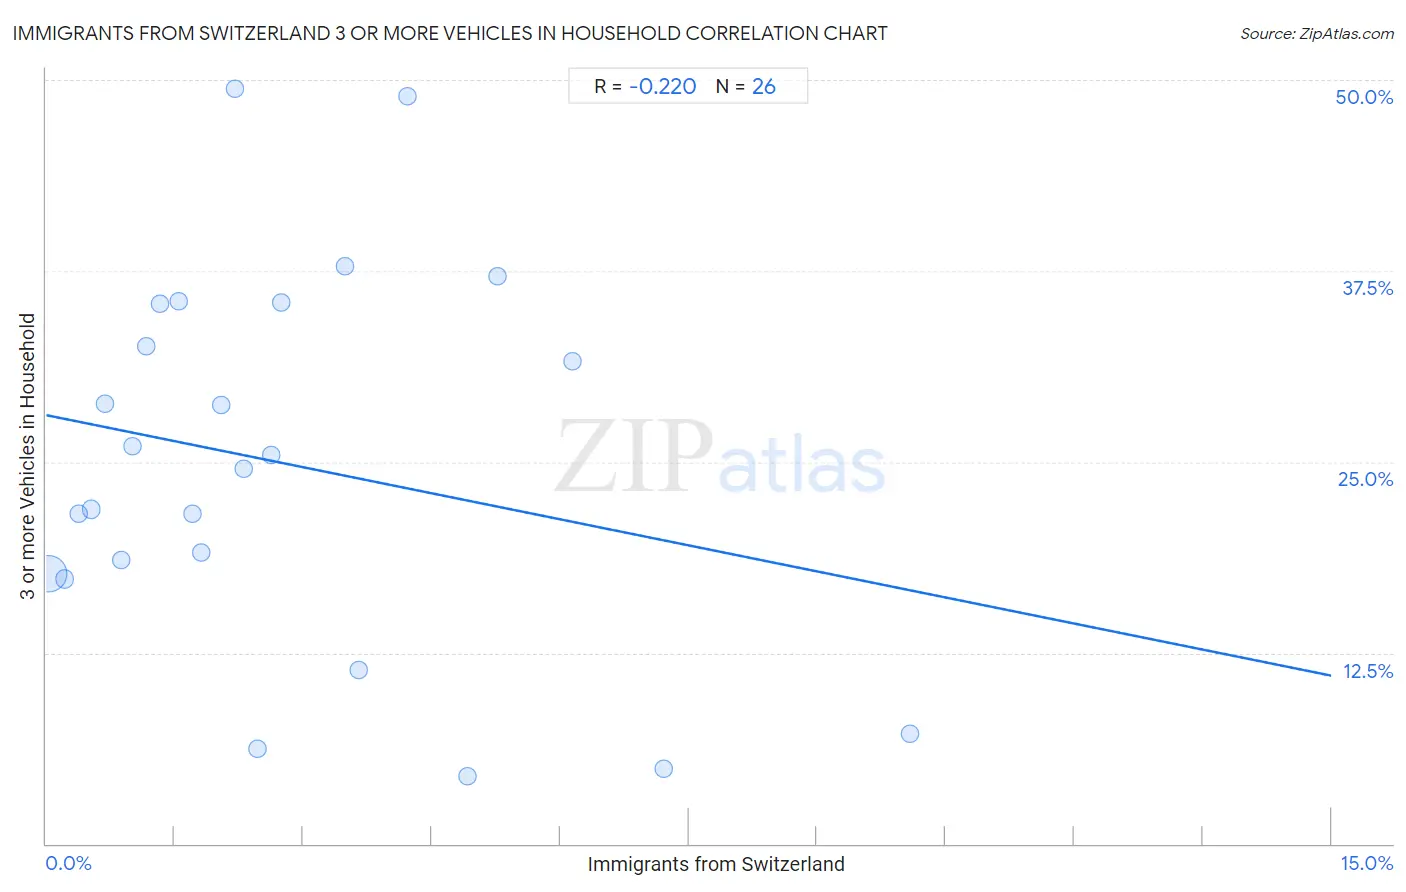
It is essential to understand that the correlation between the percentage of Immigrants from Switzerland and percentage of households with 3 or more vehicles available does not imply a direct cause-and-effect relationship. It remains uncertain whether the presence of Immigrants from Switzerland influences an upward or downward trend in the level of percentage of households with 3 or more vehicles available within an area, or if Immigrants from Switzerland simply ended up residing in those areas with higher or lower levels of percentage of households with 3 or more vehicles available due to other factors.
Demographics Similar to Immigrants from Switzerland by 3 or more Vehicles in Household
In terms of 3 or more vehicles in household, the demographic groups most similar to Immigrants from Switzerland are Immigrants from Western Asia (18.4%, a difference of 0.060%), Immigrants from Belgium (18.4%, a difference of 0.080%), Immigrants from Uganda (18.4%, a difference of 0.14%), Honduran (18.4%, a difference of 0.16%), and Turkish (18.4%, a difference of 0.17%).
| Demographics | Rating | Rank | 3 or more Vehicles in Household |
| Belizeans | 7.3 /100 | #222 | Tragic 18.6% |
| Immigrants from Czechoslovakia | 5.9 /100 | #223 | Tragic 18.5% |
| Immigrants from Argentina | 5.6 /100 | #224 | Tragic 18.5% |
| Immigrants from Lithuania | 5.6 /100 | #225 | Tragic 18.5% |
| Immigrants from Hungary | 5.5 /100 | #226 | Tragic 18.5% |
| Immigrants from Singapore | 5.4 /100 | #227 | Tragic 18.4% |
| Turks | 5.4 /100 | #228 | Tragic 18.4% |
| Immigrants from Switzerland | 5.0 /100 | #229 | Tragic 18.4% |
| Immigrants from Western Asia | 4.8 /100 | #230 | Tragic 18.4% |
| Immigrants from Belgium | 4.8 /100 | #231 | Tragic 18.4% |
| Immigrants from Uganda | 4.6 /100 | #232 | Tragic 18.4% |
| Hondurans | 4.6 /100 | #233 | Tragic 18.4% |
| Immigrants from North Macedonia | 4.4 /100 | #234 | Tragic 18.4% |
| Sierra Leoneans | 3.9 /100 | #235 | Tragic 18.3% |
| Immigrants from Malaysia | 3.6 /100 | #236 | Tragic 18.3% |
Immigrants from Switzerland 3 or more Vehicles in Household Correlation Summary
| Measurement | Immigrants from Switzerland Data | 3 or more Vehicles in Household Data |
| Minimum | 0.033% | 4.4% |
| Maximum | 10.1% | 49.4% |
| Range | 10.1% | 45.1% |
| Mean | 2.7% | 25.0% |
| Median | 2.1% | 25.0% |
| Interquartile 25% (IQ1) | 1.0% | 17.6% |
| Interquartile 75% (IQ3) | 3.6% | 35.3% |
| Interquartile Range (IQR) | 2.6% | 17.7% |
| Standard Deviation (Sample) | 2.4% | 12.4% |
| Standard Deviation (Population) | 2.4% | 12.2% |
Correlation Details
| Immigrants from Switzerland Percentile | Sample Size | 3 or more Vehicles in Household |
[ 0.0% - 0.5% ] 0.033% | 140,537,715 | 17.6% |
[ 0.0% - 0.5% ] 0.21% | 5,749,680 | 17.4% |
[ 0.0% - 0.5% ] 0.38% | 921,488 | 21.6% |
[ 0.5% - 1.0% ] 0.53% | 370,614 | 21.9% |
[ 0.5% - 1.0% ] 0.68% | 181,920 | 28.8% |
[ 0.5% - 1.0% ] 0.87% | 133,785 | 18.6% |
[ 1.0% - 1.5% ] 1.01% | 46,657 | 26.0% |
[ 1.0% - 1.5% ] 1.17% | 31,802 | 32.6% |
[ 1.0% - 1.5% ] 1.32% | 20,314 | 35.3% |
[ 1.5% - 2.0% ] 1.55% | 4,012 | 35.5% |
[ 1.5% - 2.0% ] 1.70% | 2,235 | 21.6% |
[ 1.5% - 2.0% ] 1.81% | 2,598 | 19.1% |
[ 2.0% - 2.5% ] 2.05% | 342 | 28.8% |
[ 2.0% - 2.5% ] 2.21% | 1,132 | 49.4% |
[ 2.0% - 2.5% ] 2.31% | 4,295 | 24.6% |
[ 2.0% - 2.5% ] 2.47% | 5,743 | 6.2% |
[ 2.5% - 3.0% ] 2.63% | 1,559 | 25.5% |
[ 2.5% - 3.0% ] 2.75% | 255 | 35.4% |
[ 3.0% - 3.5% ] 3.49% | 716 | 37.8% |
[ 3.5% - 4.0% ] 3.65% | 521 | 11.4% |
[ 4.0% - 4.5% ] 4.21% | 95 | 48.9% |
[ 4.5% - 5.0% ] 4.91% | 224 | 4.4% |
[ 5.0% - 5.5% ] 5.26% | 2,375 | 37.2% |
[ 6.0% - 6.5% ] 6.14% | 114 | 31.6% |
[ 7.0% - 7.5% ] 7.21% | 319 | 4.9% |
[ 10.0% - 10.5% ] 10.09% | 228 | 7.2% |