Japanese 3 or more Vehicles in Household

COMPARE

Japanese
Race
Ancestry
AfghanAfricanAlaska NativeAlaskan AthabascanAlbanianAleutAlsatianAmericanApacheArabArapahoArgentineanArmenianAssyrian/Chaldean/SyriacAustralianAustrianBahamianBangladeshiBarbadianBasqueBelgianBelizeanBermudanBhutaneseBlackfeetBolivianBrazilianBritishBritish West IndianBulgarianBurmeseCajunCambodianCanadianCape VerdeanCarpatho RusynCelticCentral AmericanCentral American IndianCherokeeCheyenneChickasawChileanChineseChippewaChoctawColombianColvilleComancheCosta RicanCreeCreekCroatianCrowCubanCypriotCzechCzechoslovakianDanishDelawareDominicanDutchDutch West IndianEastern EuropeanEcuadorianEgyptianEnglishEstonianEthiopianEuropeanFijianFilipinoFinnishFrenchFrench American IndianFrench CanadianGermanGerman RussianGhanaianGreekGuamanian/ChamorroGuatemalanGuyaneseHaitianHmongHonduranHopiHoumaHungarianIcelanderIndian (Asian)IndonesianInupiatIranianIraqiIrishIroquoisIsraeliItalianJamaicanJapaneseJordanianKenyanKiowaKoreanLaotianLatvianLebaneseLiberianLithuanianLumbeeLuxembourgerMacedonianMalaysianMalteseMarshalleseMenomineeMexicanMexican American IndianMongolianMoroccanNative HawaiianNavajoNepaleseNew ZealanderNicaraguanNigerianNorthern EuropeanNorwegianOkinawanOsageOttawaPaiutePakistaniPalestinianPanamanianParaguayanPennsylvania GermanPeruvianPimaPolishPortuguesePotawatomiPuebloPuerto RicanPuget Sound SalishRomanianRussianSalvadoranSamoanScandinavianScotch-IrishScottishSeminoleSenegaleseSerbianShoshoneSierra LeoneanSiouxSlavicSlovakSloveneSomaliSouth AfricanSouth AmericanSouth American IndianSoviet UnionSpaniardSpanishSpanish AmericanSpanish American IndianSri LankanSubsaharan AfricanSudaneseSwedishSwissSyrianTaiwaneseThaiTlingit-HaidaTohono O'OdhamTonganTrinidadian and TobagonianTsimshianTurkishU.S. Virgin IslanderUgandanUkrainianUruguayanUteVenezuelanVietnameseWelshWest IndianYakamaYaquiYugoslavianYumanYup'ikZimbabwean
Immigration
NonimmigrantsImmigrantsAfghanistanAfricaAlbaniaArgentinaArmeniaAsiaAustraliaAustriaBahamasBangladeshBarbadosBelarusBelgiumBelizeBoliviaBosnia and HerzegovinaBrazilBulgariaBurma/MyanmarCabo VerdeCambodiaCameroonCanadaCaribbeanCentral AmericaChileChinaColombiaCongoCosta RicaCroatiaCubaCzechoslovakiaDenmarkDominicaDominican RepublicEastern AfricaEastern AsiaEastern EuropeEcuadorEgyptEl SalvadorEnglandEritreaEthiopiaEuropeFijiFranceGermanyGhanaGreeceGrenadaGuatemalaGuyanaHaitiHondurasHong KongHungaryIndiaIndonesiaIranIraqIrelandIsraelItalyJamaicaJapanJordanKazakhstanKenyaKoreaKuwaitLaosLatin AmericaLatviaLebanonLiberiaLithuaniaMalaysiaMexicoMicronesiaMiddle AfricaMoldovaMoroccoNepalNetherlandsNicaraguaNigeriaNorth AmericaNorth MacedoniaNorthern AfricaNorthern EuropeNorwayOceaniaPakistanPanamaPeruPhilippinesPolandPortugalRomaniaRussiaSaudi ArabiaScotlandSenegalSerbiaSierra LeoneSingaporeSomaliaSouth AfricaSouth AmericaSouth Central AsiaSouth Eastern AsiaSouthern EuropeSpainSri LankaSt. Vincent and the GrenadinesSudanSwedenSwitzerlandSyriaTaiwanThailandTrinidad and TobagoTurkeyUgandaUkraineUruguayUzbekistanVenezuelaVietnamWest IndiesWestern AfricaWestern AsiaWestern EuropeYemenZaireZimbabweAzores
Select to Compare
Race
Ancestry
AfghanAfricanAlaska NativeAlaskan AthabascanAlbanianAleutAlsatianAmericanApacheArabArapahoArgentineanArmenianAssyrian/Chaldean/SyriacAustralianAustrianBahamianBangladeshiBarbadianBasqueBelgianBelizeanBermudanBhutaneseBlackfeetBolivianBrazilianBritishBritish West IndianBulgarianBurmeseCajunCambodianCanadianCape VerdeanCarpatho RusynCelticCentral AmericanCentral American IndianCherokeeCheyenneChickasawChileanChineseChippewaChoctawColombianColvilleComancheCosta RicanCreeCreekCroatianCrowCubanCypriotCzechCzechoslovakianDanishDelawareDominicanDutchDutch West IndianEastern EuropeanEcuadorianEgyptianEnglishEstonianEthiopianEuropeanFijianFilipinoFinnishFrenchFrench American IndianFrench CanadianGermanGerman RussianGhanaianGreekGuamanian/ChamorroGuatemalanGuyaneseHaitianHmongHonduranHopiHoumaHungarianIcelanderIndian (Asian)IndonesianInupiatIranianIraqiIrishIroquoisIsraeliItalianJamaicanJordanianKenyanKiowaKoreanLaotianLatvianLebaneseLiberianLithuanianLumbeeLuxembourgerMacedonianMalaysianMalteseMarshalleseMenomineeMexicanMexican American IndianMongolianMoroccanNative HawaiianNavajoNepaleseNew ZealanderNicaraguanNigerianNorthern EuropeanNorwegianOkinawanOsageOttawaPaiutePakistaniPalestinianPanamanianParaguayanPennsylvania GermanPeruvianPimaPolishPortuguesePotawatomiPuebloPuerto RicanPuget Sound SalishRomanianRussianSalvadoranSamoanScandinavianScotch-IrishScottishSeminoleSenegaleseSerbianShoshoneSierra LeoneanSiouxSlavicSlovakSloveneSomaliSouth AfricanSouth AmericanSouth American IndianSoviet UnionSpaniardSpanishSpanish AmericanSpanish American IndianSri LankanSubsaharan AfricanSudaneseSwedishSwissSyrianTaiwaneseThaiTlingit-HaidaTohono O'OdhamTonganTrinidadian and TobagonianTsimshianTurkishU.S. Virgin IslanderUgandanUkrainianUruguayanUteVenezuelanVietnameseWelshWest IndianYakamaYaquiYugoslavianYumanYup'ikZimbabwean
Immigration
NonimmigrantsImmigrantsAfghanistanAfricaAlbaniaArgentinaArmeniaAsiaAustraliaAustriaBahamasBangladeshBarbadosBelarusBelgiumBelizeBoliviaBosnia and HerzegovinaBrazilBulgariaBurma/MyanmarCabo VerdeCambodiaCameroonCanadaCaribbeanCentral AmericaChileChinaColombiaCongoCosta RicaCroatiaCubaCzechoslovakiaDenmarkDominicaDominican RepublicEastern AfricaEastern AsiaEastern EuropeEcuadorEgyptEl SalvadorEnglandEritreaEthiopiaEuropeFijiFranceGermanyGhanaGreeceGrenadaGuatemalaGuyanaHaitiHondurasHong KongHungaryIndiaIndonesiaIranIraqIrelandIsraelItalyJamaicaJapanJordanKazakhstanKenyaKoreaKuwaitLaosLatin AmericaLatviaLebanonLiberiaLithuaniaMalaysiaMexicoMicronesiaMiddle AfricaMoldovaMoroccoNepalNetherlandsNicaraguaNigeriaNorth AmericaNorth MacedoniaNorthern AfricaNorthern EuropeNorwayOceaniaPakistanPanamaPeruPhilippinesPolandPortugalRomaniaRussiaSaudi ArabiaScotlandSenegalSerbiaSierra LeoneSingaporeSomaliaSouth AfricaSouth AmericaSouth Central AsiaSouth Eastern AsiaSouthern EuropeSpainSri LankaSt. Vincent and the GrenadinesSudanSwedenSwitzerlandSyriaTaiwanThailandTrinidad and TobagoTurkeyUgandaUkraineUruguayUzbekistanVenezuelaVietnamWest IndiesWestern AfricaWestern AsiaWestern EuropeYemenZaireZimbabweAzores
3 or more Vehicles in Household
Income
Poverty
Unemployment
Labor Participation
Family Structure
Vehicle Availability
Education Level
Disability

Japanese 3 or more Vehicles in Household
Exceptional

21.8%
3+ VEHICLES AVAILABLE
99.8/ 100
METRIC RATING
75th/ 347
METRIC RANK

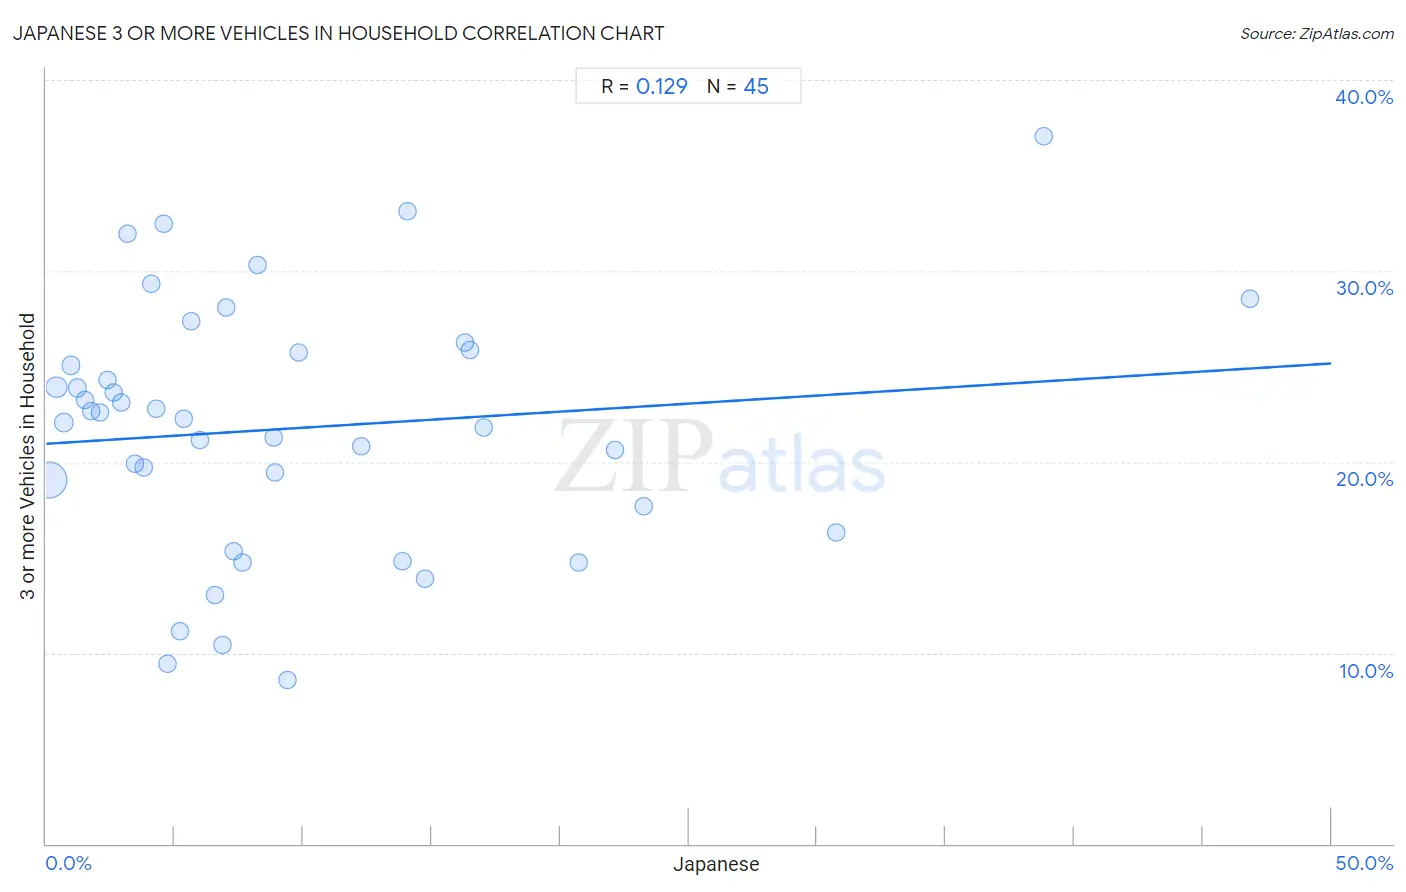
Japanese 3 or more Vehicles in Household Correlation Chart

The statistical analysis conducted on geographies consisting of 249,016,700 people shows a poor positive correlation between the proportion of Japanese and percentage of households with 3 or more vehicles available in the United States with a correlation coefficient (R) of 0.129 and weighted average of 21.8%. On average, for every 1% (one percent) increase in Japanese within a typical geography, there is an increase of 0.084% in percentage of households with 3 or more vehicles available.
Japanese 3 or more Vehicles in Household
It is essential to understand that the correlation between the percentage of Japanese and percentage of households with 3 or more vehicles available does not imply a direct cause-and-effect relationship. It remains uncertain whether the presence of Japanese influences an upward or downward trend in the level of percentage of households with 3 or more vehicles available within an area, or if Japanese simply ended up residing in those areas with higher or lower levels of percentage of households with 3 or more vehicles available due to other factors.

Demographics Similar to Japanese by 3 or more Vehicles in Household

In terms of 3 or more vehicles in household, the demographic groups most similar to Japanese are Nonimmigrants (21.8%, a difference of 0.040%), Immigrants from Oceania (21.8%, a difference of 0.10%), Salvadoran (21.8%, a difference of 0.12%), Irish (21.8%, a difference of 0.12%), and Portuguese (21.8%, a difference of 0.21%).
DemographicsRating | Rank3 or more Vehicles in Household
British
99.9
/100
|
#68
Exceptional
21.9%
Creek
99.9
/100
|
#69
Exceptional
21.9%
Bangladeshis
99.8
/100
|
#70
Exceptional
21.9%
Potawatomi
99.8
/100
|
#71
Exceptional
21.9%
Portuguese
99.8
/100
|
#72
Exceptional
21.8%
Salvadorans
99.8
/100
|
#73
Exceptional
21.8%
Immigrants from Oceania
99.8
/100
|
#74
Exceptional
21.8%
Japanese
99.8
/100
|
#75
Exceptional
21.8%
Nonimmigrants
99.8
/100
|
#76
Exceptional
21.8%
Irish
99.8
/100
|
#77
Exceptional
21.8%
Czechoslovakians
99.8
/100
|
#78
Exceptional
21.7%
Assyrians/Chaldeans/Syriacs
99.8
/100
|
#79
Exceptional
21.7%
Afghans
99.7
/100
|
#80
Exceptional
21.7%
Celtics
99.7
/100
|
#81
Exceptional
21.7%
Immigrants from El Salvador
99.6
/100
|
#82
Exceptional
21.5%

Japanese 3 or more Vehicles in Household Correlation Summary

MeasurementJapanese Data3 or more Vehicles in Household Data
Minimum0.089%8.6%
Maximum46.8%37.0%
Range46.7%28.5%
Mean9.7%21.8%
Median6.5%22.3%
Interquartile 25% (IQ1)3.0%17.0%
Interquartile 75% (IQ3)14.0%25.8%
Interquartile Range (IQR)10.9%8.8%
Standard Deviation (Sample)10.0%6.5%
Standard Deviation (Population)9.9%6.5%

Correlation Details

Japanese PercentileSample Size3 or more Vehicles in Household
[
0.0%
-
0.5%
]
0.089%
191,143,17719.0%
[
0.0%
-
0.5%
]
0.39%
32,036,15923.9%
[
0.5%
-
1.0%
]
0.68%
11,040,41522.0%
[
0.5%
-
1.0%
]
0.95%
5,586,56925.1%
[
1.0%
-
1.5%
]
1.23%
2,870,55223.9%
[
1.5%
-
2.0%
]
1.51%
1,547,92723.2%
[
1.5%
-
2.0%
]
1.77%
1,266,84122.6%
[
2.0%
-
2.5%
]
2.09%
536,96222.6%
[
2.0%
-
2.5%
]
2.37%
401,59624.3%
[
2.5%
-
3.0%
]
2.64%
83,84823.6%
[
2.5%
-
3.0%
]
2.93%
184,19223.1%
[
3.0%
-
3.5%
]
3.15%
208,25632.0%
[
3.0%
-
3.5%
]
3.43%
147,54519.9%
[
3.5%
-
4.0%
]
3.81%
638,20919.7%
[
4.0%
-
4.5%
]
4.08%
60,10729.3%
[
4.0%
-
4.5%
]
4.30%
473,88222.8%
[
4.5%
-
5.0%
]
4.57%
68,00832.5%
[
4.5%
-
5.0%
]
4.73%
74,6959.4%
[
5.0%
-
5.5%
]
5.21%
41,24011.1%
[
5.0%
-
5.5%
]
5.34%
4,21122.3%
[
5.5%
-
6.0%
]
5.64%
104,25127.4%
[
5.5%
-
6.0%
]
5.96%
70,81821.1%
[
6.5%
-
7.0%
]
6.54%
65,60813.0%
[
6.5%
-
7.0%
]
6.83%
27810.4%
[
6.5%
-
7.0%
]
6.99%
41,00128.1%
[
7.0%
-
7.5%
]
7.29%
64515.3%
[
7.5%
-
8.0%
]
7.63%
59,15314.7%
[
8.0%
-
8.5%
]
8.23%
4,14530.3%
[
8.5%
-
9.0%
]
8.84%
12,32421.3%
[
8.5%
-
9.0%
]
8.91%
11,67819.4%
[
9.0%
-
9.5%
]
9.38%
2,9118.6%
[
9.5%
-
10.0%
]
9.81%
59,46025.7%
[
12.0%
-
12.5%
]
12.25%
2,58820.8%
[
13.5%
-
14.0%
]
13.86%
114,73714.8%
[
14.0%
-
14.5%
]
14.08%
1,36433.2%
[
14.5%
-
15.0%
]
14.72%
2,21513.9%
[
16.0%
-
16.5%
]
16.30%
41126.2%
[
16.0%
-
16.5%
]
16.47%
86825.9%
[
17.0%
-
17.5%
]
17.03%
7,11821.8%
[
20.5%
-
21.0%
]
20.70%
1,57514.7%
[
22.0%
-
22.5%
]
22.12%
5,47820.6%
[
23.0%
-
23.5%
]
23.24%
92117.7%
[
30.5%
-
31.0%
]
30.73%
32,32316.3%
[
38.5%
-
39.0%
]
38.81%
21937.0%
[
46.5%
-
47.0%
]
46.82%
22028.6%