Tlingit-Haida vs Immigrants from Cambodia 3 or more Vehicles in Household
COMPARE
Tlingit-Haida
Immigrants from Cambodia
3 or more Vehicles in Household
3 or more Vehicles in Household Comparison
Tlingit-Haida
Immigrants from Cambodia
19.9%
3 OR MORE VEHICLES IN HOUSEHOLD
73.4/ 100
METRIC RATING
155th/ 347
METRIC RANK
21.1%
3 OR MORE VEHICLES IN HOUSEHOLD
98.6/ 100
METRIC RATING
94th/ 347
METRIC RANK
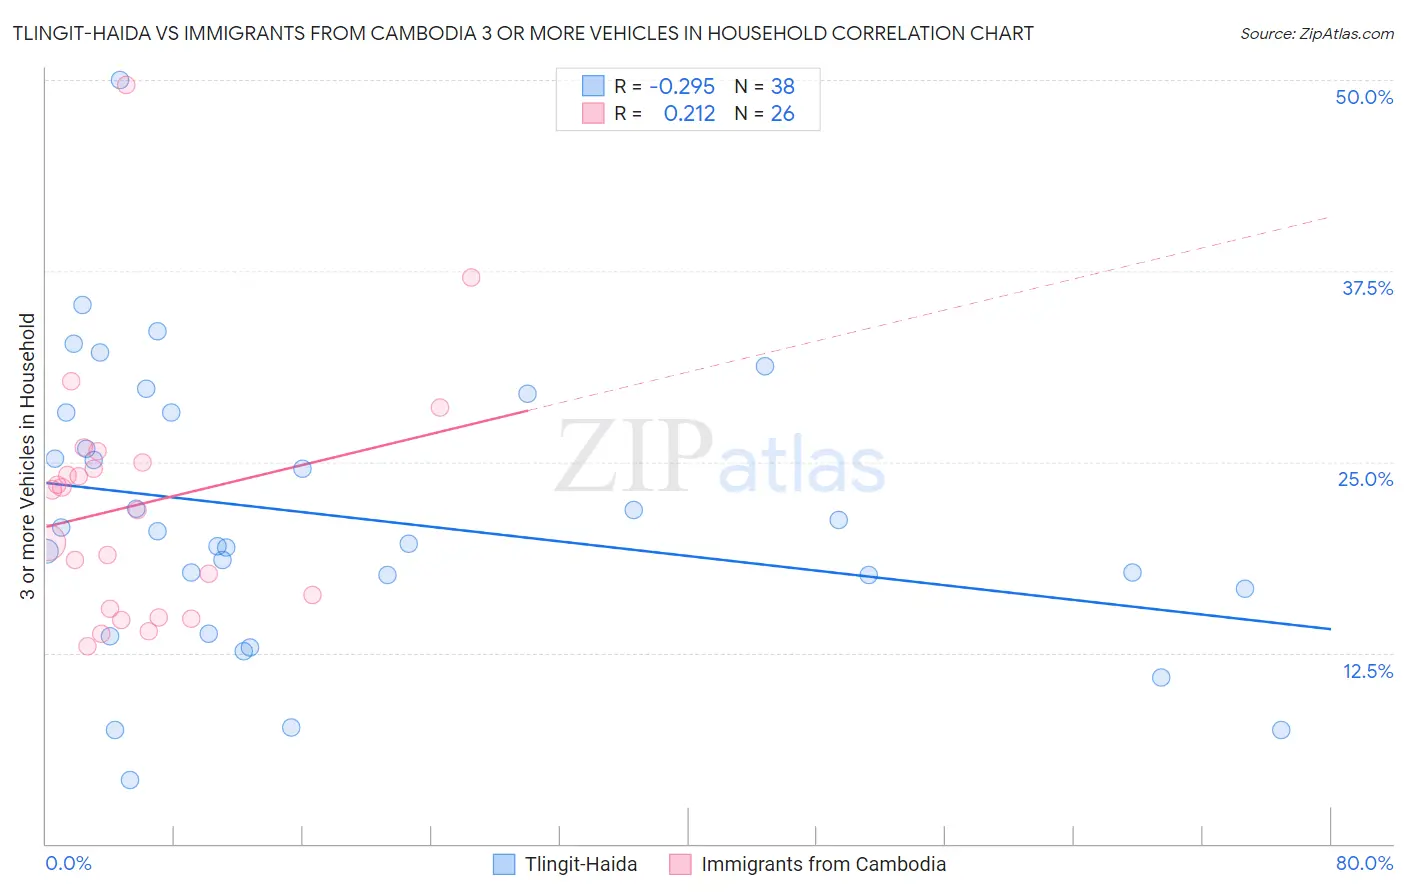
Tlingit-Haida vs Immigrants from Cambodia 3 or more Vehicles in Household Correlation Chart
The statistical analysis conducted on geographies consisting of 60,850,573 people shows a weak negative correlation between the proportion of Tlingit-Haida and percentage of households with 3 or more vehicles available in the United States with a correlation coefficient (R) of -0.295 and weighted average of 19.9%. Similarly, the statistical analysis conducted on geographies consisting of 205,124,978 people shows a weak positive correlation between the proportion of Immigrants from Cambodia and percentage of households with 3 or more vehicles available in the United States with a correlation coefficient (R) of 0.212 and weighted average of 21.1%, a difference of 6.0%.
3 or more Vehicles in Household Correlation Summary
| Measurement | Tlingit-Haida | Immigrants from Cambodia |
| Minimum | 4.2% | 13.0% |
| Maximum | 50.0% | 49.7% |
| Range | 45.8% | 36.7% |
| Mean | 21.4% | 22.2% |
| Median | 20.0% | 22.5% |
| Interquartile 25% (IQ1) | 16.7% | 15.4% |
| Interquartile 75% (IQ3) | 28.2% | 25.0% |
| Interquartile Range (IQR) | 11.5% | 9.6% |
| Standard Deviation (Sample) | 9.2% | 8.1% |
| Standard Deviation (Population) | 9.1% | 8.0% |
Similar Demographics by 3 or more Vehicles in Household
Demographics Similar to Tlingit-Haida by 3 or more Vehicles in Household
In terms of 3 or more vehicles in household, the demographic groups most similar to Tlingit-Haida are Immigrants from Jordan (19.9%, a difference of 0.15%), Thai (19.8%, a difference of 0.21%), Yuman (19.9%, a difference of 0.22%), Hungarian (19.8%, a difference of 0.26%), and Armenian (19.8%, a difference of 0.42%).
| Demographics | Rating | Rank | 3 or more Vehicles in Household |
| Guatemalans | 82.6 /100 | #148 | Excellent 20.1% |
| Immigrants | Iran | 80.9 /100 | #149 | Excellent 20.0% |
| Immigrants | Immigrants | 80.8 /100 | #150 | Excellent 20.0% |
| Taiwanese | 80.6 /100 | #151 | Excellent 20.0% |
| Lebanese | 79.8 /100 | #152 | Good 20.0% |
| Yuman | 75.6 /100 | #153 | Good 19.9% |
| Immigrants | Jordan | 75.0 /100 | #154 | Good 19.9% |
| Tlingit-Haida | 73.4 /100 | #155 | Good 19.9% |
| Thais | 71.1 /100 | #156 | Good 19.8% |
| Hungarians | 70.5 /100 | #157 | Good 19.8% |
| Armenians | 68.8 /100 | #158 | Good 19.8% |
| Immigrants | Pakistan | 68.2 /100 | #159 | Good 19.8% |
| Immigrants | Lebanon | 67.6 /100 | #160 | Good 19.8% |
| Immigrants | Guatemala | 65.6 /100 | #161 | Good 19.7% |
| Estonians | 63.2 /100 | #162 | Good 19.7% |
Demographics Similar to Immigrants from Cambodia by 3 or more Vehicles in Household
In terms of 3 or more vehicles in household, the demographic groups most similar to Immigrants from Cambodia are Pakistani (21.0%, a difference of 0.14%), Immigrants from Indonesia (21.1%, a difference of 0.23%), Cree (21.0%, a difference of 0.23%), Canadian (21.0%, a difference of 0.34%), and Hmong (21.0%, a difference of 0.40%).
| Demographics | Rating | Rank | 3 or more Vehicles in Household |
| Immigrants | Azores | 99.5 /100 | #87 | Exceptional 21.5% |
| French | 99.4 /100 | #88 | Exceptional 21.4% |
| Marshallese | 99.2 /100 | #89 | Exceptional 21.3% |
| Immigrants | Afghanistan | 99.1 /100 | #90 | Exceptional 21.2% |
| Belgians | 98.9 /100 | #91 | Exceptional 21.2% |
| Apache | 98.9 /100 | #92 | Exceptional 21.2% |
| Immigrants | Indonesia | 98.8 /100 | #93 | Exceptional 21.1% |
| Immigrants | Cambodia | 98.6 /100 | #94 | Exceptional 21.1% |
| Pakistanis | 98.5 /100 | #95 | Exceptional 21.0% |
| Cree | 98.4 /100 | #96 | Exceptional 21.0% |
| Canadians | 98.3 /100 | #97 | Exceptional 21.0% |
| Hmong | 98.2 /100 | #98 | Exceptional 21.0% |
| Alaska Natives | 98.2 /100 | #99 | Exceptional 21.0% |
| Comanche | 98.2 /100 | #100 | Exceptional 21.0% |
| Blackfeet | 97.9 /100 | #101 | Exceptional 20.9% |