Immigrants from Belize 3 or more Vehicles in Household
COMPARE
Immigrants from Belize
Select to Compare
3 or more Vehicles in Household
Immigrants from Belize 3 or more Vehicles in Household
18.1%
3+ VEHICLES AVAILABLE
2.1/ 100
METRIC RATING
245th/ 347
METRIC RANK
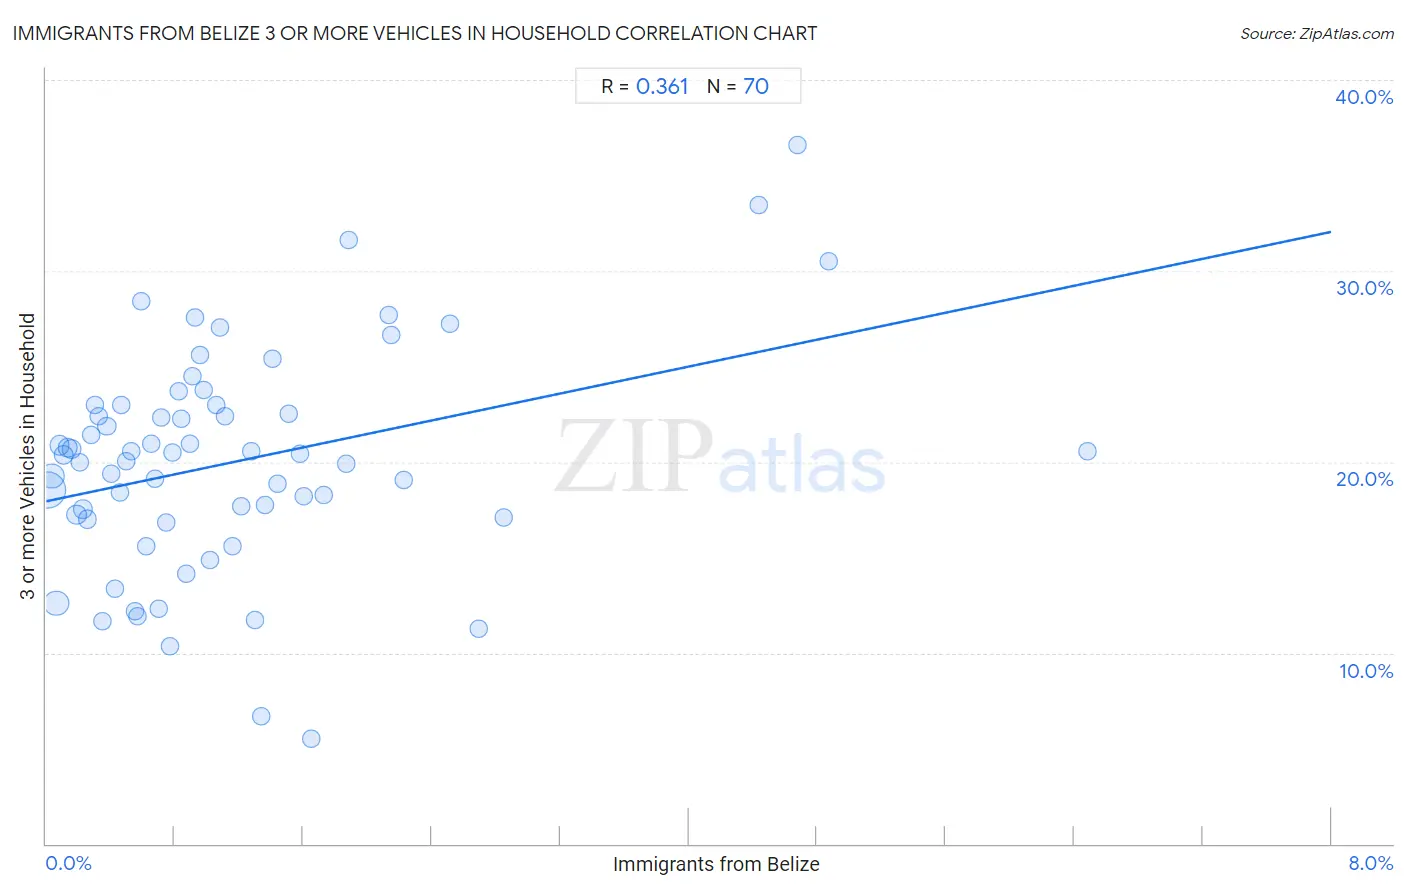
Immigrants from Belize 3 or more Vehicles in Household Correlation Chart
The statistical analysis conducted on geographies consisting of 130,289,749 people shows a mild positive correlation between the proportion of Immigrants from Belize and percentage of households with 3 or more vehicles available in the United States with a correlation coefficient (R) of 0.361 and weighted average of 18.1%. On average, for every 1% (one percent) increase in Immigrants from Belize within a typical geography, there is an increase of 1.8% in percentage of households with 3 or more vehicles available.
It is essential to understand that the correlation between the percentage of Immigrants from Belize and percentage of households with 3 or more vehicles available does not imply a direct cause-and-effect relationship. It remains uncertain whether the presence of Immigrants from Belize influences an upward or downward trend in the level of percentage of households with 3 or more vehicles available within an area, or if Immigrants from Belize simply ended up residing in those areas with higher or lower levels of percentage of households with 3 or more vehicles available due to other factors.
Demographics Similar to Immigrants from Belize by 3 or more Vehicles in Household
In terms of 3 or more vehicles in household, the demographic groups most similar to Immigrants from Belize are Immigrants from Australia (18.1%, a difference of 0.070%), Mongolian (18.1%, a difference of 0.16%), Carpatho Rusyn (18.0%, a difference of 0.23%), Immigrants from Europe (18.1%, a difference of 0.28%), and Immigrants from Eastern Africa (18.0%, a difference of 0.36%).
| Demographics | Rating | Rank | 3 or more Vehicles in Household |
| Immigrants from Honduras | 3.1 /100 | #238 | Tragic 18.2% |
| Immigrants from Middle Africa | 3.1 /100 | #239 | Tragic 18.2% |
| Immigrants from China | 2.9 /100 | #240 | Tragic 18.2% |
| Africans | 2.7 /100 | #241 | Tragic 18.2% |
| Hopi | 2.5 /100 | #242 | Tragic 18.2% |
| Immigrants from Europe | 2.4 /100 | #243 | Tragic 18.1% |
| Mongolians | 2.3 /100 | #244 | Tragic 18.1% |
| Immigrants from Belize | 2.1 /100 | #245 | Tragic 18.1% |
| Immigrants from Australia | 2.0 /100 | #246 | Tragic 18.1% |
| Carpatho Rusyns | 1.9 /100 | #247 | Tragic 18.0% |
| Immigrants from Eastern Africa | 1.8 /100 | #248 | Tragic 18.0% |
| Immigrants from Saudi Arabia | 1.7 /100 | #249 | Tragic 18.0% |
| Venezuelans | 1.7 /100 | #250 | Tragic 18.0% |
| Alsatians | 1.5 /100 | #251 | Tragic 18.0% |
| Immigrants from Southern Europe | 1.4 /100 | #252 | Tragic 17.9% |
Immigrants from Belize 3 or more Vehicles in Household Correlation Summary
| Measurement | Immigrants from Belize Data | 3 or more Vehicles in Household Data |
| Minimum | 0.011% | 5.5% |
| Maximum | 6.5% | 36.6% |
| Range | 6.5% | 31.1% |
| Mean | 1.2% | 20.0% |
| Median | 0.86% | 20.4% |
| Interquartile 25% (IQ1) | 0.43% | 17.1% |
| Interquartile 75% (IQ3) | 1.4% | 23.0% |
| Interquartile Range (IQR) | 1.0% | 5.9% |
| Standard Deviation (Sample) | 1.2% | 5.8% |
| Standard Deviation (Population) | 1.2% | 5.8% |
Correlation Details
| Immigrants from Belize Percentile | Sample Size | 3 or more Vehicles in Household |
[ 0.0% - 0.5% ] 0.011% | 58,250,841 | 18.5% |
[ 0.0% - 0.5% ] 0.035% | 20,402,607 | 19.3% |
[ 0.0% - 0.5% ] 0.065% | 22,713,365 | 12.6% |
[ 0.0% - 0.5% ] 0.083% | 6,310,489 | 20.9% |
[ 0.0% - 0.5% ] 0.11% | 4,556,487 | 20.3% |
[ 0.0% - 0.5% ] 0.13% | 2,585,215 | 20.7% |
[ 0.0% - 0.5% ] 0.16% | 2,157,932 | 20.7% |
[ 0.0% - 0.5% ] 0.19% | 5,795,240 | 17.2% |
[ 0.0% - 0.5% ] 0.21% | 924,855 | 20.0% |
[ 0.0% - 0.5% ] 0.23% | 1,458,905 | 17.5% |
[ 0.0% - 0.5% ] 0.26% | 784,121 | 17.0% |
[ 0.0% - 0.5% ] 0.28% | 572,760 | 21.4% |
[ 0.0% - 0.5% ] 0.30% | 327,497 | 23.0% |
[ 0.0% - 0.5% ] 0.33% | 209,681 | 22.4% |
[ 0.0% - 0.5% ] 0.35% | 319,338 | 11.7% |
[ 0.0% - 0.5% ] 0.38% | 285,795 | 21.8% |
[ 0.0% - 0.5% ] 0.40% | 197,134 | 19.4% |
[ 0.0% - 0.5% ] 0.43% | 220,464 | 13.4% |
[ 0.0% - 0.5% ] 0.46% | 204,607 | 18.4% |
[ 0.0% - 0.5% ] 0.47% | 24,715 | 23.0% |
[ 0.0% - 0.5% ] 0.50% | 140,660 | 20.0% |
[ 0.5% - 1.0% ] 0.53% | 135,291 | 20.6% |
[ 0.5% - 1.0% ] 0.55% | 144,361 | 12.2% |
[ 0.5% - 1.0% ] 0.57% | 141,964 | 11.9% |
[ 0.5% - 1.0% ] 0.60% | 1,176 | 28.4% |
[ 0.5% - 1.0% ] 0.62% | 165,594 | 15.6% |
[ 0.5% - 1.0% ] 0.65% | 93,547 | 20.9% |
[ 0.5% - 1.0% ] 0.67% | 3,267 | 19.1% |
[ 0.5% - 1.0% ] 0.70% | 27,353 | 12.3% |
[ 0.5% - 1.0% ] 0.72% | 59,159 | 22.3% |
[ 0.5% - 1.0% ] 0.74% | 30,784 | 16.8% |
[ 0.5% - 1.0% ] 0.77% | 42,343 | 10.3% |
[ 0.5% - 1.0% ] 0.79% | 59,697 | 20.5% |
[ 0.5% - 1.0% ] 0.82% | 78,930 | 23.7% |
[ 0.5% - 1.0% ] 0.84% | 89,435 | 22.3% |
[ 0.5% - 1.0% ] 0.87% | 11,824 | 14.2% |
[ 0.5% - 1.0% ] 0.89% | 117,043 | 20.9% |
[ 0.5% - 1.0% ] 0.91% | 66,333 | 24.5% |
[ 0.5% - 1.0% ] 0.93% | 42,990 | 27.5% |
[ 0.5% - 1.0% ] 0.95% | 5,765 | 25.6% |
[ 0.5% - 1.0% ] 0.98% | 6,710 | 23.7% |
[ 1.0% - 1.5% ] 1.02% | 1,278 | 14.8% |
[ 1.0% - 1.5% ] 1.06% | 110,279 | 23.0% |
[ 1.0% - 1.5% ] 1.08% | 7,585 | 27.1% |
[ 1.0% - 1.5% ] 1.11% | 69,064 | 22.4% |
[ 1.0% - 1.5% ] 1.16% | 47,309 | 15.6% |
[ 1.0% - 1.5% ] 1.21% | 5,200 | 17.7% |
[ 1.0% - 1.5% ] 1.27% | 13,022 | 20.6% |
[ 1.0% - 1.5% ] 1.30% | 13,698 | 11.7% |
[ 1.0% - 1.5% ] 1.34% | 13,910 | 6.7% |
[ 1.0% - 1.5% ] 1.36% | 15,380 | 17.7% |
[ 1.0% - 1.5% ] 1.41% | 11,453 | 25.4% |
[ 1.0% - 1.5% ] 1.44% | 14,679 | 18.9% |
[ 1.5% - 2.0% ] 1.51% | 861 | 22.5% |
[ 1.5% - 2.0% ] 1.58% | 49,898 | 20.4% |
[ 1.5% - 2.0% ] 1.60% | 8,225 | 18.2% |
[ 1.5% - 2.0% ] 1.65% | 15,132 | 5.5% |
[ 1.5% - 2.0% ] 1.73% | 29,307 | 18.3% |
[ 1.5% - 2.0% ] 1.87% | 44,461 | 19.9% |
[ 1.5% - 2.0% ] 1.88% | 1,489 | 31.6% |
[ 2.0% - 2.5% ] 2.13% | 2,582 | 27.7% |
[ 2.0% - 2.5% ] 2.15% | 8,134 | 26.6% |
[ 2.0% - 2.5% ] 2.23% | 1,033 | 19.1% |
[ 2.5% - 3.0% ] 2.51% | 33,528 | 27.2% |
[ 2.5% - 3.0% ] 2.70% | 408 | 11.3% |
[ 2.5% - 3.0% ] 2.85% | 1,932 | 17.1% |
[ 4.0% - 4.5% ] 4.44% | 834 | 33.4% |
[ 4.5% - 5.0% ] 4.68% | 770 | 36.6% |
[ 4.5% - 5.0% ] 4.87% | 1,129 | 30.5% |
[ 6.0% - 6.5% ] 6.48% | 895 | 20.6% |