Immigrants from South Eastern Asia 3 or more Vehicles in Household
COMPARE
Immigrants from South Eastern Asia
Select to Compare
3 or more Vehicles in Household
Immigrants from South Eastern Asia 3 or more Vehicles in Household
23.1%
3+ VEHICLES AVAILABLE
100.0/ 100
METRIC RATING
30th/ 347
METRIC RANK
Immigrants from South Eastern Asia 3 or more Vehicles in Household Correlation Chart
The statistical analysis conducted on geographies consisting of 512,036,207 people shows a mild positive correlation between the proportion of Immigrants from South Eastern Asia and percentage of households with 3 or more vehicles available in the United States with a correlation coefficient (R) of 0.355 and weighted average of 23.1%. On average, for every 1% (one percent) increase in Immigrants from South Eastern Asia within a typical geography, there is an increase of 0.25% in percentage of households with 3 or more vehicles available.
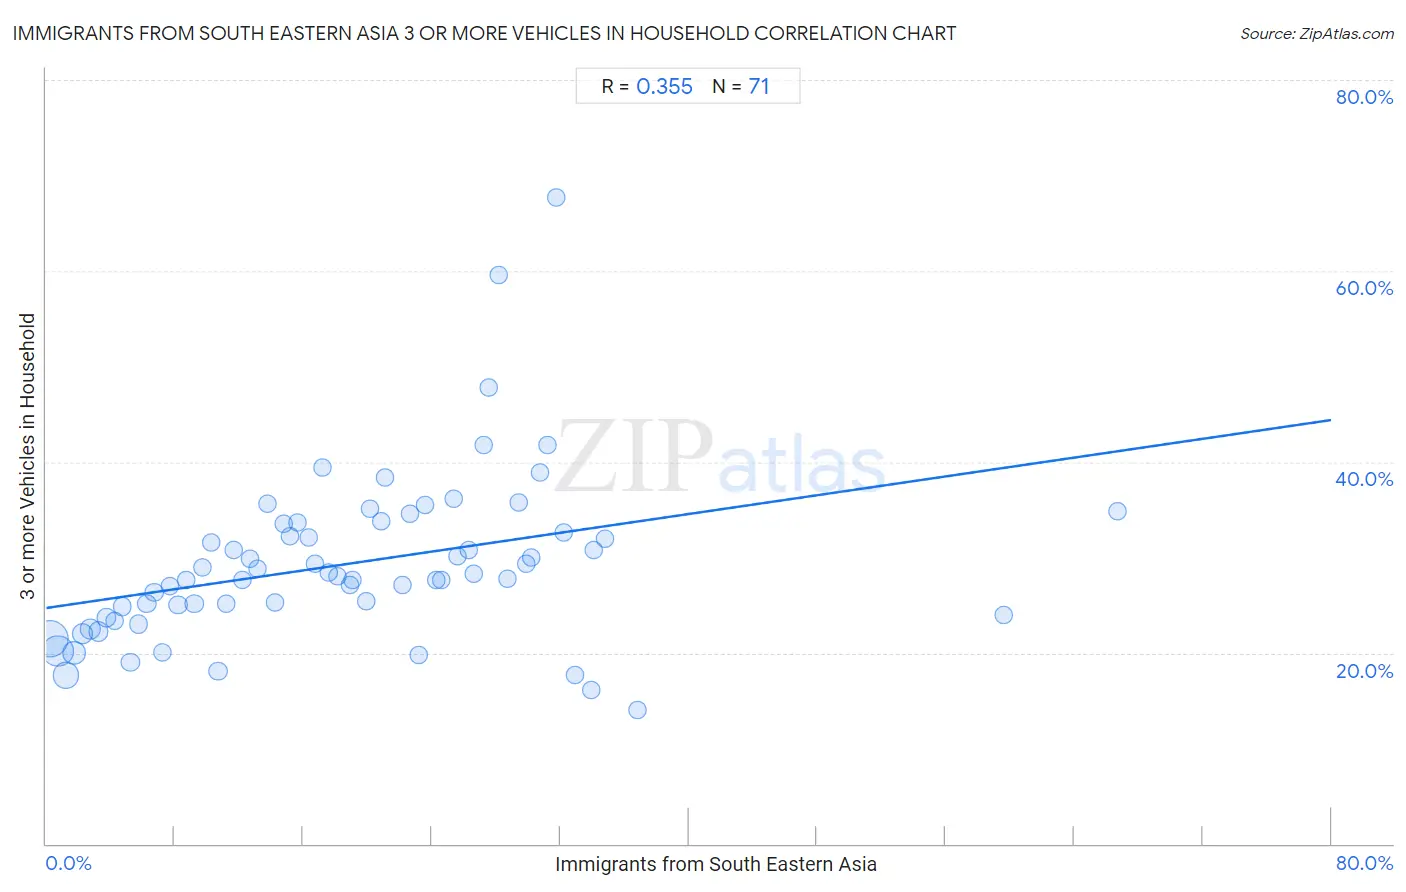
It is essential to understand that the correlation between the percentage of Immigrants from South Eastern Asia and percentage of households with 3 or more vehicles available does not imply a direct cause-and-effect relationship. It remains uncertain whether the presence of Immigrants from South Eastern Asia influences an upward or downward trend in the level of percentage of households with 3 or more vehicles available within an area, or if Immigrants from South Eastern Asia simply ended up residing in those areas with higher or lower levels of percentage of households with 3 or more vehicles available due to other factors.
Demographics Similar to Immigrants from South Eastern Asia by 3 or more Vehicles in Household
In terms of 3 or more vehicles in household, the demographic groups most similar to Immigrants from South Eastern Asia are Spanish (23.1%, a difference of 0.17%), English (23.1%, a difference of 0.19%), Lumbee (23.1%, a difference of 0.24%), Pueblo (23.0%, a difference of 0.28%), and Spanish American (23.0%, a difference of 0.34%).
| Demographics | Rating | Rank | 3 or more Vehicles in Household |
| Scandinavians | 100.0 /100 | #23 | Exceptional 23.6% |
| Sri Lankans | 100.0 /100 | #24 | Exceptional 23.6% |
| Immigrants from Central America | 100.0 /100 | #25 | Exceptional 23.4% |
| Mexican American Indians | 100.0 /100 | #26 | Exceptional 23.3% |
| Guamanians/Chamorros | 100.0 /100 | #27 | Exceptional 23.2% |
| Lumbee | 100.0 /100 | #28 | Exceptional 23.1% |
| Spanish | 100.0 /100 | #29 | Exceptional 23.1% |
| Immigrants from South Eastern Asia | 100.0 /100 | #30 | Exceptional 23.1% |
| English | 100.0 /100 | #31 | Exceptional 23.1% |
| Pueblo | 100.0 /100 | #32 | Exceptional 23.0% |
| Spanish Americans | 100.0 /100 | #33 | Exceptional 23.0% |
| Swiss | 100.0 /100 | #34 | Exceptional 23.0% |
| Choctaw | 100.0 /100 | #35 | Exceptional 23.0% |
| Cherokee | 100.0 /100 | #36 | Exceptional 23.0% |
| Swedes | 100.0 /100 | #37 | Exceptional 23.0% |
Immigrants from South Eastern Asia 3 or more Vehicles in Household Correlation Summary
| Measurement | Immigrants from South Eastern Asia Data | 3 or more Vehicles in Household Data |
| Minimum | 0.25% | 14.1% |
| Maximum | 66.7% | 67.7% |
| Range | 66.4% | 53.6% |
| Mean | 18.8% | 29.3% |
| Median | 17.6% | 28.1% |
| Interquartile 25% (IQ1) | 8.7% | 24.0% |
| Interquartile 75% (IQ3) | 27.2% | 33.5% |
| Interquartile Range (IQR) | 18.5% | 9.5% |
| Standard Deviation (Sample) | 12.7% | 8.8% |
| Standard Deviation (Population) | 12.6% | 8.8% |
Correlation Details
| Immigrants from South Eastern Asia Percentile | Sample Size | 3 or more Vehicles in Household |
[ 0.0% - 0.5% ] 0.25% | 171,188,226 | 21.4% |
[ 0.5% - 1.0% ] 0.73% | 118,596,156 | 20.2% |
[ 1.0% - 1.5% ] 1.23% | 74,031,018 | 17.7% |
[ 1.5% - 2.0% ] 1.73% | 39,078,864 | 20.0% |
[ 2.0% - 2.5% ] 2.22% | 23,515,316 | 22.1% |
[ 2.5% - 3.0% ] 2.75% | 17,152,816 | 22.5% |
[ 3.0% - 3.5% ] 3.24% | 17,005,591 | 22.2% |
[ 3.5% - 4.0% ] 3.74% | 8,421,174 | 23.7% |
[ 4.0% - 4.5% ] 4.25% | 6,833,414 | 23.3% |
[ 4.5% - 5.0% ] 4.73% | 5,116,393 | 24.8% |
[ 5.0% - 5.5% ] 5.23% | 4,125,506 | 19.0% |
[ 5.5% - 6.0% ] 5.75% | 4,627,058 | 23.0% |
[ 6.0% - 6.5% ] 6.26% | 1,947,461 | 25.1% |
[ 6.5% - 7.0% ] 6.72% | 3,118,475 | 26.3% |
[ 7.0% - 7.5% ] 7.25% | 1,596,127 | 20.0% |
[ 7.5% - 8.0% ] 7.70% | 2,459,238 | 27.0% |
[ 8.0% - 8.5% ] 8.20% | 1,548,255 | 25.0% |
[ 8.5% - 9.0% ] 8.75% | 734,319 | 27.6% |
[ 9.0% - 9.5% ] 9.22% | 1,073,656 | 25.1% |
[ 9.5% - 10.0% ] 9.72% | 1,331,437 | 28.9% |
[ 10.0% - 10.5% ] 10.30% | 483,883 | 31.6% |
[ 10.5% - 11.0% ] 10.70% | 1,129,216 | 18.1% |
[ 11.0% - 11.5% ] 11.19% | 682,714 | 25.1% |
[ 11.5% - 12.0% ] 11.68% | 466,497 | 30.8% |
[ 12.0% - 12.5% ] 12.21% | 1,339,327 | 27.6% |
[ 12.5% - 13.0% ] 12.71% | 391,071 | 29.9% |
[ 13.0% - 13.5% ] 13.14% | 170,053 | 28.9% |
[ 13.5% - 14.0% ] 13.74% | 419,626 | 35.6% |
[ 14.0% - 14.5% ] 14.24% | 54,501 | 25.3% |
[ 14.5% - 15.0% ] 14.82% | 366,557 | 33.5% |
[ 15.0% - 15.5% ] 15.19% | 296,699 | 32.2% |
[ 15.5% - 16.0% ] 15.67% | 69,178 | 33.6% |
[ 16.0% - 16.5% ] 16.36% | 380,860 | 32.0% |
[ 16.5% - 17.0% ] 16.75% | 343,907 | 29.3% |
[ 17.0% - 17.5% ] 17.20% | 72,954 | 39.4% |
[ 17.5% - 18.0% ] 17.57% | 40,056 | 28.4% |
[ 18.0% - 18.5% ] 18.16% | 1,035 | 28.1% |
[ 18.5% - 19.0% ] 18.91% | 101,316 | 27.1% |
[ 19.0% - 19.5% ] 19.06% | 81,330 | 27.6% |
[ 19.5% - 20.0% ] 19.90% | 14,597 | 25.4% |
[ 20.0% - 20.5% ] 20.18% | 3,003 | 35.1% |
[ 20.5% - 21.0% ] 20.83% | 115,162 | 33.8% |
[ 21.0% - 21.5% ] 21.10% | 84,817 | 38.3% |
[ 22.0% - 22.5% ] 22.20% | 140,816 | 27.1% |
[ 22.5% - 23.0% ] 22.65% | 106,065 | 34.6% |
[ 23.0% - 23.5% ] 23.16% | 3,800 | 19.8% |
[ 23.5% - 24.0% ] 23.62% | 110,453 | 35.5% |
[ 24.0% - 24.5% ] 24.26% | 164,096 | 27.6% |
[ 24.5% - 25.0% ] 24.61% | 65,345 | 27.6% |
[ 25.0% - 25.5% ] 25.36% | 213,963 | 36.1% |
[ 25.5% - 26.0% ] 25.62% | 25,902 | 30.1% |
[ 26.0% - 26.5% ] 26.34% | 52,974 | 30.8% |
[ 26.5% - 27.0% ] 26.65% | 72,605 | 28.3% |
[ 27.0% - 27.5% ] 27.24% | 16,457 | 41.8% |
[ 27.5% - 28.0% ] 27.55% | 49,074 | 47.7% |
[ 28.0% - 28.5% ] 28.18% | 401 | 59.6% |
[ 28.5% - 29.0% ] 28.71% | 996 | 27.8% |
[ 29.0% - 29.5% ] 29.40% | 40,993 | 35.7% |
[ 29.5% - 30.0% ] 29.88% | 17,533 | 29.4% |
[ 30.0% - 30.5% ] 30.16% | 63 | 30.0% |
[ 30.5% - 31.0% ] 30.72% | 47,549 | 38.9% |
[ 31.0% - 31.5% ] 31.24% | 36,657 | 41.8% |
[ 31.5% - 32.0% ] 31.78% | 236 | 67.7% |
[ 32.0% - 32.5% ] 32.23% | 181,268 | 32.6% |
[ 32.5% - 33.0% ] 32.90% | 921 | 17.7% |
[ 33.5% - 34.0% ] 33.96% | 9,160 | 16.1% |
[ 34.0% - 34.5% ] 34.06% | 22,622 | 30.8% |
[ 34.5% - 35.0% ] 34.76% | 39,873 | 31.9% |
[ 36.5% - 37.0% ] 36.78% | 4,342 | 14.1% |
[ 59.5% - 60.0% ] 59.57% | 188 | 24.0% |
[ 66.5% - 67.0% ] 66.69% | 2,996 | 34.8% |