Tlingit-Haida GED/Equivalency
COMPARE
Tlingit-Haida
Select to Compare
GED/Equivalency
Tlingit-Haida GED/Equivalency
87.0%
GED/EQUIVALENCY
94.8/ 100
METRIC RATING
112th/ 347
METRIC RANK
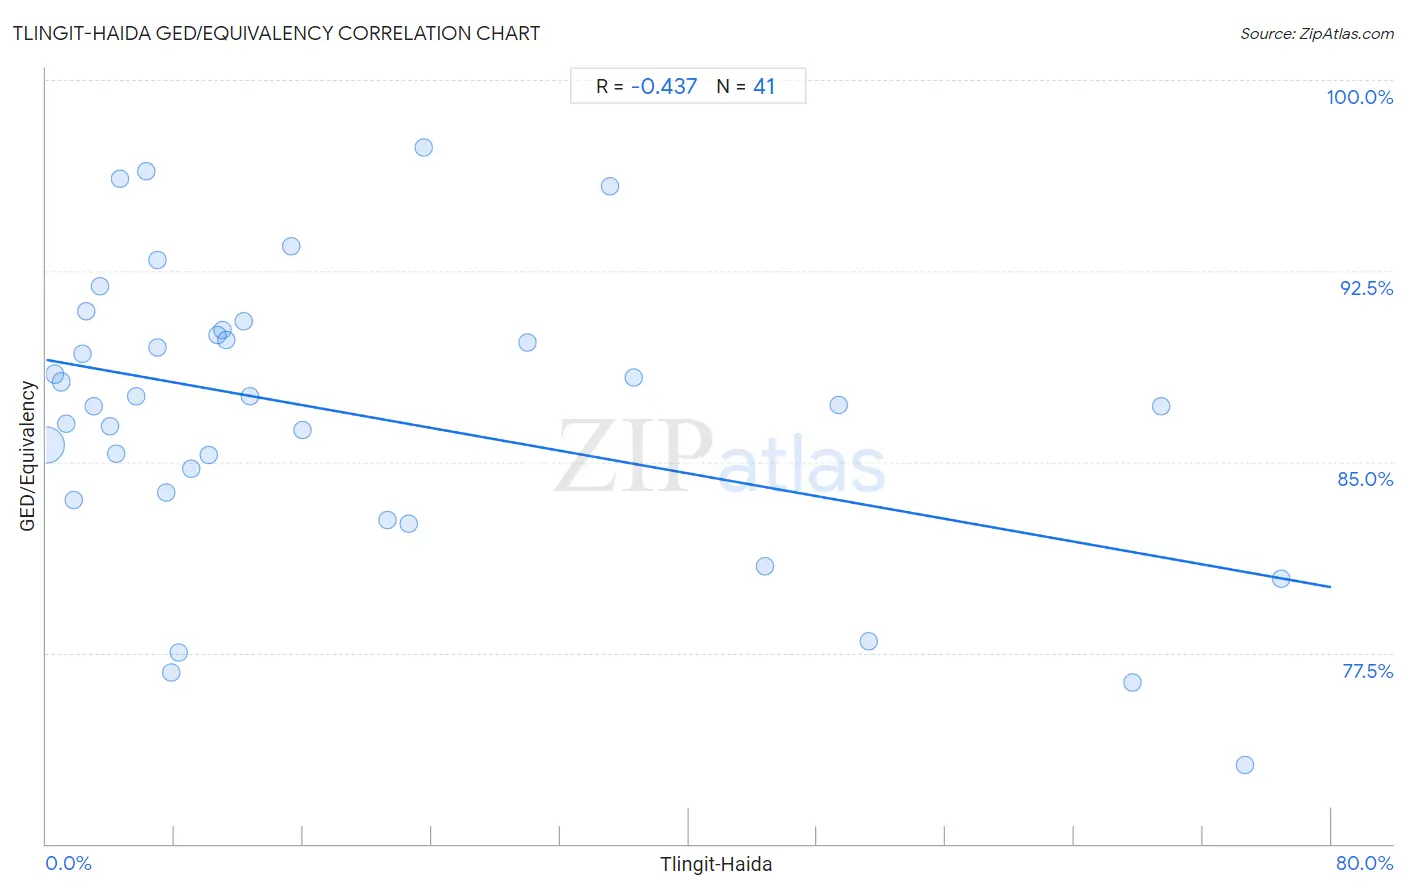
Tlingit-Haida GED/Equivalency Correlation Chart
The statistical analysis conducted on geographies consisting of 60,871,919 people shows a moderate negative correlation between the proportion of Tlingit-Haida and percentage of population with at least ged/equivalency education in the United States with a correlation coefficient (R) of -0.437 and weighted average of 87.0%. On average, for every 1% (one percent) increase in Tlingit-Haida within a typical geography, there is a decrease of 0.11% in percentage of population with at least ged/equivalency education.
It is essential to understand that the correlation between the percentage of Tlingit-Haida and percentage of population with at least ged/equivalency education does not imply a direct cause-and-effect relationship. It remains uncertain whether the presence of Tlingit-Haida influences an upward or downward trend in the level of percentage of population with at least ged/equivalency education within an area, or if Tlingit-Haida simply ended up residing in those areas with higher or lower levels of percentage of population with at least ged/equivalency education due to other factors.
Demographics Similar to Tlingit-Haida by GED/Equivalency
In terms of ged/equivalency, the demographic groups most similar to Tlingit-Haida are Assyrian/Chaldean/Syriac (87.0%, a difference of 0.0%), Immigrants from Kazakhstan (87.0%, a difference of 0.010%), Mongolian (87.0%, a difference of 0.020%), Swiss (87.0%, a difference of 0.030%), and Egyptian (87.1%, a difference of 0.050%).
| Demographics | Rating | Rank | GED/Equivalency |
| Indians (Asian) | 95.9 /100 | #105 | Exceptional 87.1% |
| Immigrants from Zimbabwe | 95.8 /100 | #106 | Exceptional 87.1% |
| Icelanders | 95.7 /100 | #107 | Exceptional 87.1% |
| Canadians | 95.6 /100 | #108 | Exceptional 87.1% |
| Immigrants from Eastern Europe | 95.5 /100 | #109 | Exceptional 87.1% |
| Egyptians | 95.3 /100 | #110 | Exceptional 87.1% |
| French | 95.2 /100 | #111 | Exceptional 87.1% |
| Tlingit-Haida | 94.8 /100 | #112 | Exceptional 87.0% |
| Assyrians/Chaldeans/Syriacs | 94.8 /100 | #113 | Exceptional 87.0% |
| Immigrants from Kazakhstan | 94.7 /100 | #114 | Exceptional 87.0% |
| Mongolians | 94.6 /100 | #115 | Exceptional 87.0% |
| Swiss | 94.5 /100 | #116 | Exceptional 87.0% |
| Immigrants from Hong Kong | 93.8 /100 | #117 | Exceptional 86.9% |
| French Canadians | 93.2 /100 | #118 | Exceptional 86.9% |
| Immigrants from China | 93.2 /100 | #119 | Exceptional 86.9% |
Tlingit-Haida GED/Equivalency Correlation Summary
| Measurement | Tlingit-Haida Data | GED/Equivalency Data |
| Minimum | 0.036% | 73.1% |
| Maximum | 76.8% | 97.4% |
| Range | 76.8% | 24.3% |
| Mean | 19.2% | 86.9% |
| Median | 10.1% | 87.2% |
| Interquartile 25% (IQ1) | 4.2% | 83.6% |
| Interquartile 75% (IQ3) | 26.7% | 90.1% |
| Interquartile Range (IQR) | 22.6% | 6.4% |
| Standard Deviation (Sample) | 22.1% | 5.6% |
| Standard Deviation (Population) | 21.8% | 5.6% |
Correlation Details
| Tlingit-Haida Percentile | Sample Size | GED/Equivalency |
[ 0.0% - 0.5% ] 0.036% | 59,033,062 | 85.7% |
[ 0.5% - 1.0% ] 0.54% | 1,312,339 | 88.4% |
[ 0.5% - 1.0% ] 0.91% | 247,818 | 88.1% |
[ 1.0% - 1.5% ] 1.24% | 85,687 | 86.5% |
[ 1.5% - 2.0% ] 1.71% | 25,685 | 83.5% |
[ 2.0% - 2.5% ] 2.28% | 8,447 | 89.3% |
[ 2.0% - 2.5% ] 2.46% | 3,821 | 90.9% |
[ 2.5% - 3.0% ] 2.92% | 6,472 | 87.2% |
[ 3.0% - 3.5% ] 3.33% | 10,388 | 91.9% |
[ 3.5% - 4.0% ] 3.97% | 1,964 | 86.4% |
[ 4.0% - 4.5% ] 4.35% | 115 | 85.3% |
[ 4.5% - 5.0% ] 4.62% | 822 | 96.1% |
[ 5.5% - 6.0% ] 5.62% | 1,762 | 87.6% |
[ 6.0% - 6.5% ] 6.21% | 177 | 96.4% |
[ 6.5% - 7.0% ] 6.91% | 564 | 92.9% |
[ 6.5% - 7.0% ] 6.94% | 2,146 | 89.5% |
[ 7.0% - 7.5% ] 7.50% | 40 | 83.8% |
[ 7.5% - 8.0% ] 7.80% | 1,257 | 76.7% |
[ 8.0% - 8.5% ] 8.22% | 146 | 77.5% |
[ 8.5% - 9.0% ] 9.00% | 6,691 | 84.7% |
[ 10.0% - 10.5% ] 10.13% | 2,902 | 85.3% |
[ 10.5% - 11.0% ] 10.70% | 29,933 | 90.0% |
[ 11.0% - 11.5% ] 11.00% | 32,108 | 90.2% |
[ 11.0% - 11.5% ] 11.18% | 13,913 | 89.8% |
[ 12.0% - 12.5% ] 12.26% | 18,041 | 90.5% |
[ 12.5% - 13.0% ] 12.66% | 8,647 | 87.6% |
[ 15.0% - 15.5% ] 15.26% | 2,169 | 93.5% |
[ 15.5% - 16.0% ] 15.92% | 1,727 | 86.2% |
[ 21.0% - 21.5% ] 21.23% | 4,267 | 82.7% |
[ 22.5% - 23.0% ] 22.55% | 1,073 | 82.6% |
[ 23.5% - 24.0% ] 23.53% | 85 | 97.4% |
[ 29.5% - 30.0% ] 29.96% | 1,128 | 89.7% |
[ 35.0% - 35.5% ] 35.09% | 57 | 95.8% |
[ 36.5% - 37.0% ] 36.59% | 82 | 88.3% |
[ 44.5% - 45.0% ] 44.78% | 920 | 80.9% |
[ 49.0% - 49.5% ] 49.33% | 1,792 | 87.2% |
[ 51.0% - 51.5% ] 51.24% | 804 | 78.0% |
[ 67.5% - 68.0% ] 67.59% | 361 | 76.3% |
[ 69.0% - 69.5% ] 69.41% | 1,602 | 87.2% |
[ 74.5% - 75.0% ] 74.63% | 67 | 73.1% |
[ 76.5% - 77.0% ] 76.85% | 838 | 80.4% |