Immigrants from Egypt 3 or more Vehicles in Household

COMPARE

Immigrants from Egypt
Race
Ancestry
AfghanAfricanAlaska NativeAlaskan AthabascanAlbanianAleutAlsatianAmericanApacheArabArapahoArgentineanArmenianAssyrian/Chaldean/SyriacAustralianAustrianBahamianBangladeshiBarbadianBasqueBelgianBelizeanBermudanBhutaneseBlackfeetBolivianBrazilianBritishBritish West IndianBulgarianBurmeseCajunCambodianCanadianCape VerdeanCarpatho RusynCelticCentral AmericanCentral American IndianCherokeeCheyenneChickasawChileanChineseChippewaChoctawColombianColvilleComancheCosta RicanCreeCreekCroatianCrowCubanCypriotCzechCzechoslovakianDanishDelawareDominicanDutchDutch West IndianEastern EuropeanEcuadorianEgyptianEnglishEstonianEthiopianEuropeanFijianFilipinoFinnishFrenchFrench American IndianFrench CanadianGermanGerman RussianGhanaianGreekGuamanian/ChamorroGuatemalanGuyaneseHaitianHmongHonduranHopiHoumaHungarianIcelanderIndian (Asian)IndonesianInupiatIranianIraqiIrishIroquoisIsraeliItalianJamaicanJapaneseJordanianKenyanKiowaKoreanLaotianLatvianLebaneseLiberianLithuanianLumbeeLuxembourgerMacedonianMalaysianMalteseMarshalleseMenomineeMexicanMexican American IndianMongolianMoroccanNative HawaiianNavajoNepaleseNew ZealanderNicaraguanNigerianNorthern EuropeanNorwegianOkinawanOsageOttawaPaiutePakistaniPalestinianPanamanianParaguayanPennsylvania GermanPeruvianPimaPolishPortuguesePotawatomiPuebloPuerto RicanPuget Sound SalishRomanianRussianSalvadoranSamoanScandinavianScotch-IrishScottishSeminoleSenegaleseSerbianShoshoneSierra LeoneanSiouxSlavicSlovakSloveneSomaliSouth AfricanSouth AmericanSouth American IndianSoviet UnionSpaniardSpanishSpanish AmericanSpanish American IndianSri LankanSubsaharan AfricanSudaneseSwedishSwissSyrianTaiwaneseThaiTlingit-HaidaTohono O'OdhamTonganTrinidadian and TobagonianTsimshianTurkishU.S. Virgin IslanderUgandanUkrainianUruguayanUteVenezuelanVietnameseWelshWest IndianYakamaYaquiYugoslavianYumanYup'ikZimbabwean
Immigration
NonimmigrantsImmigrantsAfghanistanAfricaAlbaniaArgentinaArmeniaAsiaAustraliaAustriaBahamasBangladeshBarbadosBelarusBelgiumBelizeBoliviaBosnia and HerzegovinaBrazilBulgariaBurma/MyanmarCabo VerdeCambodiaCameroonCanadaCaribbeanCentral AmericaChileChinaColombiaCongoCosta RicaCroatiaCubaCzechoslovakiaDenmarkDominicaDominican RepublicEastern AfricaEastern AsiaEastern EuropeEcuadorEgyptEl SalvadorEnglandEritreaEthiopiaEuropeFijiFranceGermanyGhanaGreeceGrenadaGuatemalaGuyanaHaitiHondurasHong KongHungaryIndiaIndonesiaIranIraqIrelandIsraelItalyJamaicaJapanJordanKazakhstanKenyaKoreaKuwaitLaosLatin AmericaLatviaLebanonLiberiaLithuaniaMalaysiaMexicoMicronesiaMiddle AfricaMoldovaMoroccoNepalNetherlandsNicaraguaNigeriaNorth AmericaNorth MacedoniaNorthern AfricaNorthern EuropeNorwayOceaniaPakistanPanamaPeruPhilippinesPolandPortugalRomaniaRussiaSaudi ArabiaScotlandSenegalSerbiaSierra LeoneSingaporeSomaliaSouth AfricaSouth AmericaSouth Central AsiaSouth Eastern AsiaSouthern EuropeSpainSri LankaSt. Vincent and the GrenadinesSudanSwedenSwitzerlandSyriaTaiwanThailandTrinidad and TobagoTurkeyUgandaUkraineUruguayUzbekistanVenezuelaVietnamWest IndiesWestern AfricaWestern AsiaWestern EuropeYemenZaireZimbabweAzores
Select to Compare
Race
Ancestry
AfghanAfricanAlaska NativeAlaskan AthabascanAlbanianAleutAlsatianAmericanApacheArabArapahoArgentineanArmenianAssyrian/Chaldean/SyriacAustralianAustrianBahamianBangladeshiBarbadianBasqueBelgianBelizeanBermudanBhutaneseBlackfeetBolivianBrazilianBritishBritish West IndianBulgarianBurmeseCajunCambodianCanadianCape VerdeanCarpatho RusynCelticCentral AmericanCentral American IndianCherokeeCheyenneChickasawChileanChineseChippewaChoctawColombianColvilleComancheCosta RicanCreeCreekCroatianCrowCubanCypriotCzechCzechoslovakianDanishDelawareDominicanDutchDutch West IndianEastern EuropeanEcuadorianEgyptianEnglishEstonianEthiopianEuropeanFijianFilipinoFinnishFrenchFrench American IndianFrench CanadianGermanGerman RussianGhanaianGreekGuamanian/ChamorroGuatemalanGuyaneseHaitianHmongHonduranHopiHoumaHungarianIcelanderIndian (Asian)IndonesianInupiatIranianIraqiIrishIroquoisIsraeliItalianJamaicanJapaneseJordanianKenyanKiowaKoreanLaotianLatvianLebaneseLiberianLithuanianLumbeeLuxembourgerMacedonianMalaysianMalteseMarshalleseMenomineeMexicanMexican American IndianMongolianMoroccanNative HawaiianNavajoNepaleseNew ZealanderNicaraguanNigerianNorthern EuropeanNorwegianOkinawanOsageOttawaPaiutePakistaniPalestinianPanamanianParaguayanPennsylvania GermanPeruvianPimaPolishPortuguesePotawatomiPuebloPuerto RicanPuget Sound SalishRomanianRussianSalvadoranSamoanScandinavianScotch-IrishScottishSeminoleSenegaleseSerbianShoshoneSierra LeoneanSiouxSlavicSlovakSloveneSomaliSouth AfricanSouth AmericanSouth American IndianSoviet UnionSpaniardSpanishSpanish AmericanSpanish American IndianSri LankanSubsaharan AfricanSudaneseSwedishSwissSyrianTaiwaneseThaiTlingit-HaidaTohono O'OdhamTonganTrinidadian and TobagonianTsimshianTurkishU.S. Virgin IslanderUgandanUkrainianUruguayanUteVenezuelanVietnameseWelshWest IndianYakamaYaquiYugoslavianYumanYup'ikZimbabwean
Immigration
NonimmigrantsImmigrantsAfghanistanAfricaAlbaniaArgentinaArmeniaAsiaAustraliaAustriaBahamasBangladeshBarbadosBelarusBelgiumBelizeBoliviaBosnia and HerzegovinaBrazilBulgariaBurma/MyanmarCabo VerdeCambodiaCameroonCanadaCaribbeanCentral AmericaChileChinaColombiaCongoCosta RicaCroatiaCubaCzechoslovakiaDenmarkDominicaDominican RepublicEastern AfricaEastern AsiaEastern EuropeEcuadorEl SalvadorEnglandEritreaEthiopiaEuropeFijiFranceGermanyGhanaGreeceGrenadaGuatemalaGuyanaHaitiHondurasHong KongHungaryIndiaIndonesiaIranIraqIrelandIsraelItalyJamaicaJapanJordanKazakhstanKenyaKoreaKuwaitLaosLatin AmericaLatviaLebanonLiberiaLithuaniaMalaysiaMexicoMicronesiaMiddle AfricaMoldovaMoroccoNepalNetherlandsNicaraguaNigeriaNorth AmericaNorth MacedoniaNorthern AfricaNorthern EuropeNorwayOceaniaPakistanPanamaPeruPhilippinesPolandPortugalRomaniaRussiaSaudi ArabiaScotlandSenegalSerbiaSierra LeoneSingaporeSomaliaSouth AfricaSouth AmericaSouth Central AsiaSouth Eastern AsiaSouthern EuropeSpainSri LankaSt. Vincent and the GrenadinesSudanSwedenSwitzerlandSyriaTaiwanThailandTrinidad and TobagoTurkeyUgandaUkraineUruguayUzbekistanVenezuelaVietnamWest IndiesWestern AfricaWestern AsiaWestern EuropeYemenZaireZimbabweAzores
3 or more Vehicles in Household
Income
Poverty
Unemployment
Labor Participation
Family Structure
Vehicle Availability
Education Level
Disability

Immigrants from Egypt 3 or more Vehicles in Household
Poor

18.8%
3+ VEHICLES AVAILABLE
13.5/ 100
METRIC RATING
209th/ 347
METRIC RANK

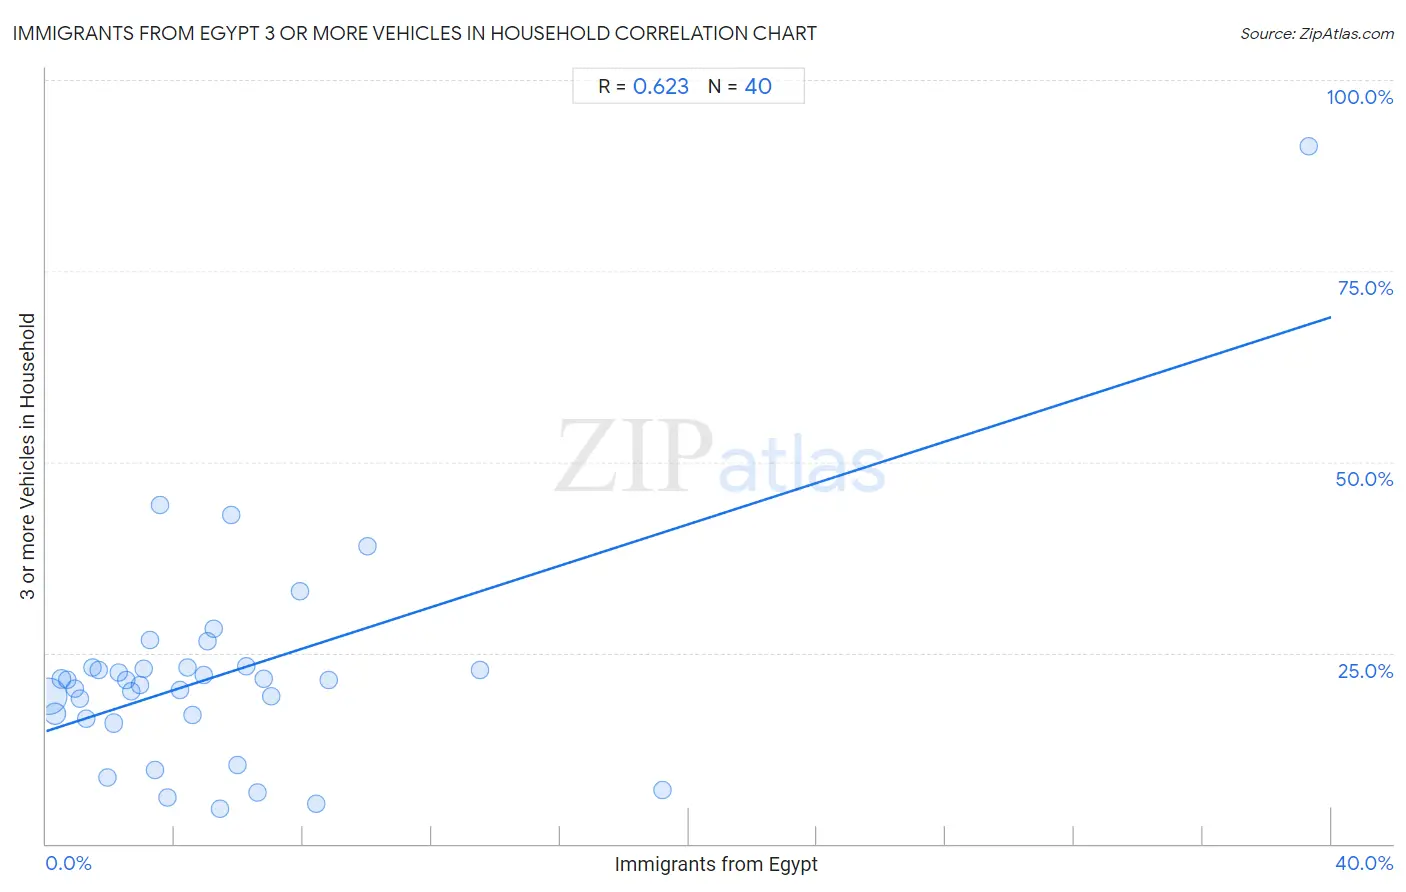
Immigrants from Egypt 3 or more Vehicles in Household Correlation Chart

The statistical analysis conducted on geographies consisting of 245,380,289 people shows a significant positive correlation between the proportion of Immigrants from Egypt and percentage of households with 3 or more vehicles available in the United States with a correlation coefficient (R) of 0.623 and weighted average of 18.8%. On average, for every 1% (one percent) increase in Immigrants from Egypt within a typical geography, there is an increase of 1.4% in percentage of households with 3 or more vehicles available.
Immigrants from Egypt 3 or more Vehicles in Household
It is essential to understand that the correlation between the percentage of Immigrants from Egypt and percentage of households with 3 or more vehicles available does not imply a direct cause-and-effect relationship. It remains uncertain whether the presence of Immigrants from Egypt influences an upward or downward trend in the level of percentage of households with 3 or more vehicles available within an area, or if Immigrants from Egypt simply ended up residing in those areas with higher or lower levels of percentage of households with 3 or more vehicles available due to other factors.

Demographics Similar to Immigrants from Egypt by 3 or more Vehicles in Household

In terms of 3 or more vehicles in household, the demographic groups most similar to Immigrants from Egypt are Immigrants from Burma/Myanmar (18.8%, a difference of 0.010%), Immigrants from Chile (18.8%, a difference of 0.020%), Bulgarian (18.8%, a difference of 0.080%), Immigrants from Eastern Asia (18.8%, a difference of 0.10%), and Russian (18.8%, a difference of 0.11%).
DemographicsRating | Rank3 or more Vehicles in Household
Immigrants from Austria
15.4
/100
|
#202
Poor
18.9%
Tohono O'odham
14.8
/100
|
#203
Poor
18.9%
Immigrants from Romania
14.6
/100
|
#204
Poor
18.9%
Russians
14.2
/100
|
#205
Poor
18.8%
Immigrants from Eastern Asia
14.1
/100
|
#206
Poor
18.8%
Immigrants from Chile
13.6
/100
|
#207
Poor
18.8%
Immigrants from Burma/Myanmar
13.6
/100
|
#208
Poor
18.8%
Immigrants from Egypt
13.5
/100
|
#209
Poor
18.8%
Bulgarians
13.1
/100
|
#210
Poor
18.8%
Immigrants from Kenya
12.4
/100
|
#211
Poor
18.8%
Panamanians
11.6
/100
|
#212
Poor
18.8%
Immigrants from Cuba
11.6
/100
|
#213
Poor
18.8%
Immigrants from Sierra Leone
10.8
/100
|
#214
Poor
18.7%
Eastern Europeans
10.6
/100
|
#215
Poor
18.7%
Immigrants from Nigeria
10.3
/100
|
#216
Poor
18.7%

Immigrants from Egypt 3 or more Vehicles in Household Correlation Summary

MeasurementImmigrants from Egypt Data3 or more Vehicles in Household Data
Minimum0.064%4.5%
Maximum39.3%91.3%
Range39.2%86.8%
Mean5.5%22.1%
Median4.0%21.4%
Interquartile 25% (IQ1)2.0%16.6%
Interquartile 75% (IQ3)6.4%23.1%
Interquartile Range (IQR)4.4%6.5%
Standard Deviation (Sample)6.7%14.5%
Standard Deviation (Population)6.6%14.3%

Correlation Details

Immigrants from Egypt PercentileSample Size3 or more Vehicles in Household
[
0.0%
-
0.5%
]
0.064%
186,611,81919.3%
[
0.0%
-
0.5%
]
0.27%
37,078,39517.0%
[
0.0%
-
0.5%
]
0.48%
9,160,04321.5%
[
0.5%
-
1.0%
]
0.66%
4,507,73421.5%
[
0.5%
-
1.0%
]
0.89%
2,435,56920.3%
[
1.0%
-
1.5%
]
1.05%
2,231,02819.0%
[
1.0%
-
1.5%
]
1.26%
877,61716.3%
[
1.0%
-
1.5%
]
1.45%
473,38123.0%
[
1.5%
-
2.0%
]
1.63%
523,49122.7%
[
1.5%
-
2.0%
]
1.91%
496,9028.6%
[
2.0%
-
2.5%
]
2.10%
267,76715.8%
[
2.0%
-
2.5%
]
2.25%
46,63422.5%
[
2.0%
-
2.5%
]
2.49%
58,97421.4%
[
2.5%
-
3.0%
]
2.63%
52,53220.0%
[
2.5%
-
3.0%
]
2.93%
5,25020.8%
[
3.0%
-
3.5%
]
3.05%
25,40123.0%
[
3.0%
-
3.5%
]
3.22%
51,88326.6%
[
3.0%
-
3.5%
]
3.38%
66,9069.6%
[
3.5%
-
4.0%
]
3.54%
6,23844.4%
[
3.5%
-
4.0%
]
3.78%
51,4166.0%
[
4.0%
-
4.5%
]
4.17%
30,45020.2%
[
4.0%
-
4.5%
]
4.41%
12,42423.1%
[
4.5%
-
5.0%
]
4.55%
1,42916.9%
[
4.5%
-
5.0%
]
4.89%
99,80022.1%
[
5.0%
-
5.5%
]
5.04%
22,92526.6%
[
5.0%
-
5.5%
]
5.21%
8,41028.2%
[
5.0%
-
5.5%
]
5.40%
2,8154.5%
[
5.5%
-
6.0%
]
5.76%
74743.0%
[
5.5%
-
6.0%
]
5.97%
140,99410.3%
[
6.0%
-
6.5%
]
6.22%
8,81523.2%
[
6.5%
-
7.0%
]
6.58%
5,0006.7%
[
6.5%
-
7.0%
]
6.76%
14821.5%
[
6.5%
-
7.0%
]
6.99%
14319.4%
[
7.5%
-
8.0%
]
7.90%
6,93833.1%
[
8.0%
-
8.5%
]
8.40%
7505.3%
[
8.5%
-
9.0%
]
8.81%
1,33921.4%
[
10.0%
-
10.5%
]
10.02%
5,75138.9%
[
13.0%
-
13.5%
]
13.49%
1,39422.7%
[
19.0%
-
19.5%
]
19.16%
9817.1%
[
39.0%
-
39.5%
]
39.29%
5691.3%