Cree 3 or more Vehicles in Household
COMPARE
Cree
Select to Compare
3 or more Vehicles in Household
Cree 3 or more Vehicles in Household
21.0%
3+ VEHICLES AVAILABLE
98.4/ 100
METRIC RATING
96th/ 347
METRIC RANK
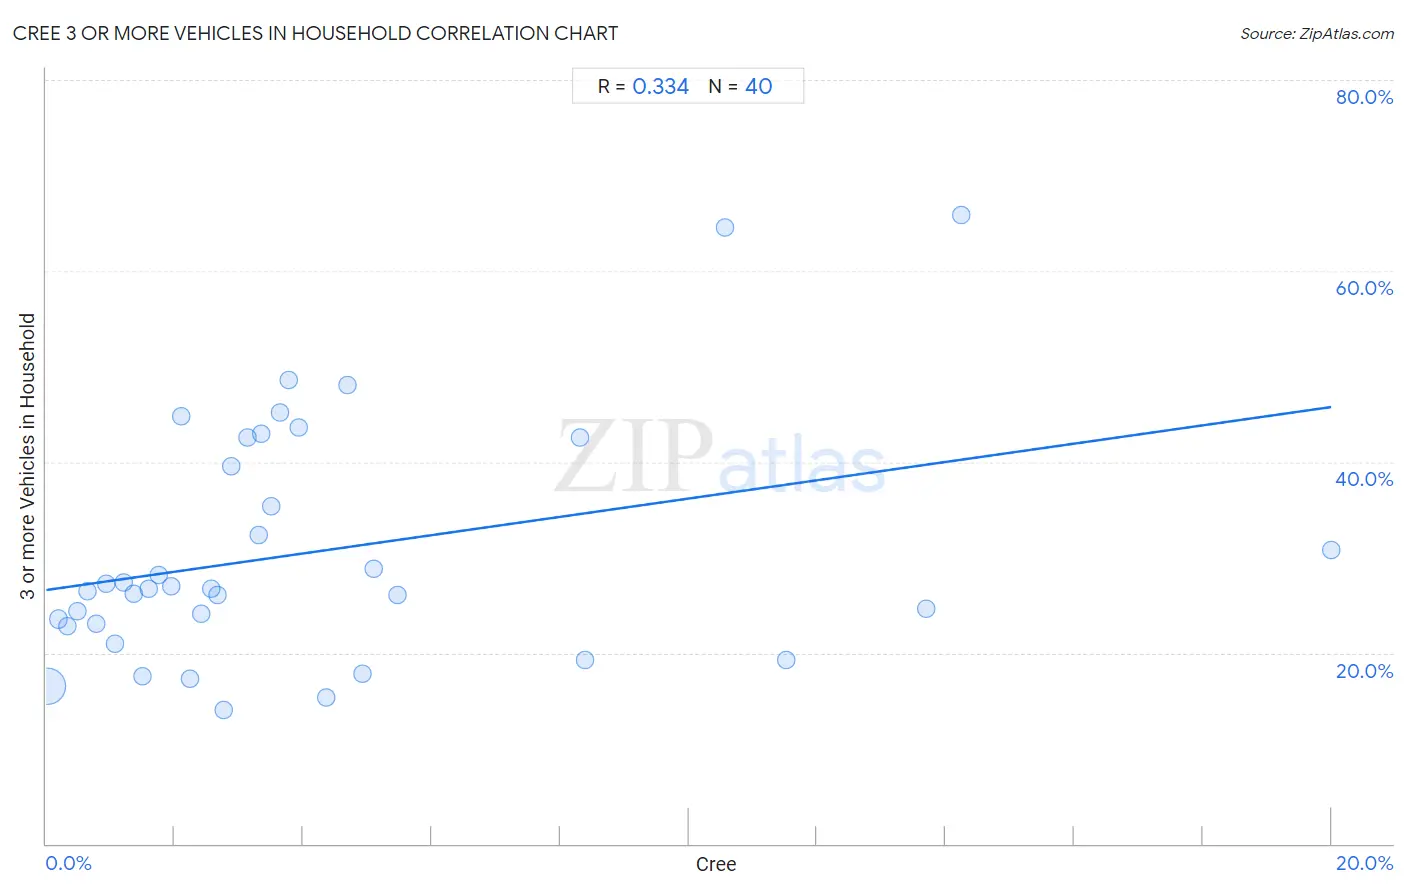
Cree 3 or more Vehicles in Household Correlation Chart
The statistical analysis conducted on geographies consisting of 76,210,632 people shows a mild positive correlation between the proportion of Cree and percentage of households with 3 or more vehicles available in the United States with a correlation coefficient (R) of 0.334 and weighted average of 21.0%. On average, for every 1% (one percent) increase in Cree within a typical geography, there is an increase of 0.96% in percentage of households with 3 or more vehicles available.
It is essential to understand that the correlation between the percentage of Cree and percentage of households with 3 or more vehicles available does not imply a direct cause-and-effect relationship. It remains uncertain whether the presence of Cree influences an upward or downward trend in the level of percentage of households with 3 or more vehicles available within an area, or if Cree simply ended up residing in those areas with higher or lower levels of percentage of households with 3 or more vehicles available due to other factors.
Demographics Similar to Cree by 3 or more Vehicles in Household
In terms of 3 or more vehicles in household, the demographic groups most similar to Cree are Pakistani (21.0%, a difference of 0.090%), Canadian (21.0%, a difference of 0.11%), Hmong (21.0%, a difference of 0.16%), Alaska Native (21.0%, a difference of 0.17%), and Comanche (21.0%, a difference of 0.21%).
| Demographics | Rating | Rank | 3 or more Vehicles in Household |
| Marshallese | 99.2 /100 | #89 | Exceptional 21.3% |
| Immigrants from Afghanistan | 99.1 /100 | #90 | Exceptional 21.2% |
| Belgians | 98.9 /100 | #91 | Exceptional 21.2% |
| Apache | 98.9 /100 | #92 | Exceptional 21.2% |
| Immigrants from Indonesia | 98.8 /100 | #93 | Exceptional 21.1% |
| Immigrants from Cambodia | 98.6 /100 | #94 | Exceptional 21.1% |
| Pakistanis | 98.5 /100 | #95 | Exceptional 21.0% |
| Cree | 98.4 /100 | #96 | Exceptional 21.0% |
| Canadians | 98.3 /100 | #97 | Exceptional 21.0% |
| Hmong | 98.2 /100 | #98 | Exceptional 21.0% |
| Alaska Natives | 98.2 /100 | #99 | Exceptional 21.0% |
| Comanche | 98.2 /100 | #100 | Exceptional 21.0% |
| Blackfeet | 97.9 /100 | #101 | Exceptional 20.9% |
| Seminole | 97.8 /100 | #102 | Exceptional 20.9% |
| Dutch West Indians | 97.8 /100 | #103 | Exceptional 20.9% |
Cree 3 or more Vehicles in Household Correlation Summary
| Measurement | Cree Data | 3 or more Vehicles in Household Data |
| Minimum | 0.016% | 14.0% |
| Maximum | 20.0% | 65.8% |
| Range | 20.0% | 51.8% |
| Mean | 4.2% | 30.6% |
| Median | 2.8% | 26.7% |
| Interquartile 25% (IQ1) | 1.4% | 22.9% |
| Interquartile 75% (IQ3) | 4.8% | 41.0% |
| Interquartile Range (IQR) | 3.4% | 18.1% |
| Standard Deviation (Sample) | 4.4% | 12.6% |
| Standard Deviation (Population) | 4.3% | 12.4% |
Correlation Details
| Cree Percentile | Sample Size | 3 or more Vehicles in Household |
[ 0.0% - 0.5% ] 0.016% | 72,697,893 | 16.5% |
[ 0.0% - 0.5% ] 0.19% | 2,206,464 | 23.5% |
[ 0.0% - 0.5% ] 0.33% | 618,037 | 22.8% |
[ 0.0% - 0.5% ] 0.49% | 319,752 | 24.3% |
[ 0.5% - 1.0% ] 0.65% | 86,121 | 26.5% |
[ 0.5% - 1.0% ] 0.77% | 91,119 | 23.0% |
[ 0.5% - 1.0% ] 0.93% | 36,304 | 27.2% |
[ 1.0% - 1.5% ] 1.08% | 7,345 | 21.0% |
[ 1.0% - 1.5% ] 1.21% | 19,699 | 27.3% |
[ 1.0% - 1.5% ] 1.36% | 22,910 | 26.2% |
[ 1.0% - 1.5% ] 1.49% | 14,930 | 17.5% |
[ 1.5% - 2.0% ] 1.60% | 33,780 | 26.7% |
[ 1.5% - 2.0% ] 1.75% | 4,741 | 28.2% |
[ 1.5% - 2.0% ] 1.95% | 9,711 | 27.0% |
[ 2.0% - 2.5% ] 2.10% | 1,524 | 44.8% |
[ 2.0% - 2.5% ] 2.23% | 3,494 | 17.2% |
[ 2.0% - 2.5% ] 2.42% | 3,225 | 24.1% |
[ 2.5% - 3.0% ] 2.56% | 234 | 26.7% |
[ 2.5% - 3.0% ] 2.67% | 6,146 | 26.0% |
[ 2.5% - 3.0% ] 2.76% | 1,015 | 14.0% |
[ 2.5% - 3.0% ] 2.89% | 693 | 39.5% |
[ 3.0% - 3.5% ] 3.13% | 4,118 | 42.6% |
[ 3.0% - 3.5% ] 3.30% | 3,813 | 32.3% |
[ 3.0% - 3.5% ] 3.34% | 599 | 43.0% |
[ 3.5% - 4.0% ] 3.51% | 1,825 | 35.3% |
[ 3.5% - 4.0% ] 3.64% | 1,403 | 45.1% |
[ 3.5% - 4.0% ] 3.77% | 212 | 48.6% |
[ 3.5% - 4.0% ] 3.93% | 789 | 43.6% |
[ 4.0% - 4.5% ] 4.35% | 689 | 15.4% |
[ 4.5% - 5.0% ] 4.69% | 469 | 48.1% |
[ 4.5% - 5.0% ] 4.93% | 690 | 17.8% |
[ 5.0% - 5.5% ] 5.10% | 2,629 | 28.8% |
[ 5.0% - 5.5% ] 5.46% | 3,662 | 26.1% |
[ 8.0% - 8.5% ] 8.30% | 265 | 42.6% |
[ 8.0% - 8.5% ] 8.38% | 1,599 | 19.3% |
[ 10.5% - 11.0% ] 10.57% | 577 | 64.6% |
[ 11.5% - 12.0% ] 11.53% | 937 | 19.2% |
[ 13.5% - 14.0% ] 13.70% | 387 | 24.6% |
[ 14.0% - 14.5% ] 14.25% | 772 | 65.8% |
[ 20.0% - 20.5% ] 20.00% | 60 | 30.8% |