Immigrants from Trinidad and Tobago 3 or more Vehicles in Household
COMPARE
Immigrants from Trinidad and Tobago
Select to Compare
3 or more Vehicles in Household
Immigrants from Trinidad and Tobago 3 or more Vehicles in Household
13.3%
3+ VEHICLES AVAILABLE
0.0/ 100
METRIC RATING
335th/ 347
METRIC RANK
Immigrants from Trinidad and Tobago 3 or more Vehicles in Household Correlation Chart
The statistical analysis conducted on geographies consisting of 223,458,763 people shows a poor positive correlation between the proportion of Immigrants from Trinidad and Tobago and percentage of households with 3 or more vehicles available in the United States with a correlation coefficient (R) of 0.168 and weighted average of 13.3%. On average, for every 1% (one percent) increase in Immigrants from Trinidad and Tobago within a typical geography, there is an increase of 0.52% in percentage of households with 3 or more vehicles available.
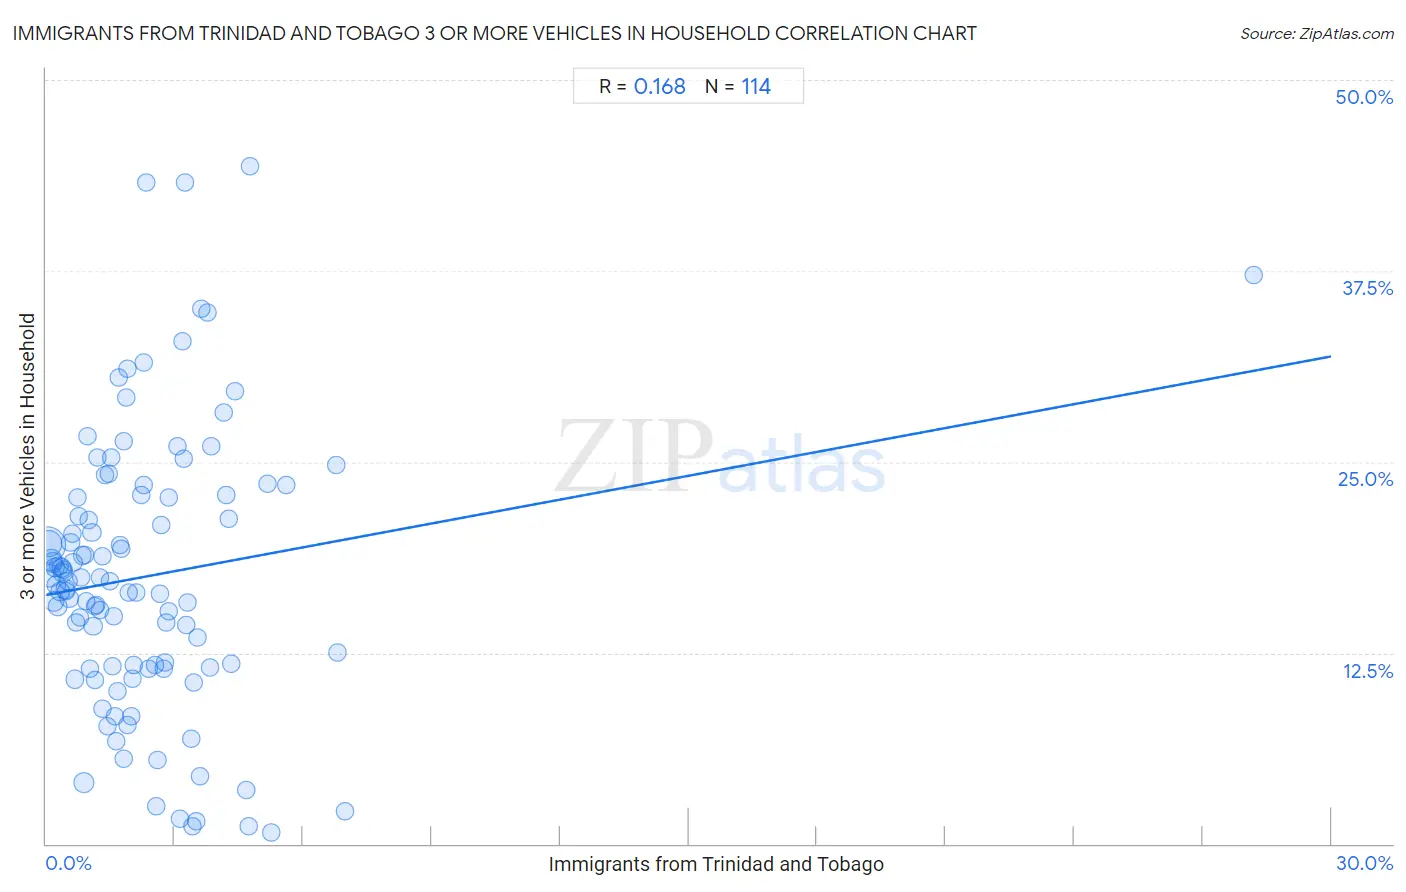
It is essential to understand that the correlation between the percentage of Immigrants from Trinidad and Tobago and percentage of households with 3 or more vehicles available does not imply a direct cause-and-effect relationship. It remains uncertain whether the presence of Immigrants from Trinidad and Tobago influences an upward or downward trend in the level of percentage of households with 3 or more vehicles available within an area, or if Immigrants from Trinidad and Tobago simply ended up residing in those areas with higher or lower levels of percentage of households with 3 or more vehicles available due to other factors.
Demographics Similar to Immigrants from Trinidad and Tobago by 3 or more Vehicles in Household
In terms of 3 or more vehicles in household, the demographic groups most similar to Immigrants from Trinidad and Tobago are Immigrants from Ecuador (13.4%, a difference of 0.46%), Immigrants from Cabo Verde (13.6%, a difference of 1.7%), Trinidadian and Tobagonian (13.6%, a difference of 2.1%), Immigrants from Dominica (13.7%, a difference of 2.8%), and West Indian (13.7%, a difference of 3.0%).
| Demographics | Rating | Rank | 3 or more Vehicles in Household |
| Immigrants from Albania | 0.0 /100 | #328 | Tragic 14.0% |
| Immigrants from Senegal | 0.0 /100 | #329 | Tragic 13.8% |
| West Indians | 0.0 /100 | #330 | Tragic 13.7% |
| Immigrants from Dominica | 0.0 /100 | #331 | Tragic 13.7% |
| Trinidadians and Tobagonians | 0.0 /100 | #332 | Tragic 13.6% |
| Immigrants from Cabo Verde | 0.0 /100 | #333 | Tragic 13.6% |
| Immigrants from Ecuador | 0.0 /100 | #334 | Tragic 13.4% |
| Immigrants from Trinidad and Tobago | 0.0 /100 | #335 | Tragic 13.3% |
| Barbadians | 0.0 /100 | #336 | Tragic 12.6% |
| Immigrants from Bangladesh | 0.0 /100 | #337 | Tragic 12.5% |
| Vietnamese | 0.0 /100 | #338 | Tragic 12.5% |
| Immigrants from Uzbekistan | 0.0 /100 | #339 | Tragic 12.0% |
| Immigrants from Barbados | 0.0 /100 | #340 | Tragic 11.7% |
| Guyanese | 0.0 /100 | #341 | Tragic 11.5% |
| British West Indians | 0.0 /100 | #342 | Tragic 11.4% |
Immigrants from Trinidad and Tobago 3 or more Vehicles in Household Correlation Summary
| Measurement | Immigrants from Trinidad and Tobago Data | 3 or more Vehicles in Household Data |
| Minimum | 0.016% | 0.77% |
| Maximum | 28.2% | 44.4% |
| Range | 28.2% | 43.6% |
| Mean | 2.3% | 17.5% |
| Median | 1.8% | 17.1% |
| Interquartile 25% (IQ1) | 0.89% | 11.6% |
| Interquartile 75% (IQ3) | 3.2% | 22.7% |
| Interquartile Range (IQR) | 2.3% | 11.0% |
| Standard Deviation (Sample) | 2.9% | 9.0% |
| Standard Deviation (Population) | 2.9% | 9.0% |
Correlation Details
| Immigrants from Trinidad and Tobago Percentile | Sample Size | 3 or more Vehicles in Household |
[ 0.0% - 0.5% ] 0.016% | 75,514,790 | 19.6% |
[ 0.0% - 0.5% ] 0.045% | 36,386,481 | 19.7% |
[ 0.0% - 0.5% ] 0.075% | 23,585,102 | 17.5% |
[ 0.0% - 0.5% ] 0.11% | 15,382,219 | 18.5% |
[ 0.0% - 0.5% ] 0.14% | 10,208,152 | 18.4% |
[ 0.0% - 0.5% ] 0.17% | 9,351,437 | 15.9% |
[ 0.0% - 0.5% ] 0.20% | 5,507,677 | 18.1% |
[ 0.0% - 0.5% ] 0.23% | 4,979,339 | 16.9% |
[ 0.0% - 0.5% ] 0.26% | 3,808,913 | 15.5% |
[ 0.0% - 0.5% ] 0.29% | 3,180,976 | 18.2% |
[ 0.0% - 0.5% ] 0.32% | 2,894,097 | 16.5% |
[ 0.0% - 0.5% ] 0.35% | 2,701,778 | 18.1% |
[ 0.0% - 0.5% ] 0.38% | 2,156,435 | 17.7% |
[ 0.0% - 0.5% ] 0.41% | 1,770,541 | 17.9% |
[ 0.0% - 0.5% ] 0.45% | 1,813,018 | 16.7% |
[ 0.0% - 0.5% ] 0.47% | 1,002,315 | 16.6% |
[ 0.5% - 1.0% ] 0.51% | 1,257,814 | 17.2% |
[ 0.5% - 1.0% ] 0.54% | 1,372,681 | 16.0% |
[ 0.5% - 1.0% ] 0.57% | 629,536 | 19.7% |
[ 0.5% - 1.0% ] 0.60% | 637,148 | 20.3% |
[ 0.5% - 1.0% ] 0.63% | 615,643 | 18.4% |
[ 0.5% - 1.0% ] 0.66% | 1,012,234 | 10.8% |
[ 0.5% - 1.0% ] 0.69% | 522,276 | 14.5% |
[ 0.5% - 1.0% ] 0.72% | 307,022 | 22.7% |
[ 0.5% - 1.0% ] 0.75% | 210,552 | 21.4% |
[ 0.5% - 1.0% ] 0.78% | 431,784 | 14.8% |
[ 0.5% - 1.0% ] 0.81% | 377,263 | 17.4% |
[ 0.5% - 1.0% ] 0.85% | 779,599 | 18.9% |
[ 0.5% - 1.0% ] 0.89% | 9,105,879 | 4.0% |
[ 0.5% - 1.0% ] 0.91% | 253,348 | 18.9% |
[ 0.5% - 1.0% ] 0.94% | 154,761 | 15.9% |
[ 0.5% - 1.0% ] 0.97% | 201,660 | 26.7% |
[ 0.5% - 1.0% ] 1.00% | 251,033 | 21.2% |
[ 1.0% - 1.5% ] 1.02% | 271,131 | 11.5% |
[ 1.0% - 1.5% ] 1.06% | 129,020 | 20.4% |
[ 1.0% - 1.5% ] 1.09% | 295,756 | 14.3% |
[ 1.0% - 1.5% ] 1.13% | 114,448 | 10.8% |
[ 1.0% - 1.5% ] 1.14% | 104,411 | 15.6% |
[ 1.0% - 1.5% ] 1.18% | 271,442 | 15.7% |
[ 1.0% - 1.5% ] 1.20% | 82,351 | 25.3% |
[ 1.0% - 1.5% ] 1.24% | 259,713 | 17.5% |
[ 1.0% - 1.5% ] 1.27% | 77,705 | 15.3% |
[ 1.0% - 1.5% ] 1.30% | 259,326 | 8.8% |
[ 1.0% - 1.5% ] 1.32% | 20,931 | 18.9% |
[ 1.0% - 1.5% ] 1.36% | 51,452 | 24.2% |
[ 1.0% - 1.5% ] 1.42% | 110,190 | 7.7% |
[ 1.0% - 1.5% ] 1.45% | 75,816 | 24.3% |
[ 1.0% - 1.5% ] 1.49% | 159,013 | 17.2% |
[ 1.5% - 2.0% ] 1.52% | 28,841 | 25.3% |
[ 1.5% - 2.0% ] 1.55% | 131,172 | 11.6% |
[ 1.5% - 2.0% ] 1.57% | 36,359 | 14.9% |
[ 1.5% - 2.0% ] 1.60% | 100,450 | 8.3% |
[ 1.5% - 2.0% ] 1.63% | 35,744 | 6.7% |
[ 1.5% - 2.0% ] 1.67% | 56,182 | 10.0% |
[ 1.5% - 2.0% ] 1.70% | 47,515 | 30.5% |
[ 1.5% - 2.0% ] 1.73% | 40,484 | 19.5% |
[ 1.5% - 2.0% ] 1.76% | 145,080 | 19.3% |
[ 1.5% - 2.0% ] 1.80% | 20,336 | 26.4% |
[ 1.5% - 2.0% ] 1.82% | 117,288 | 5.6% |
[ 1.5% - 2.0% ] 1.86% | 43,396 | 29.2% |
[ 1.5% - 2.0% ] 1.88% | 11,837 | 31.1% |
[ 1.5% - 2.0% ] 1.90% | 29,348 | 7.8% |
[ 1.5% - 2.0% ] 1.94% | 55,114 | 16.5% |
[ 1.5% - 2.0% ] 1.98% | 55,336 | 8.4% |
[ 2.0% - 2.5% ] 2.01% | 40,738 | 10.8% |
[ 2.0% - 2.5% ] 2.05% | 52,000 | 11.7% |
[ 2.0% - 2.5% ] 2.09% | 47,691 | 16.5% |
[ 2.0% - 2.5% ] 2.22% | 4,910 | 22.9% |
[ 2.0% - 2.5% ] 2.27% | 7,104 | 23.5% |
[ 2.0% - 2.5% ] 2.27% | 18,470 | 31.5% |
[ 2.0% - 2.5% ] 2.34% | 898 | 43.3% |
[ 2.0% - 2.5% ] 2.40% | 65,645 | 11.4% |
[ 2.5% - 3.0% ] 2.54% | 2,720 | 11.7% |
[ 2.5% - 3.0% ] 2.57% | 96,801 | 2.5% |
[ 2.5% - 3.0% ] 2.59% | 189,692 | 5.5% |
[ 2.5% - 3.0% ] 2.66% | 10,526 | 16.4% |
[ 2.5% - 3.0% ] 2.68% | 5,740 | 20.9% |
[ 2.5% - 3.0% ] 2.74% | 108,992 | 11.5% |
[ 2.5% - 3.0% ] 2.77% | 79,458 | 11.8% |
[ 2.5% - 3.0% ] 2.81% | 32,296 | 14.5% |
[ 2.5% - 3.0% ] 2.85% | 6,529 | 22.7% |
[ 2.5% - 3.0% ] 2.86% | 67,242 | 15.2% |
[ 3.0% - 3.5% ] 3.05% | 17,400 | 26.0% |
[ 3.0% - 3.5% ] 3.12% | 83,125 | 1.7% |
[ 3.0% - 3.5% ] 3.17% | 630 | 32.9% |
[ 3.0% - 3.5% ] 3.20% | 9,011 | 25.2% |
[ 3.0% - 3.5% ] 3.24% | 1,726 | 43.3% |
[ 3.0% - 3.5% ] 3.26% | 24,994 | 14.3% |
[ 3.0% - 3.5% ] 3.31% | 1,510 | 15.8% |
[ 3.0% - 3.5% ] 3.39% | 29,820 | 6.9% |
[ 3.0% - 3.5% ] 3.40% | 69,131 | 1.1% |
[ 3.0% - 3.5% ] 3.45% | 55,605 | 10.5% |
[ 3.5% - 4.0% ] 3.51% | 84,006 | 1.5% |
[ 3.5% - 4.0% ] 3.53% | 27,845 | 13.5% |
[ 3.5% - 4.0% ] 3.58% | 100,082 | 4.4% |
[ 3.5% - 4.0% ] 3.61% | 3,270 | 35.0% |
[ 3.5% - 4.0% ] 3.76% | 585 | 34.8% |
[ 3.5% - 4.0% ] 3.83% | 58,396 | 11.6% |
[ 3.5% - 4.0% ] 3.84% | 5,938 | 26.0% |
[ 4.0% - 4.5% ] 4.14% | 8,260 | 28.2% |
[ 4.0% - 4.5% ] 4.20% | 8,779 | 22.8% |
[ 4.0% - 4.5% ] 4.25% | 541 | 21.2% |
[ 4.0% - 4.5% ] 4.32% | 21,349 | 11.8% |
[ 4.0% - 4.5% ] 4.40% | 182 | 29.6% |
[ 4.5% - 5.0% ] 4.66% | 63,426 | 3.5% |
[ 4.5% - 5.0% ] 4.72% | 101,648 | 1.1% |
[ 4.5% - 5.0% ] 4.77% | 2,980 | 44.4% |
[ 5.0% - 5.5% ] 5.16% | 2,657 | 23.6% |
[ 5.0% - 5.5% ] 5.24% | 58,476 | 0.77% |
[ 5.5% - 6.0% ] 5.59% | 1,055 | 23.5% |
[ 6.5% - 7.0% ] 6.77% | 251 | 24.8% |
[ 6.5% - 7.0% ] 6.80% | 99,249 | 12.5% |
[ 6.5% - 7.0% ] 6.98% | 78,506 | 2.1% |
[ 28.0% - 28.5% ] 28.19% | 188 | 37.2% |