Tlingit-Haida vs Immigrants from El Salvador 3 or more Vehicles in Household
COMPARE
Tlingit-Haida
Immigrants from El Salvador
3 or more Vehicles in Household
3 or more Vehicles in Household Comparison
Tlingit-Haida
Immigrants from El Salvador
19.9%
3 OR MORE VEHICLES IN HOUSEHOLD
73.4/ 100
METRIC RATING
155th/ 347
METRIC RANK
21.5%
3 OR MORE VEHICLES IN HOUSEHOLD
99.6/ 100
METRIC RATING
82nd/ 347
METRIC RANK
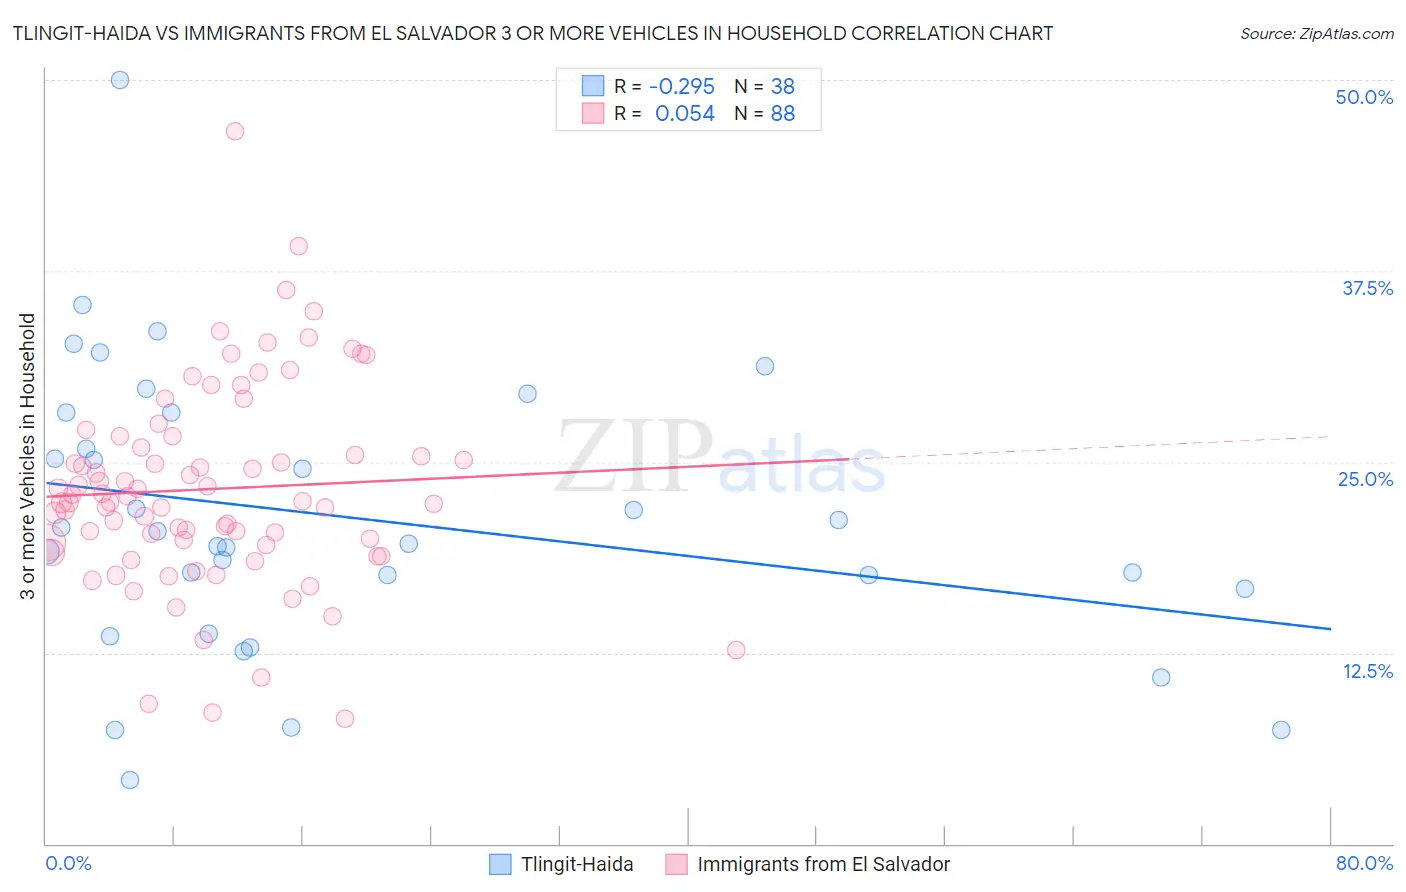
Tlingit-Haida vs Immigrants from El Salvador 3 or more Vehicles in Household Correlation Chart
The statistical analysis conducted on geographies consisting of 60,850,573 people shows a weak negative correlation between the proportion of Tlingit-Haida and percentage of households with 3 or more vehicles available in the United States with a correlation coefficient (R) of -0.295 and weighted average of 19.9%. Similarly, the statistical analysis conducted on geographies consisting of 357,687,978 people shows a slight positive correlation between the proportion of Immigrants from El Salvador and percentage of households with 3 or more vehicles available in the United States with a correlation coefficient (R) of 0.054 and weighted average of 21.5%, a difference of 8.3%.
3 or more Vehicles in Household Correlation Summary
| Measurement | Tlingit-Haida | Immigrants from El Salvador |
| Minimum | 4.2% | 8.2% |
| Maximum | 50.0% | 46.7% |
| Range | 45.8% | 38.5% |
| Mean | 21.4% | 23.2% |
| Median | 20.0% | 22.4% |
| Interquartile 25% (IQ1) | 16.7% | 19.7% |
| Interquartile 75% (IQ3) | 28.2% | 26.3% |
| Interquartile Range (IQR) | 11.5% | 6.7% |
| Standard Deviation (Sample) | 9.2% | 6.6% |
| Standard Deviation (Population) | 9.1% | 6.6% |
Similar Demographics by 3 or more Vehicles in Household
Demographics Similar to Tlingit-Haida by 3 or more Vehicles in Household
In terms of 3 or more vehicles in household, the demographic groups most similar to Tlingit-Haida are Immigrants from Jordan (19.9%, a difference of 0.15%), Thai (19.8%, a difference of 0.21%), Yuman (19.9%, a difference of 0.22%), Hungarian (19.8%, a difference of 0.26%), and Armenian (19.8%, a difference of 0.42%).
| Demographics | Rating | Rank | 3 or more Vehicles in Household |
| Guatemalans | 82.6 /100 | #148 | Excellent 20.1% |
| Immigrants | Iran | 80.9 /100 | #149 | Excellent 20.0% |
| Immigrants | Immigrants | 80.8 /100 | #150 | Excellent 20.0% |
| Taiwanese | 80.6 /100 | #151 | Excellent 20.0% |
| Lebanese | 79.8 /100 | #152 | Good 20.0% |
| Yuman | 75.6 /100 | #153 | Good 19.9% |
| Immigrants | Jordan | 75.0 /100 | #154 | Good 19.9% |
| Tlingit-Haida | 73.4 /100 | #155 | Good 19.9% |
| Thais | 71.1 /100 | #156 | Good 19.8% |
| Hungarians | 70.5 /100 | #157 | Good 19.8% |
| Armenians | 68.8 /100 | #158 | Good 19.8% |
| Immigrants | Pakistan | 68.2 /100 | #159 | Good 19.8% |
| Immigrants | Lebanon | 67.6 /100 | #160 | Good 19.8% |
| Immigrants | Guatemala | 65.6 /100 | #161 | Good 19.7% |
| Estonians | 63.2 /100 | #162 | Good 19.7% |
Demographics Similar to Immigrants from El Salvador by 3 or more Vehicles in Household
In terms of 3 or more vehicles in household, the demographic groups most similar to Immigrants from El Salvador are Chippewa (21.5%, a difference of 0.030%), Icelander (21.5%, a difference of 0.080%), Laotian (21.5%, a difference of 0.10%), Delaware (21.5%, a difference of 0.17%), and Immigrants from the Azores (21.5%, a difference of 0.29%).
| Demographics | Rating | Rank | 3 or more Vehicles in Household |
| Japanese | 99.8 /100 | #75 | Exceptional 21.8% |
| Immigrants | Nonimmigrants | 99.8 /100 | #76 | Exceptional 21.8% |
| Irish | 99.8 /100 | #77 | Exceptional 21.8% |
| Czechoslovakians | 99.8 /100 | #78 | Exceptional 21.7% |
| Assyrians/Chaldeans/Syriacs | 99.8 /100 | #79 | Exceptional 21.7% |
| Afghans | 99.7 /100 | #80 | Exceptional 21.7% |
| Celtics | 99.7 /100 | #81 | Exceptional 21.7% |
| Immigrants | El Salvador | 99.6 /100 | #82 | Exceptional 21.5% |
| Chippewa | 99.6 /100 | #83 | Exceptional 21.5% |
| Icelanders | 99.6 /100 | #84 | Exceptional 21.5% |
| Laotians | 99.6 /100 | #85 | Exceptional 21.5% |
| Delaware | 99.6 /100 | #86 | Exceptional 21.5% |
| Immigrants | Azores | 99.5 /100 | #87 | Exceptional 21.5% |
| French | 99.4 /100 | #88 | Exceptional 21.4% |
| Marshallese | 99.2 /100 | #89 | Exceptional 21.3% |