French 3 or more Vehicles in Household
COMPARE
French
Select to Compare
3 or more Vehicles in Household
French 3 or more Vehicles in Household
21.4%
3+ VEHICLES AVAILABLE
99.4/ 100
METRIC RATING
88th/ 347
METRIC RANK
French 3 or more Vehicles in Household Correlation Chart
The statistical analysis conducted on geographies consisting of 571,506,399 people shows a substantial positive correlation between the proportion of French and percentage of households with 3 or more vehicles available in the United States with a correlation coefficient (R) of 0.573 and weighted average of 21.4%. On average, for every 1% (one percent) increase in French within a typical geography, there is an increase of 0.64% in percentage of households with 3 or more vehicles available.
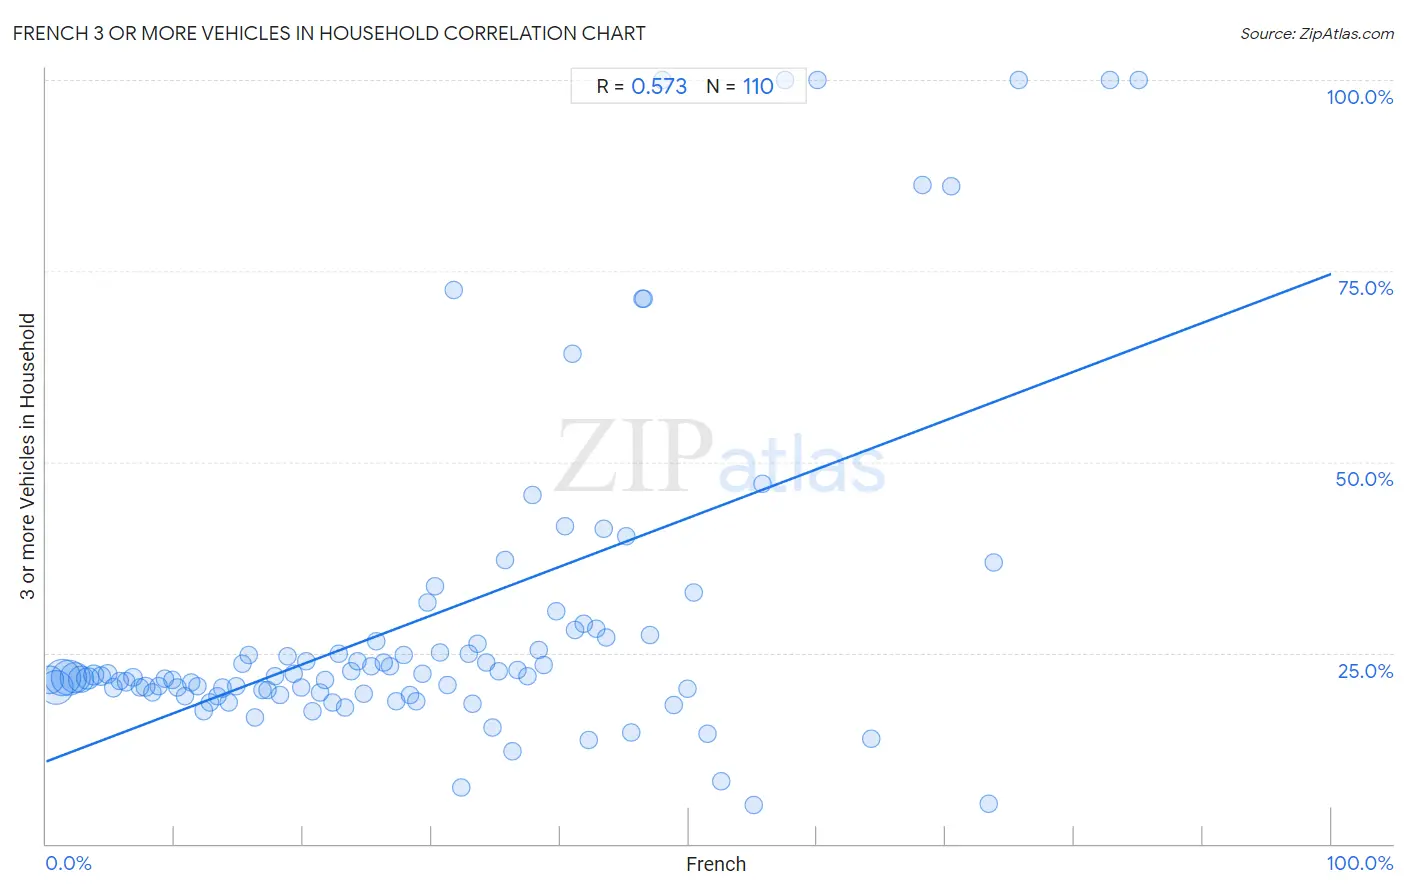
It is essential to understand that the correlation between the percentage of French and percentage of households with 3 or more vehicles available does not imply a direct cause-and-effect relationship. It remains uncertain whether the presence of French influences an upward or downward trend in the level of percentage of households with 3 or more vehicles available within an area, or if French simply ended up residing in those areas with higher or lower levels of percentage of households with 3 or more vehicles available due to other factors.
Demographics Similar to French by 3 or more Vehicles in Household
In terms of 3 or more vehicles in household, the demographic groups most similar to French are Immigrants from the Azores (21.5%, a difference of 0.26%), Delaware (21.5%, a difference of 0.38%), Laotian (21.5%, a difference of 0.46%), Icelander (21.5%, a difference of 0.47%), and Chippewa (21.5%, a difference of 0.53%).
| Demographics | Rating | Rank | 3 or more Vehicles in Household |
| Celtics | 99.7 /100 | #81 | Exceptional 21.7% |
| Immigrants from El Salvador | 99.6 /100 | #82 | Exceptional 21.5% |
| Chippewa | 99.6 /100 | #83 | Exceptional 21.5% |
| Icelanders | 99.6 /100 | #84 | Exceptional 21.5% |
| Laotians | 99.6 /100 | #85 | Exceptional 21.5% |
| Delaware | 99.6 /100 | #86 | Exceptional 21.5% |
| Immigrants from the Azores | 99.5 /100 | #87 | Exceptional 21.5% |
| French | 99.4 /100 | #88 | Exceptional 21.4% |
| Marshallese | 99.2 /100 | #89 | Exceptional 21.3% |
| Immigrants from Afghanistan | 99.1 /100 | #90 | Exceptional 21.2% |
| Belgians | 98.9 /100 | #91 | Exceptional 21.2% |
| Apache | 98.9 /100 | #92 | Exceptional 21.2% |
| Immigrants from Indonesia | 98.8 /100 | #93 | Exceptional 21.1% |
| Immigrants from Cambodia | 98.6 /100 | #94 | Exceptional 21.1% |
| Pakistanis | 98.5 /100 | #95 | Exceptional 21.0% |
French 3 or more Vehicles in Household Correlation Summary
| Measurement | French Data | 3 or more Vehicles in Household Data |
| Minimum | 0.26% | 5.1% |
| Maximum | 85.0% | 100.0% |
| Range | 84.7% | 94.9% |
| Mean | 29.5% | 29.6% |
| Median | 27.5% | 21.9% |
| Interquartile 25% (IQ1) | 13.7% | 19.8% |
| Interquartile 75% (IQ3) | 41.8% | 27.1% |
| Interquartile Range (IQR) | 28.1% | 7.3% |
| Standard Deviation (Sample) | 19.7% | 22.0% |
| Standard Deviation (Population) | 19.6% | 21.9% |
Correlation Details
| French Percentile | Sample Size | 3 or more Vehicles in Household |
[ 0.0% - 0.5% ] 0.26% | 61,444,565 | 21.4% |
[ 0.5% - 1.0% ] 0.77% | 96,949,932 | 20.4% |
[ 1.0% - 1.5% ] 1.25% | 110,924,125 | 21.8% |
[ 1.5% - 2.0% ] 1.74% | 101,318,422 | 21.8% |
[ 2.0% - 2.5% ] 2.24% | 71,449,397 | 21.7% |
[ 2.5% - 3.0% ] 2.72% | 46,734,765 | 21.6% |
[ 3.0% - 3.5% ] 3.22% | 26,074,489 | 21.7% |
[ 3.5% - 4.0% ] 3.72% | 14,638,406 | 22.0% |
[ 4.0% - 4.5% ] 4.24% | 8,785,462 | 22.0% |
[ 4.5% - 5.0% ] 4.75% | 5,723,349 | 22.3% |
[ 5.0% - 5.5% ] 5.23% | 4,680,409 | 20.5% |
[ 5.5% - 6.0% ] 5.74% | 2,800,985 | 21.3% |
[ 6.0% - 6.5% ] 6.23% | 1,741,577 | 21.2% |
[ 6.5% - 7.0% ] 6.75% | 1,722,058 | 21.8% |
[ 7.0% - 7.5% ] 7.26% | 1,310,090 | 20.5% |
[ 7.5% - 8.0% ] 7.72% | 1,271,073 | 20.5% |
[ 8.0% - 8.5% ] 8.23% | 1,255,385 | 19.8% |
[ 8.5% - 9.0% ] 8.76% | 1,044,506 | 20.7% |
[ 9.0% - 9.5% ] 9.21% | 1,116,019 | 21.7% |
[ 9.5% - 10.0% ] 9.78% | 1,031,002 | 21.4% |
[ 10.0% - 10.5% ] 10.23% | 722,742 | 20.5% |
[ 10.5% - 11.0% ] 10.80% | 1,125,903 | 19.4% |
[ 11.0% - 11.5% ] 11.24% | 445,534 | 21.1% |
[ 11.5% - 12.0% ] 11.75% | 425,345 | 20.6% |
[ 12.0% - 12.5% ] 12.26% | 619,512 | 17.4% |
[ 12.5% - 13.0% ] 12.76% | 597,719 | 18.5% |
[ 13.0% - 13.5% ] 13.29% | 687,252 | 19.3% |
[ 13.5% - 14.0% ] 13.71% | 498,070 | 20.4% |
[ 14.0% - 14.5% ] 14.24% | 574,190 | 18.5% |
[ 14.5% - 15.0% ] 14.76% | 347,258 | 20.6% |
[ 15.0% - 15.5% ] 15.27% | 457,295 | 23.6% |
[ 15.5% - 16.0% ] 15.79% | 323,012 | 24.7% |
[ 16.0% - 16.5% ] 16.24% | 478,023 | 16.5% |
[ 16.5% - 17.0% ] 16.80% | 340,009 | 20.2% |
[ 17.0% - 17.5% ] 17.24% | 171,390 | 20.2% |
[ 17.5% - 18.0% ] 17.78% | 291,517 | 21.9% |
[ 18.0% - 18.5% ] 18.20% | 180,802 | 19.4% |
[ 18.5% - 19.0% ] 18.76% | 62,662 | 24.5% |
[ 19.0% - 19.5% ] 19.25% | 83,276 | 22.3% |
[ 19.5% - 20.0% ] 19.81% | 154,227 | 20.4% |
[ 20.0% - 20.5% ] 20.24% | 57,776 | 24.0% |
[ 20.5% - 21.0% ] 20.73% | 138,494 | 17.3% |
[ 21.0% - 21.5% ] 21.27% | 83,263 | 19.8% |
[ 21.5% - 22.0% ] 21.69% | 72,329 | 21.5% |
[ 22.0% - 22.5% ] 22.28% | 62,353 | 18.5% |
[ 22.5% - 23.0% ] 22.77% | 63,513 | 24.9% |
[ 23.0% - 23.5% ] 23.26% | 90,366 | 17.8% |
[ 23.5% - 24.0% ] 23.78% | 48,659 | 22.5% |
[ 24.0% - 24.5% ] 24.22% | 34,568 | 23.9% |
[ 24.5% - 25.0% ] 24.74% | 19,899 | 19.6% |
[ 25.0% - 25.5% ] 25.30% | 16,576 | 23.3% |
[ 25.5% - 26.0% ] 25.73% | 7,459 | 26.6% |
[ 26.0% - 26.5% ] 26.25% | 20,905 | 23.7% |
[ 26.5% - 27.0% ] 26.76% | 7,678 | 23.2% |
[ 27.0% - 27.5% ] 27.25% | 28,298 | 18.6% |
[ 27.5% - 28.0% ] 27.79% | 21,024 | 24.7% |
[ 28.0% - 28.5% ] 28.28% | 16,425 | 19.5% |
[ 28.5% - 29.0% ] 28.79% | 8,577 | 18.7% |
[ 29.0% - 29.5% ] 29.28% | 20,020 | 22.3% |
[ 29.5% - 30.0% ] 29.72% | 8,574 | 31.6% |
[ 30.0% - 30.5% ] 30.24% | 3,710 | 33.7% |
[ 30.5% - 31.0% ] 30.60% | 5,849 | 25.1% |
[ 31.0% - 31.5% ] 31.23% | 7,825 | 20.8% |
[ 31.5% - 32.0% ] 31.75% | 63 | 72.5% |
[ 32.0% - 32.5% ] 32.25% | 524 | 7.3% |
[ 32.5% - 33.0% ] 32.86% | 3,947 | 24.8% |
[ 33.0% - 33.5% ] 33.18% | 3,987 | 18.3% |
[ 33.5% - 34.0% ] 33.61% | 854 | 26.2% |
[ 34.0% - 34.5% ] 34.29% | 1,782 | 23.7% |
[ 34.5% - 35.0% ] 34.69% | 8,236 | 15.3% |
[ 35.0% - 35.5% ] 35.24% | 1,938 | 22.6% |
[ 35.5% - 36.0% ] 35.73% | 1,198 | 37.1% |
[ 36.0% - 36.5% ] 36.31% | 2,702 | 12.2% |
[ 36.5% - 37.0% ] 36.70% | 4,741 | 22.8% |
[ 37.0% - 37.5% ] 37.50% | 3,523 | 21.9% |
[ 37.5% - 38.0% ] 37.87% | 375 | 45.7% |
[ 38.0% - 38.5% ] 38.30% | 5,841 | 25.4% |
[ 38.5% - 39.0% ] 38.69% | 3,107 | 23.5% |
[ 39.5% - 40.0% ] 39.67% | 1,346 | 30.5% |
[ 40.0% - 40.5% ] 40.34% | 1,056 | 41.6% |
[ 40.5% - 41.0% ] 40.91% | 176 | 64.2% |
[ 41.0% - 41.5% ] 41.15% | 1,577 | 27.9% |
[ 41.5% - 42.0% ] 41.78% | 1,290 | 28.7% |
[ 42.0% - 42.5% ] 42.23% | 959 | 13.6% |
[ 42.5% - 43.0% ] 42.76% | 1,527 | 28.1% |
[ 43.0% - 43.5% ] 43.41% | 986 | 41.3% |
[ 43.5% - 44.0% ] 43.61% | 133 | 27.1% |
[ 45.0% - 45.5% ] 45.15% | 1,165 | 40.2% |
[ 45.5% - 46.0% ] 45.54% | 303 | 14.5% |
[ 46.0% - 46.5% ] 46.39% | 97 | 71.4% |
[ 46.5% - 47.0% ] 46.51% | 43 | 71.4% |
[ 47.0% - 47.5% ] 47.01% | 134 | 27.3% |
[ 48.0% - 48.5% ] 48.00% | 25 | 100.0% |
[ 48.5% - 49.0% ] 48.84% | 86 | 18.2% |
[ 49.5% - 50.0% ] 49.90% | 497 | 20.4% |
[ 50.0% - 50.5% ] 50.39% | 1,153 | 32.8% |
[ 51.0% - 51.5% ] 51.42% | 1,474 | 14.5% |
[ 52.5% - 53.0% ] 52.51% | 219 | 8.2% |
[ 55.0% - 55.5% ] 55.05% | 218 | 5.1% |
[ 55.5% - 56.0% ] 55.77% | 1,854 | 47.1% |
[ 57.0% - 57.5% ] 57.50% | 40 | 100.0% |
[ 60.0% - 60.5% ] 60.00% | 20 | 100.0% |
[ 64.0% - 64.5% ] 64.21% | 95 | 13.8% |
[ 68.0% - 68.5% ] 68.20% | 239 | 86.3% |
[ 70.0% - 70.5% ] 70.45% | 335 | 86.1% |
[ 73.0% - 73.5% ] 73.33% | 225 | 5.3% |
[ 73.5% - 74.0% ] 73.72% | 137 | 36.8% |
[ 75.5% - 76.0% ] 75.71% | 70 | 100.0% |
[ 82.5% - 83.0% ] 82.74% | 168 | 100.0% |
[ 85.0% - 85.5% ] 85.00% | 40 | 100.0% |