Immigrants from Lithuania 3 or more Vehicles in Household
COMPARE
Immigrants from Lithuania
Select to Compare
3 or more Vehicles in Household
Immigrants from Lithuania 3 or more Vehicles in Household
18.5%
3+ VEHICLES AVAILABLE
5.6/ 100
METRIC RATING
225th/ 347
METRIC RANK
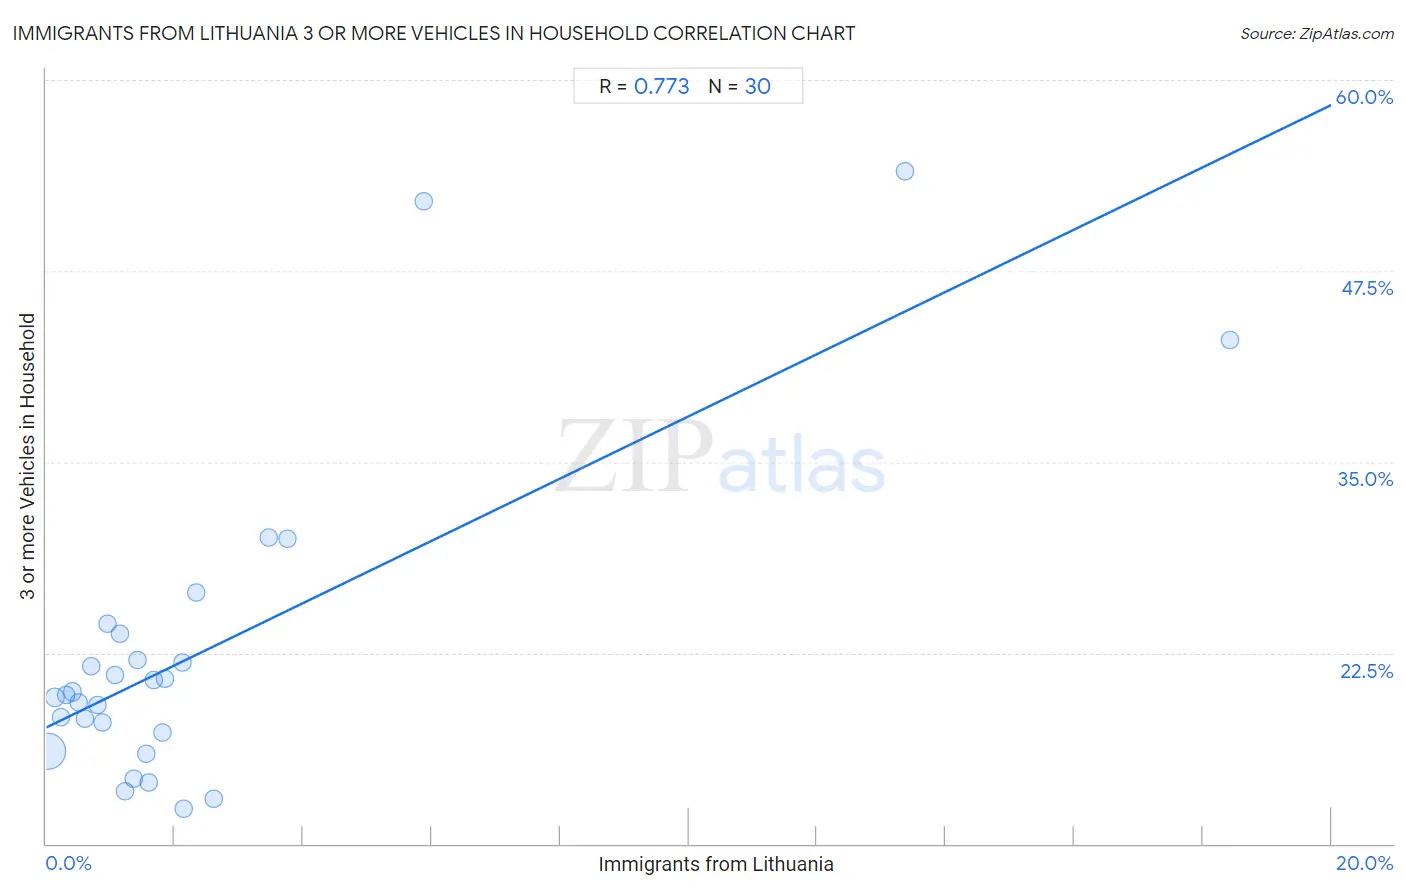
Immigrants from Lithuania 3 or more Vehicles in Household Correlation Chart
The statistical analysis conducted on geographies consisting of 117,713,976 people shows a strong positive correlation between the proportion of Immigrants from Lithuania and percentage of households with 3 or more vehicles available in the United States with a correlation coefficient (R) of 0.773 and weighted average of 18.5%. On average, for every 1% (one percent) increase in Immigrants from Lithuania within a typical geography, there is an increase of 2.0% in percentage of households with 3 or more vehicles available.
It is essential to understand that the correlation between the percentage of Immigrants from Lithuania and percentage of households with 3 or more vehicles available does not imply a direct cause-and-effect relationship. It remains uncertain whether the presence of Immigrants from Lithuania influences an upward or downward trend in the level of percentage of households with 3 or more vehicles available within an area, or if Immigrants from Lithuania simply ended up residing in those areas with higher or lower levels of percentage of households with 3 or more vehicles available due to other factors.
Demographics Similar to Immigrants from Lithuania by 3 or more Vehicles in Household
In terms of 3 or more vehicles in household, the demographic groups most similar to Immigrants from Lithuania are Immigrants from Argentina (18.5%, a difference of 0.010%), Immigrants from Hungary (18.5%, a difference of 0.030%), Immigrants from Singapore (18.4%, a difference of 0.060%), Turkish (18.4%, a difference of 0.080%), and Immigrants from Czechoslovakia (18.5%, a difference of 0.11%).
| Demographics | Rating | Rank | 3 or more Vehicles in Household |
| Immigrants from Portugal | 8.9 /100 | #218 | Tragic 18.6% |
| Immigrants from Armenia | 8.6 /100 | #219 | Tragic 18.6% |
| Nigerians | 7.9 /100 | #220 | Tragic 18.6% |
| Immigrants from Poland | 7.5 /100 | #221 | Tragic 18.6% |
| Belizeans | 7.3 /100 | #222 | Tragic 18.6% |
| Immigrants from Czechoslovakia | 5.9 /100 | #223 | Tragic 18.5% |
| Immigrants from Argentina | 5.6 /100 | #224 | Tragic 18.5% |
| Immigrants from Lithuania | 5.6 /100 | #225 | Tragic 18.5% |
| Immigrants from Hungary | 5.5 /100 | #226 | Tragic 18.5% |
| Immigrants from Singapore | 5.4 /100 | #227 | Tragic 18.4% |
| Turks | 5.4 /100 | #228 | Tragic 18.4% |
| Immigrants from Switzerland | 5.0 /100 | #229 | Tragic 18.4% |
| Immigrants from Western Asia | 4.8 /100 | #230 | Tragic 18.4% |
| Immigrants from Belgium | 4.8 /100 | #231 | Tragic 18.4% |
| Immigrants from Uganda | 4.6 /100 | #232 | Tragic 18.4% |
Immigrants from Lithuania 3 or more Vehicles in Household Correlation Summary
| Measurement | Immigrants from Lithuania Data | 3 or more Vehicles in Household Data |
| Minimum | 0.022% | 12.3% |
| Maximum | 18.4% | 54.1% |
| Range | 18.4% | 41.8% |
| Mean | 2.5% | 22.7% |
| Median | 1.4% | 19.8% |
| Interquartile 25% (IQ1) | 0.69% | 17.3% |
| Interquartile 75% (IQ3) | 2.1% | 23.8% |
| Interquartile Range (IQR) | 1.5% | 6.5% |
| Standard Deviation (Sample) | 3.9% | 10.3% |
| Standard Deviation (Population) | 3.8% | 10.1% |
Correlation Details
| Immigrants from Lithuania Percentile | Sample Size | 3 or more Vehicles in Household |
[ 0.0% - 0.5% ] 0.022% | 102,984,532 | 16.0% |
[ 0.0% - 0.5% ] 0.13% | 8,126,957 | 19.6% |
[ 0.0% - 0.5% ] 0.23% | 3,211,708 | 18.3% |
[ 0.0% - 0.5% ] 0.31% | 1,266,927 | 19.7% |
[ 0.0% - 0.5% ] 0.41% | 561,608 | 19.9% |
[ 0.0% - 0.5% ] 0.50% | 361,539 | 19.2% |
[ 0.5% - 1.0% ] 0.61% | 271,351 | 18.1% |
[ 0.5% - 1.0% ] 0.69% | 192,841 | 21.6% |
[ 0.5% - 1.0% ] 0.80% | 72,017 | 19.1% |
[ 0.5% - 1.0% ] 0.87% | 134,524 | 17.9% |
[ 0.5% - 1.0% ] 0.96% | 19,741 | 24.4% |
[ 1.0% - 1.5% ] 1.06% | 58,904 | 21.0% |
[ 1.0% - 1.5% ] 1.14% | 122,775 | 23.8% |
[ 1.0% - 1.5% ] 1.22% | 6,743 | 13.4% |
[ 1.0% - 1.5% ] 1.36% | 38,572 | 14.2% |
[ 1.0% - 1.5% ] 1.43% | 55,353 | 22.0% |
[ 1.5% - 2.0% ] 1.55% | 28,061 | 15.9% |
[ 1.5% - 2.0% ] 1.59% | 44,406 | 14.0% |
[ 1.5% - 2.0% ] 1.67% | 12,778 | 20.7% |
[ 1.5% - 2.0% ] 1.82% | 16,833 | 17.3% |
[ 1.5% - 2.0% ] 1.85% | 51,206 | 20.8% |
[ 2.0% - 2.5% ] 2.12% | 5,862 | 21.8% |
[ 2.0% - 2.5% ] 2.14% | 10,443 | 12.3% |
[ 2.0% - 2.5% ] 2.33% | 10,268 | 26.5% |
[ 2.5% - 3.0% ] 2.60% | 1,536 | 12.9% |
[ 3.0% - 3.5% ] 3.47% | 26,810 | 30.0% |
[ 3.5% - 4.0% ] 3.76% | 18,533 | 30.0% |
[ 5.5% - 6.0% ] 5.88% | 187 | 52.1% |
[ 13.0% - 13.5% ] 13.36% | 494 | 54.1% |
[ 18.0% - 18.5% ] 18.42% | 467 | 42.9% |