Alaska Native 3 or more Vehicles in Household
COMPARE
Alaska Native
Select to Compare
3 or more Vehicles in Household
Alaska Native 3 or more Vehicles in Household
21.0%
3+ VEHICLES AVAILABLE
98.2/ 100
METRIC RATING
99th/ 347
METRIC RANK
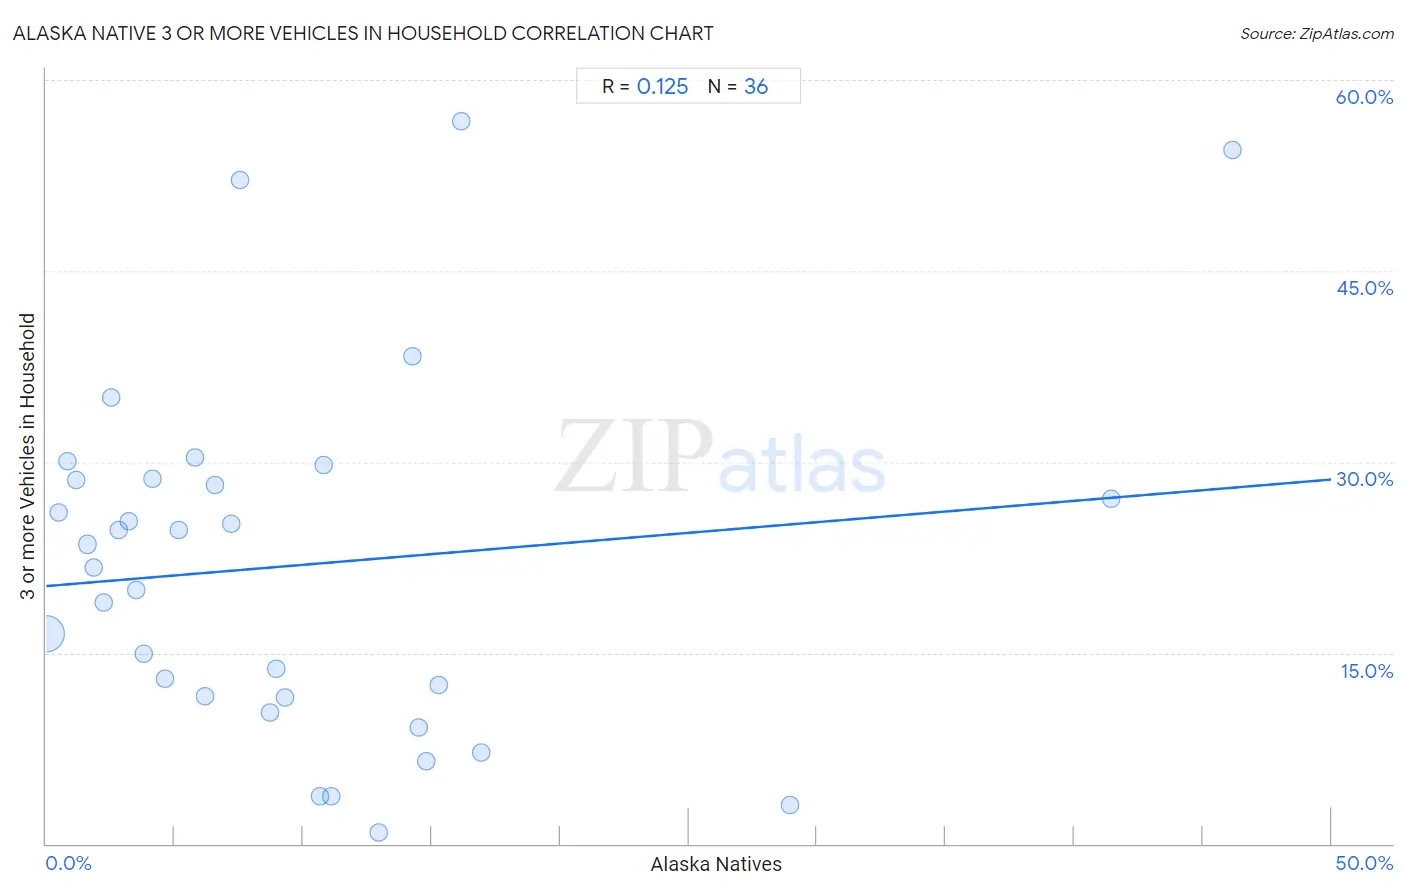
Alaska Native 3 or more Vehicles in Household Correlation Chart
The statistical analysis conducted on geographies consisting of 76,712,110 people shows a poor positive correlation between the proportion of Alaska Natives and percentage of households with 3 or more vehicles available in the United States with a correlation coefficient (R) of 0.125 and weighted average of 21.0%. On average, for every 1% (one percent) increase in Alaska Natives within a typical geography, there is an increase of 0.17% in percentage of households with 3 or more vehicles available.
It is essential to understand that the correlation between the percentage of Alaska Natives and percentage of households with 3 or more vehicles available does not imply a direct cause-and-effect relationship. It remains uncertain whether the presence of Alaska Natives influences an upward or downward trend in the level of percentage of households with 3 or more vehicles available within an area, or if Alaska Natives simply ended up residing in those areas with higher or lower levels of percentage of households with 3 or more vehicles available due to other factors.
Demographics Similar to Alaska Natives by 3 or more Vehicles in Household
In terms of 3 or more vehicles in household, the demographic groups most similar to Alaska Natives are Hmong (21.0%, a difference of 0.0%), Comanche (21.0%, a difference of 0.040%), Canadian (21.0%, a difference of 0.060%), Cree (21.0%, a difference of 0.17%), and Pakistani (21.0%, a difference of 0.26%).
| Demographics | Rating | Rank | 3 or more Vehicles in Household |
| Apache | 98.9 /100 | #92 | Exceptional 21.2% |
| Immigrants from Indonesia | 98.8 /100 | #93 | Exceptional 21.1% |
| Immigrants from Cambodia | 98.6 /100 | #94 | Exceptional 21.1% |
| Pakistanis | 98.5 /100 | #95 | Exceptional 21.0% |
| Cree | 98.4 /100 | #96 | Exceptional 21.0% |
| Canadians | 98.3 /100 | #97 | Exceptional 21.0% |
| Hmong | 98.2 /100 | #98 | Exceptional 21.0% |
| Alaska Natives | 98.2 /100 | #99 | Exceptional 21.0% |
| Comanche | 98.2 /100 | #100 | Exceptional 21.0% |
| Blackfeet | 97.9 /100 | #101 | Exceptional 20.9% |
| Seminole | 97.8 /100 | #102 | Exceptional 20.9% |
| Dutch West Indians | 97.8 /100 | #103 | Exceptional 20.9% |
| Luxembourgers | 97.7 /100 | #104 | Exceptional 20.9% |
| Austrians | 97.5 /100 | #105 | Exceptional 20.9% |
| Bolivians | 97.4 /100 | #106 | Exceptional 20.8% |
Alaska Native 3 or more Vehicles in Household Correlation Summary
| Measurement | Alaska Native Data | 3 or more Vehicles in Household Data |
| Minimum | 0.020% | 0.90% |
| Maximum | 46.2% | 56.7% |
| Range | 46.1% | 55.8% |
| Mean | 9.8% | 21.9% |
| Median | 6.9% | 22.6% |
| Interquartile 25% (IQ1) | 3.0% | 11.5% |
| Interquartile 75% (IQ3) | 13.6% | 28.6% |
| Interquartile Range (IQR) | 10.6% | 17.1% |
| Standard Deviation (Sample) | 10.4% | 13.9% |
| Standard Deviation (Population) | 10.2% | 13.7% |
Correlation Details
| Alaska Native Percentile | Sample Size | 3 or more Vehicles in Household |
[ 0.0% - 0.5% ] 0.020% | 74,731,324 | 16.5% |
[ 0.0% - 0.5% ] 0.47% | 567,223 | 26.1% |
[ 0.5% - 1.0% ] 0.81% | 104,029 | 30.0% |
[ 1.0% - 1.5% ] 1.17% | 157,006 | 28.6% |
[ 1.5% - 2.0% ] 1.61% | 442,122 | 23.5% |
[ 1.5% - 2.0% ] 1.85% | 107,998 | 21.7% |
[ 2.0% - 2.5% ] 2.24% | 135,539 | 18.9% |
[ 2.5% - 3.0% ] 2.55% | 92,962 | 35.0% |
[ 2.5% - 3.0% ] 2.81% | 104,951 | 24.6% |
[ 3.0% - 3.5% ] 3.22% | 57,315 | 25.4% |
[ 3.0% - 3.5% ] 3.48% | 111,079 | 19.9% |
[ 3.5% - 4.0% ] 3.77% | 26,339 | 15.0% |
[ 4.0% - 4.5% ] 4.13% | 31,686 | 28.7% |
[ 4.5% - 5.0% ] 4.61% | 8,394 | 13.0% |
[ 5.0% - 5.5% ] 5.15% | 8,402 | 24.7% |
[ 5.5% - 6.0% ] 5.78% | 329 | 30.4% |
[ 6.0% - 6.5% ] 6.19% | 1,712 | 11.6% |
[ 6.5% - 7.0% ] 6.58% | 471 | 28.2% |
[ 7.0% - 7.5% ] 7.19% | 1,071 | 25.2% |
[ 7.5% - 8.0% ] 7.52% | 439 | 52.1% |
[ 8.5% - 9.0% ] 8.69% | 1,128 | 10.3% |
[ 8.5% - 9.0% ] 8.96% | 2,969 | 13.8% |
[ 9.0% - 9.5% ] 9.29% | 560 | 11.5% |
[ 10.5% - 11.0% ] 10.66% | 544 | 3.7% |
[ 10.5% - 11.0% ] 10.79% | 1,668 | 29.8% |
[ 11.0% - 11.5% ] 11.11% | 144 | 3.7% |
[ 12.5% - 13.0% ] 12.95% | 2,077 | 0.90% |
[ 14.0% - 14.5% ] 14.23% | 843 | 38.3% |
[ 14.5% - 15.0% ] 14.52% | 248 | 9.1% |
[ 14.5% - 15.0% ] 14.78% | 9,863 | 6.5% |
[ 15.0% - 15.5% ] 15.29% | 170 | 12.5% |
[ 16.0% - 16.5% ] 16.13% | 155 | 56.7% |
[ 16.5% - 17.0% ] 16.91% | 272 | 7.1% |
[ 28.5% - 29.0% ] 28.92% | 830 | 3.1% |
[ 41.0% - 41.5% ] 41.44% | 222 | 27.1% |
[ 46.0% - 46.5% ] 46.15% | 26 | 54.5% |