Immigrants from South Central Asia 3 or more Vehicles in Household
COMPARE
Immigrants from South Central Asia
Select to Compare
3 or more Vehicles in Household
Immigrants from South Central Asia 3 or more Vehicles in Household
19.3%
3+ VEHICLES AVAILABLE
38.9/ 100
METRIC RATING
179th/ 347
METRIC RANK
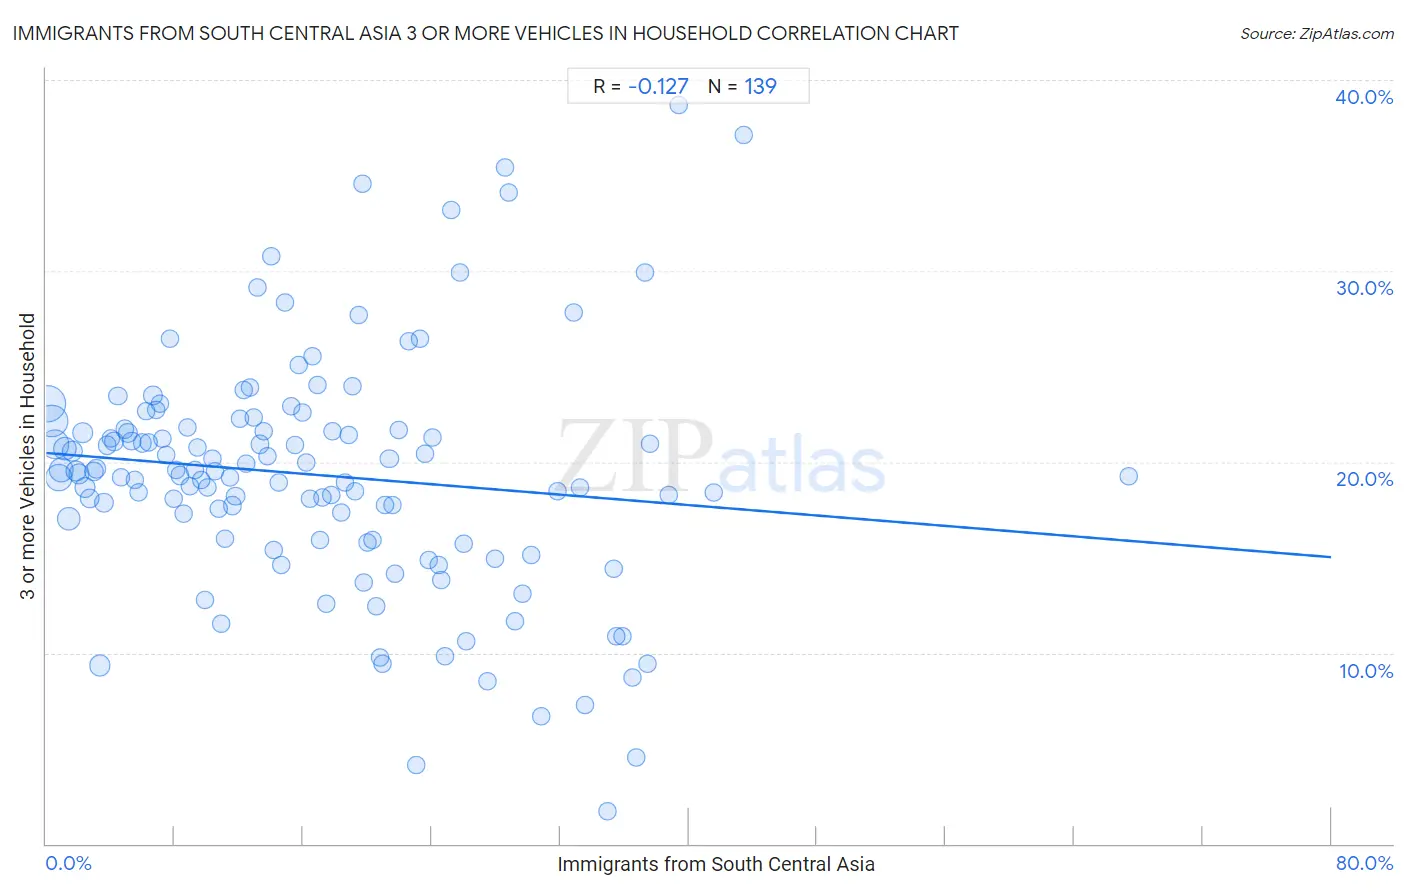
Immigrants from South Central Asia 3 or more Vehicles in Household Correlation Chart
The statistical analysis conducted on geographies consisting of 472,461,759 people shows a poor negative correlation between the proportion of Immigrants from South Central Asia and percentage of households with 3 or more vehicles available in the United States with a correlation coefficient (R) of -0.127 and weighted average of 19.3%. On average, for every 1% (one percent) increase in Immigrants from South Central Asia within a typical geography, there is a decrease of 0.068% in percentage of households with 3 or more vehicles available.
It is essential to understand that the correlation between the percentage of Immigrants from South Central Asia and percentage of households with 3 or more vehicles available does not imply a direct cause-and-effect relationship. It remains uncertain whether the presence of Immigrants from South Central Asia influences an upward or downward trend in the level of percentage of households with 3 or more vehicles available within an area, or if Immigrants from South Central Asia simply ended up residing in those areas with higher or lower levels of percentage of households with 3 or more vehicles available due to other factors.
Demographics Similar to Immigrants from South Central Asia by 3 or more Vehicles in Household
In terms of 3 or more vehicles in household, the demographic groups most similar to Immigrants from South Central Asia are Immigrants from Syria (19.4%, a difference of 0.11%), South African (19.3%, a difference of 0.11%), Romanian (19.3%, a difference of 0.15%), Immigrants from Peru (19.4%, a difference of 0.17%), and Cuban (19.3%, a difference of 0.19%).
| Demographics | Rating | Rank | 3 or more Vehicles in Household |
| Kiowa | 50.9 /100 | #172 | Average 19.5% |
| Immigrants from Northern Europe | 50.2 /100 | #173 | Average 19.5% |
| Immigrants from South Africa | 50.0 /100 | #174 | Average 19.5% |
| Syrians | 47.0 /100 | #175 | Average 19.5% |
| Iroquois | 46.0 /100 | #176 | Average 19.4% |
| Immigrants from Peru | 41.1 /100 | #177 | Average 19.4% |
| Immigrants from Syria | 40.3 /100 | #178 | Average 19.4% |
| Immigrants from South Central Asia | 38.9 /100 | #179 | Fair 19.3% |
| South Africans | 37.5 /100 | #180 | Fair 19.3% |
| Romanians | 37.1 /100 | #181 | Fair 19.3% |
| Cubans | 36.6 /100 | #182 | Fair 19.3% |
| Cajuns | 36.0 /100 | #183 | Fair 19.3% |
| Latvians | 35.7 /100 | #184 | Fair 19.3% |
| Immigrants from Sri Lanka | 30.7 /100 | #185 | Fair 19.2% |
| Immigrants from Sweden | 29.0 /100 | #186 | Fair 19.2% |
Immigrants from South Central Asia 3 or more Vehicles in Household Correlation Summary
| Measurement | Immigrants from South Central Asia Data | 3 or more Vehicles in Household Data |
| Minimum | 0.11% | 1.7% |
| Maximum | 67.4% | 38.7% |
| Range | 67.3% | 37.0% |
| Mean | 16.8% | 19.3% |
| Median | 15.3% | 19.5% |
| Interquartile 25% (IQ1) | 7.5% | 15.9% |
| Interquartile 75% (IQ3) | 23.8% | 21.7% |
| Interquartile Range (IQR) | 16.3% | 5.8% |
| Standard Deviation (Sample) | 11.7% | 6.3% |
| Standard Deviation (Population) | 11.6% | 6.2% |
Correlation Details
| Immigrants from South Central Asia Percentile | Sample Size | 3 or more Vehicles in Household |
[ 0.0% - 0.5% ] 0.11% | 90,360,063 | 23.1% |
[ 0.0% - 0.5% ] 0.32% | 68,664,234 | 22.1% |
[ 0.5% - 1.0% ] 0.54% | 49,020,561 | 20.9% |
[ 0.5% - 1.0% ] 0.76% | 41,221,287 | 19.2% |
[ 0.5% - 1.0% ] 0.97% | 30,051,190 | 19.6% |
[ 1.0% - 1.5% ] 1.18% | 25,061,382 | 20.7% |
[ 1.0% - 1.5% ] 1.41% | 24,190,801 | 17.0% |
[ 1.5% - 2.0% ] 1.63% | 13,014,762 | 20.6% |
[ 1.5% - 2.0% ] 1.85% | 13,783,210 | 19.5% |
[ 2.0% - 2.5% ] 2.06% | 10,302,611 | 19.4% |
[ 2.0% - 2.5% ] 2.27% | 9,896,989 | 21.5% |
[ 2.0% - 2.5% ] 2.45% | 11,774,122 | 18.6% |
[ 2.5% - 3.0% ] 2.70% | 8,790,725 | 18.1% |
[ 2.5% - 3.0% ] 2.94% | 4,614,483 | 19.5% |
[ 3.0% - 3.5% ] 3.15% | 5,812,482 | 19.6% |
[ 3.0% - 3.5% ] 3.34% | 13,233,554 | 9.3% |
[ 3.5% - 4.0% ] 3.58% | 3,929,957 | 17.9% |
[ 3.5% - 4.0% ] 3.79% | 3,276,338 | 20.9% |
[ 4.0% - 4.5% ] 4.01% | 3,224,223 | 21.2% |
[ 4.0% - 4.5% ] 4.22% | 3,513,368 | 21.1% |
[ 4.0% - 4.5% ] 4.45% | 2,573,476 | 23.5% |
[ 4.5% - 5.0% ] 4.65% | 2,018,569 | 19.2% |
[ 4.5% - 5.0% ] 4.89% | 1,951,992 | 21.7% |
[ 5.0% - 5.5% ] 5.09% | 2,216,907 | 21.5% |
[ 5.0% - 5.5% ] 5.32% | 1,893,872 | 21.1% |
[ 5.5% - 6.0% ] 5.53% | 1,184,101 | 19.1% |
[ 5.5% - 6.0% ] 5.75% | 1,433,832 | 18.4% |
[ 5.5% - 6.0% ] 5.97% | 1,349,664 | 21.0% |
[ 6.0% - 6.5% ] 6.19% | 1,060,839 | 22.6% |
[ 6.0% - 6.5% ] 6.37% | 735,197 | 21.0% |
[ 6.5% - 7.0% ] 6.64% | 1,862,035 | 23.5% |
[ 6.5% - 7.0% ] 6.82% | 755,220 | 22.7% |
[ 7.0% - 7.5% ] 7.06% | 771,714 | 23.1% |
[ 7.0% - 7.5% ] 7.24% | 486,495 | 21.2% |
[ 7.0% - 7.5% ] 7.48% | 599,420 | 20.4% |
[ 7.5% - 8.0% ] 7.69% | 554,193 | 26.4% |
[ 7.5% - 8.0% ] 7.94% | 554,475 | 18.1% |
[ 8.0% - 8.5% ] 8.13% | 395,200 | 19.6% |
[ 8.0% - 8.5% ] 8.34% | 1,170,614 | 19.3% |
[ 8.5% - 9.0% ] 8.55% | 831,629 | 17.3% |
[ 8.5% - 9.0% ] 8.77% | 729,360 | 21.8% |
[ 8.5% - 9.0% ] 8.96% | 418,342 | 18.7% |
[ 9.0% - 9.5% ] 9.22% | 718,541 | 19.6% |
[ 9.0% - 9.5% ] 9.41% | 360,910 | 20.8% |
[ 9.5% - 10.0% ] 9.67% | 556,611 | 19.1% |
[ 9.5% - 10.0% ] 9.86% | 413,634 | 12.8% |
[ 10.0% - 10.5% ] 10.06% | 516,387 | 18.6% |
[ 10.0% - 10.5% ] 10.33% | 806,876 | 20.2% |
[ 10.5% - 11.0% ] 10.53% | 315,843 | 19.5% |
[ 10.5% - 11.0% ] 10.72% | 178,081 | 17.5% |
[ 10.5% - 11.0% ] 10.92% | 616,482 | 11.5% |
[ 11.0% - 11.5% ] 11.14% | 163,662 | 16.0% |
[ 11.0% - 11.5% ] 11.40% | 162,669 | 19.2% |
[ 11.5% - 12.0% ] 11.62% | 619,845 | 17.7% |
[ 11.5% - 12.0% ] 11.79% | 531,443 | 18.2% |
[ 12.0% - 12.5% ] 12.09% | 258,290 | 22.3% |
[ 12.0% - 12.5% ] 12.29% | 269,322 | 23.8% |
[ 12.0% - 12.5% ] 12.48% | 474,103 | 19.9% |
[ 12.5% - 13.0% ] 12.67% | 251,377 | 23.9% |
[ 12.5% - 13.0% ] 12.93% | 186,706 | 22.3% |
[ 13.0% - 13.5% ] 13.12% | 182,626 | 29.1% |
[ 13.0% - 13.5% ] 13.30% | 223,300 | 20.9% |
[ 13.5% - 14.0% ] 13.55% | 181,618 | 21.6% |
[ 13.5% - 14.0% ] 13.77% | 413,804 | 20.3% |
[ 13.5% - 14.0% ] 14.00% | 50,575 | 30.8% |
[ 14.0% - 14.5% ] 14.20% | 65,603 | 15.4% |
[ 14.0% - 14.5% ] 14.44% | 138,426 | 18.9% |
[ 14.5% - 15.0% ] 14.66% | 332,921 | 14.6% |
[ 14.5% - 15.0% ] 14.82% | 63,656 | 28.3% |
[ 15.0% - 15.5% ] 15.29% | 84,118 | 22.9% |
[ 15.0% - 15.5% ] 15.45% | 264,144 | 20.9% |
[ 15.5% - 16.0% ] 15.74% | 159,820 | 25.1% |
[ 15.5% - 16.0% ] 15.94% | 132,103 | 22.6% |
[ 16.0% - 16.5% ] 16.16% | 254,593 | 20.0% |
[ 16.0% - 16.5% ] 16.42% | 112,519 | 18.1% |
[ 16.5% - 17.0% ] 16.56% | 113,686 | 25.6% |
[ 16.5% - 17.0% ] 16.89% | 180,194 | 24.0% |
[ 17.0% - 17.5% ] 17.08% | 22,030 | 15.9% |
[ 17.0% - 17.5% ] 17.23% | 272,834 | 18.1% |
[ 17.0% - 17.5% ] 17.44% | 16,679 | 12.6% |
[ 17.5% - 18.0% ] 17.73% | 215,024 | 18.3% |
[ 17.5% - 18.0% ] 17.83% | 131,797 | 21.6% |
[ 18.0% - 18.5% ] 18.37% | 6,272 | 17.4% |
[ 18.5% - 19.0% ] 18.57% | 30,578 | 18.9% |
[ 18.5% - 19.0% ] 18.81% | 153,563 | 21.4% |
[ 19.0% - 19.5% ] 19.03% | 129,604 | 24.0% |
[ 19.0% - 19.5% ] 19.20% | 149,814 | 18.4% |
[ 19.0% - 19.5% ] 19.42% | 11,603 | 27.7% |
[ 19.5% - 20.0% ] 19.69% | 13,297 | 34.6% |
[ 19.5% - 20.0% ] 19.77% | 21,152 | 13.7% |
[ 20.0% - 20.5% ] 20.01% | 51,902 | 15.8% |
[ 20.0% - 20.5% ] 20.33% | 22,831 | 15.9% |
[ 20.5% - 21.0% ] 20.51% | 68,761 | 12.4% |
[ 20.5% - 21.0% ] 20.77% | 33,513 | 9.8% |
[ 20.5% - 21.0% ] 20.92% | 14,804 | 9.4% |
[ 21.0% - 21.5% ] 21.09% | 127,930 | 17.7% |
[ 21.0% - 21.5% ] 21.36% | 210,788 | 20.2% |
[ 21.5% - 22.0% ] 21.54% | 1,207 | 17.7% |
[ 21.5% - 22.0% ] 21.72% | 24,229 | 14.2% |
[ 21.5% - 22.0% ] 21.98% | 74,839 | 21.6% |
[ 22.5% - 23.0% ] 22.57% | 228,795 | 26.3% |
[ 22.5% - 23.0% ] 23.00% | 64,268 | 4.1% |
[ 23.0% - 23.5% ] 23.28% | 37,671 | 26.5% |
[ 23.5% - 24.0% ] 23.60% | 88,402 | 20.4% |
[ 23.5% - 24.0% ] 23.79% | 50,125 | 14.9% |
[ 24.0% - 24.5% ] 24.06% | 22,796 | 21.3% |
[ 24.0% - 24.5% ] 24.46% | 8,257 | 14.6% |
[ 24.5% - 25.0% ] 24.58% | 38,567 | 13.8% |
[ 24.5% - 25.0% ] 24.81% | 37,194 | 9.8% |
[ 25.0% - 25.5% ] 25.19% | 53,464 | 33.2% |
[ 25.5% - 26.0% ] 25.72% | 5,206 | 29.9% |
[ 25.5% - 26.0% ] 25.98% | 42,760 | 15.7% |
[ 26.0% - 26.5% ] 26.16% | 44,127 | 10.6% |
[ 27.0% - 27.5% ] 27.46% | 5,018 | 8.5% |
[ 27.5% - 28.0% ] 27.96% | 15,702 | 14.9% |
[ 28.5% - 29.0% ] 28.55% | 802 | 35.4% |
[ 28.5% - 29.0% ] 28.80% | 184 | 34.1% |
[ 29.0% - 29.5% ] 29.17% | 3,695 | 11.7% |
[ 29.5% - 30.0% ] 29.66% | 5,867 | 13.1% |
[ 30.0% - 30.5% ] 30.21% | 18,068 | 15.1% |
[ 30.5% - 31.0% ] 30.78% | 2,560 | 6.7% |
[ 31.5% - 32.0% ] 31.85% | 16,722 | 18.4% |
[ 32.5% - 33.0% ] 32.84% | 341 | 27.8% |
[ 33.0% - 33.5% ] 33.22% | 20,264 | 18.6% |
[ 33.5% - 34.0% ] 33.51% | 37,689 | 7.3% |
[ 34.5% - 35.0% ] 34.92% | 733 | 1.7% |
[ 35.0% - 35.5% ] 35.30% | 1,425 | 14.4% |
[ 35.0% - 35.5% ] 35.50% | 20,693 | 10.8% |
[ 35.5% - 36.0% ] 35.86% | 15,585 | 10.9% |
[ 36.0% - 36.5% ] 36.48% | 2,300 | 8.7% |
[ 36.5% - 37.0% ] 36.72% | 1,999 | 4.5% |
[ 37.0% - 37.5% ] 37.30% | 2,241 | 29.9% |
[ 37.0% - 37.5% ] 37.40% | 44,570 | 9.4% |
[ 37.5% - 38.0% ] 37.56% | 39,565 | 20.9% |
[ 38.5% - 39.0% ] 38.78% | 37,022 | 18.3% |
[ 39.0% - 39.5% ] 39.38% | 1,153 | 38.7% |
[ 41.5% - 42.0% ] 41.58% | 2,549 | 18.4% |
[ 43.0% - 43.5% ] 43.40% | 212 | 37.1% |
[ 67.0% - 67.5% ] 67.38% | 141 | 19.2% |