Tlingit-Haida Ambulatory Disability
COMPARE
Tlingit-Haida
Select to Compare
Ambulatory Disability
Tlingit-Haida Ambulatory Disability
6.5%
AMBULATORY DISABILITY
1.5/ 100
METRIC RATING
245th/ 347
METRIC RANK
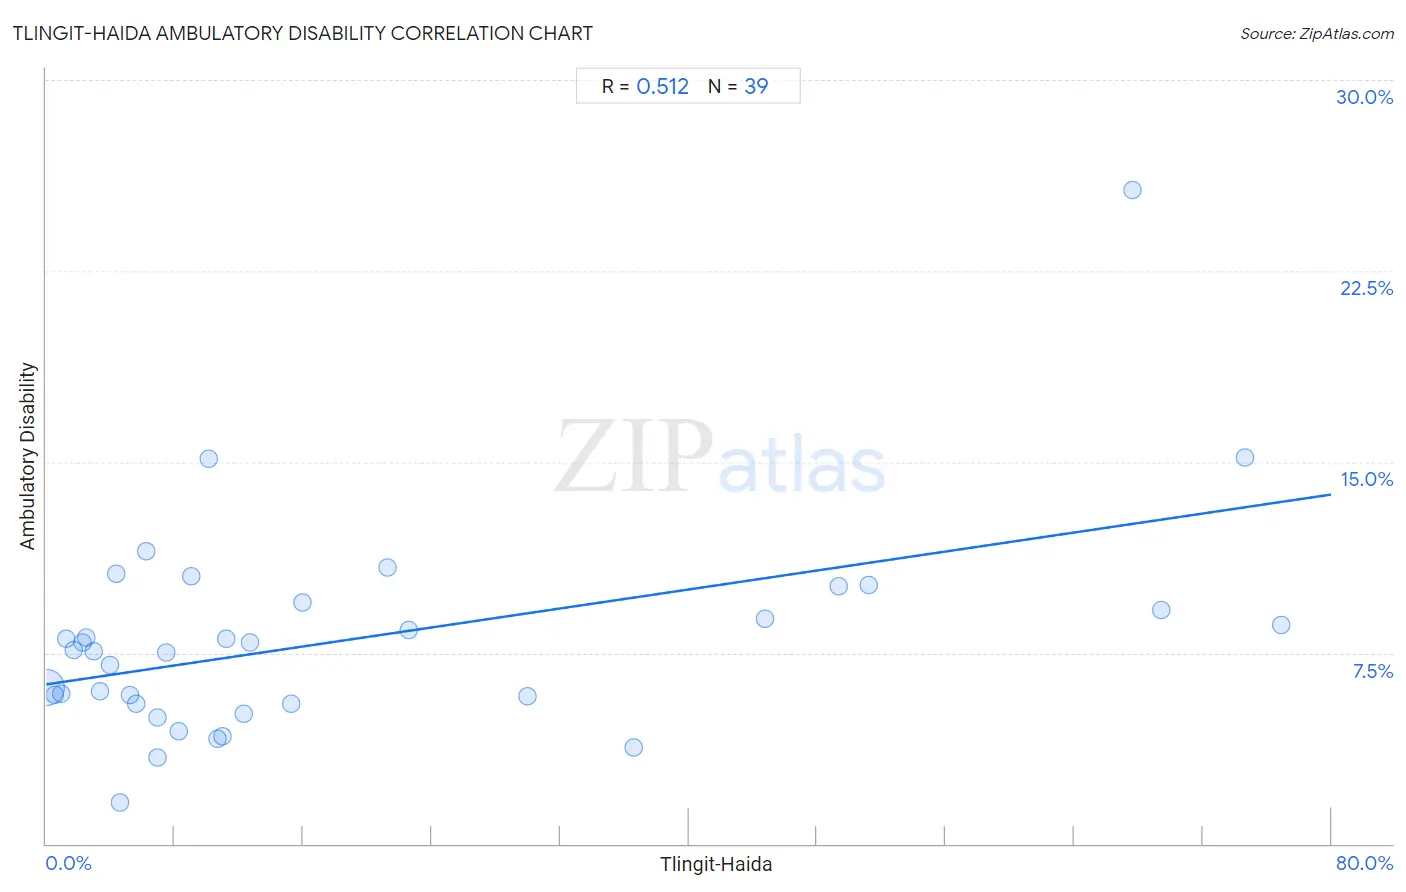
Tlingit-Haida Ambulatory Disability Correlation Chart
The statistical analysis conducted on geographies consisting of 60,848,336 people shows a substantial positive correlation between the proportion of Tlingit-Haida and percentage of population with ambulatory disability in the United States with a correlation coefficient (R) of 0.512 and weighted average of 6.5%. On average, for every 1% (one percent) increase in Tlingit-Haida within a typical geography, there is an increase of 0.093% in percentage of population with ambulatory disability.
It is essential to understand that the correlation between the percentage of Tlingit-Haida and percentage of population with ambulatory disability does not imply a direct cause-and-effect relationship. It remains uncertain whether the presence of Tlingit-Haida influences an upward or downward trend in the level of percentage of population with ambulatory disability within an area, or if Tlingit-Haida simply ended up residing in those areas with higher or lower levels of percentage of population with ambulatory disability due to other factors.
Demographics Similar to Tlingit-Haida by Ambulatory Disability
In terms of ambulatory disability, the demographic groups most similar to Tlingit-Haida are Armenian (6.5%, a difference of 0.020%), Immigrants from Panama (6.5%, a difference of 0.030%), German (6.5%, a difference of 0.040%), Spaniard (6.5%, a difference of 0.060%), and Immigrants from Cuba (6.5%, a difference of 0.070%).
| Demographics | Rating | Rank | Ambulatory Disability |
| Haitians | 1.8 /100 | #238 | Tragic 6.4% |
| Senegalese | 1.7 /100 | #239 | Tragic 6.4% |
| Immigrants from Senegal | 1.7 /100 | #240 | Tragic 6.4% |
| Immigrants from Haiti | 1.6 /100 | #241 | Tragic 6.5% |
| Spaniards | 1.6 /100 | #242 | Tragic 6.5% |
| Germans | 1.5 /100 | #243 | Tragic 6.5% |
| Immigrants from Panama | 1.5 /100 | #244 | Tragic 6.5% |
| Tlingit-Haida | 1.5 /100 | #245 | Tragic 6.5% |
| Armenians | 1.5 /100 | #246 | Tragic 6.5% |
| Immigrants from Cuba | 1.4 /100 | #247 | Tragic 6.5% |
| Immigrants from Portugal | 1.4 /100 | #248 | Tragic 6.5% |
| Native Hawaiians | 1.1 /100 | #249 | Tragic 6.5% |
| Chinese | 1.0 /100 | #250 | Tragic 6.5% |
| Hawaiians | 0.9 /100 | #251 | Tragic 6.5% |
| Immigrants from Bahamas | 0.8 /100 | #252 | Tragic 6.5% |
Tlingit-Haida Ambulatory Disability Correlation Summary
| Measurement | Tlingit-Haida Data | Ambulatory Disability Data |
| Minimum | 0.036% | 1.6% |
| Maximum | 76.8% | 25.7% |
| Range | 76.8% | 24.0% |
| Mean | 18.6% | 8.0% |
| Median | 9.0% | 7.6% |
| Interquartile 25% (IQ1) | 4.0% | 5.5% |
| Interquartile 75% (IQ3) | 22.6% | 9.5% |
| Interquartile Range (IQR) | 18.6% | 4.0% |
| Standard Deviation (Sample) | 22.5% | 4.1% |
| Standard Deviation (Population) | 22.3% | 4.1% |
Correlation Details
| Tlingit-Haida Percentile | Sample Size | Ambulatory Disability |
[ 0.0% - 0.5% ] 0.036% | 59,014,053 | 6.1% |
[ 0.5% - 1.0% ] 0.54% | 1,312,339 | 5.8% |
[ 0.5% - 1.0% ] 0.91% | 247,818 | 5.9% |
[ 1.0% - 1.5% ] 1.23% | 82,812 | 8.1% |
[ 1.5% - 2.0% ] 1.71% | 25,685 | 7.6% |
[ 2.0% - 2.5% ] 2.28% | 8,447 | 7.9% |
[ 2.0% - 2.5% ] 2.46% | 3,821 | 8.1% |
[ 2.5% - 3.0% ] 2.92% | 6,231 | 7.6% |
[ 3.0% - 3.5% ] 3.33% | 10,388 | 6.0% |
[ 3.5% - 4.0% ] 3.97% | 1,964 | 7.0% |
[ 4.0% - 4.5% ] 4.35% | 115 | 10.6% |
[ 4.5% - 5.0% ] 4.62% | 822 | 1.6% |
[ 5.0% - 5.5% ] 5.24% | 420 | 5.8% |
[ 5.5% - 6.0% ] 5.62% | 1,762 | 5.5% |
[ 6.0% - 6.5% ] 6.21% | 177 | 11.5% |
[ 6.5% - 7.0% ] 6.91% | 564 | 3.4% |
[ 6.5% - 7.0% ] 6.94% | 2,146 | 5.0% |
[ 7.0% - 7.5% ] 7.50% | 40 | 7.5% |
[ 8.0% - 8.5% ] 8.22% | 146 | 4.4% |
[ 8.5% - 9.0% ] 9.00% | 6,691 | 10.5% |
[ 10.0% - 10.5% ] 10.13% | 2,902 | 15.1% |
[ 10.5% - 11.0% ] 10.70% | 29,933 | 4.1% |
[ 11.0% - 11.5% ] 11.00% | 32,108 | 4.2% |
[ 11.0% - 11.5% ] 11.18% | 13,913 | 8.0% |
[ 12.0% - 12.5% ] 12.26% | 18,041 | 5.1% |
[ 12.5% - 13.0% ] 12.67% | 8,168 | 7.9% |
[ 15.0% - 15.5% ] 15.26% | 2,169 | 5.5% |
[ 15.5% - 16.0% ] 15.92% | 1,727 | 9.5% |
[ 21.0% - 21.5% ] 21.23% | 4,267 | 10.9% |
[ 22.5% - 23.0% ] 22.55% | 1,073 | 8.4% |
[ 29.5% - 30.0% ] 29.96% | 1,128 | 5.8% |
[ 36.5% - 37.0% ] 36.59% | 82 | 3.8% |
[ 44.5% - 45.0% ] 44.78% | 920 | 8.8% |
[ 49.0% - 49.5% ] 49.33% | 1,792 | 10.1% |
[ 51.0% - 51.5% ] 51.24% | 804 | 10.2% |
[ 67.5% - 68.0% ] 67.59% | 361 | 25.7% |
[ 69.0% - 69.5% ] 69.41% | 1,602 | 9.2% |
[ 74.5% - 75.0% ] 74.63% | 67 | 15.2% |
[ 76.5% - 77.0% ] 76.85% | 838 | 8.6% |