Swiss 3 or more Vehicles in Household
COMPARE
Swiss
Select to Compare
3 or more Vehicles in Household
Swiss 3 or more Vehicles in Household
23.0%
3+ VEHICLES AVAILABLE
100.0/ 100
METRIC RATING
34th/ 347
METRIC RANK
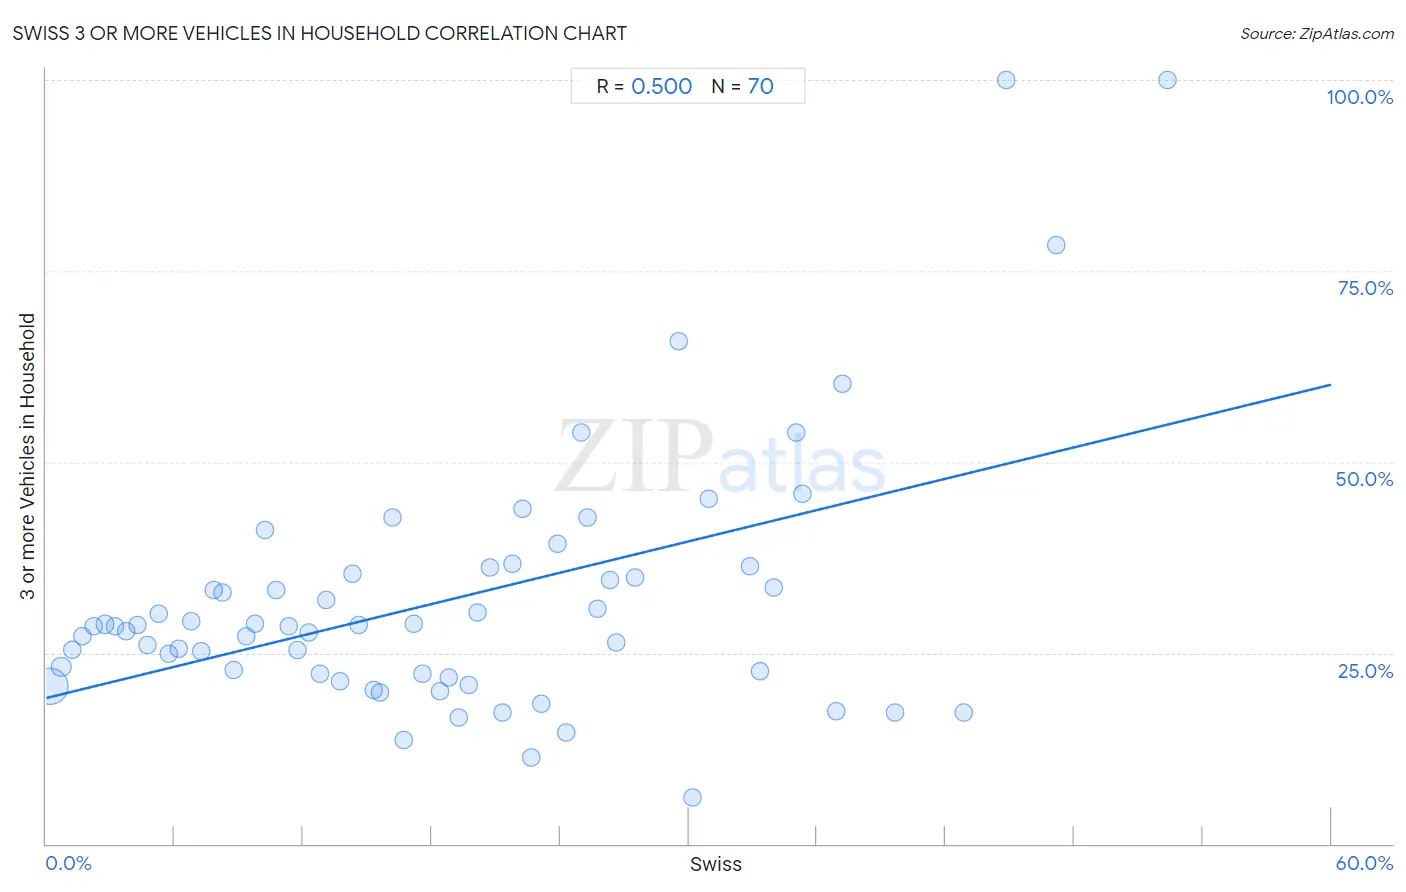
Swiss 3 or more Vehicles in Household Correlation Chart
The statistical analysis conducted on geographies consisting of 464,647,007 people shows a moderate positive correlation between the proportion of Swiss and percentage of households with 3 or more vehicles available in the United States with a correlation coefficient (R) of 0.500 and weighted average of 23.0%. On average, for every 1% (one percent) increase in Swiss within a typical geography, there is an increase of 0.68% in percentage of households with 3 or more vehicles available.
It is essential to understand that the correlation between the percentage of Swiss and percentage of households with 3 or more vehicles available does not imply a direct cause-and-effect relationship. It remains uncertain whether the presence of Swiss influences an upward or downward trend in the level of percentage of households with 3 or more vehicles available within an area, or if Swiss simply ended up residing in those areas with higher or lower levels of percentage of households with 3 or more vehicles available due to other factors.
Demographics Similar to Swiss by 3 or more Vehicles in Household
In terms of 3 or more vehicles in household, the demographic groups most similar to Swiss are Choctaw (23.0%, a difference of 0.020%), Spanish American (23.0%, a difference of 0.050%), Cherokee (23.0%, a difference of 0.060%), Swedish (23.0%, a difference of 0.080%), and Pueblo (23.0%, a difference of 0.11%).
| Demographics | Rating | Rank | 3 or more Vehicles in Household |
| Guamanians/Chamorros | 100.0 /100 | #27 | Exceptional 23.2% |
| Lumbee | 100.0 /100 | #28 | Exceptional 23.1% |
| Spanish | 100.0 /100 | #29 | Exceptional 23.1% |
| Immigrants from South Eastern Asia | 100.0 /100 | #30 | Exceptional 23.1% |
| English | 100.0 /100 | #31 | Exceptional 23.1% |
| Pueblo | 100.0 /100 | #32 | Exceptional 23.0% |
| Spanish Americans | 100.0 /100 | #33 | Exceptional 23.0% |
| Swiss | 100.0 /100 | #34 | Exceptional 23.0% |
| Choctaw | 100.0 /100 | #35 | Exceptional 23.0% |
| Cherokee | 100.0 /100 | #36 | Exceptional 23.0% |
| Swedes | 100.0 /100 | #37 | Exceptional 23.0% |
| Dutch | 100.0 /100 | #38 | Exceptional 22.9% |
| Yaqui | 100.0 /100 | #39 | Exceptional 22.9% |
| Europeans | 100.0 /100 | #40 | Exceptional 22.9% |
| Germans | 100.0 /100 | #41 | Exceptional 22.7% |
Swiss 3 or more Vehicles in Household Correlation Summary
| Measurement | Swiss Data | 3 or more Vehicles in Household Data |
| Minimum | 0.18% | 6.1% |
| Maximum | 52.4% | 100.0% |
| Range | 52.2% | 93.9% |
| Mean | 18.8% | 31.9% |
| Median | 17.4% | 28.5% |
| Interquartile 25% (IQ1) | 8.7% | 22.3% |
| Interquartile 75% (IQ3) | 26.3% | 35.4% |
| Interquartile Range (IQR) | 17.6% | 13.1% |
| Standard Deviation (Sample) | 12.5% | 17.1% |
| Standard Deviation (Population) | 12.4% | 17.0% |
Correlation Details
| Swiss Percentile | Sample Size | 3 or more Vehicles in Household |
[ 0.0% - 0.5% ] 0.18% | 392,937,886 | 20.6% |
[ 0.5% - 1.0% ] 0.68% | 51,800,393 | 23.2% |
[ 1.0% - 1.5% ] 1.21% | 10,702,804 | 25.4% |
[ 1.5% - 2.0% ] 1.70% | 3,741,131 | 27.2% |
[ 2.0% - 2.5% ] 2.20% | 1,690,875 | 28.5% |
[ 2.5% - 3.0% ] 2.72% | 1,150,840 | 28.7% |
[ 3.0% - 3.5% ] 3.20% | 673,137 | 28.5% |
[ 3.5% - 4.0% ] 3.73% | 433,678 | 27.8% |
[ 4.0% - 4.5% ] 4.24% | 247,539 | 28.6% |
[ 4.5% - 5.0% ] 4.74% | 209,936 | 26.0% |
[ 5.0% - 5.5% ] 5.25% | 135,768 | 30.2% |
[ 5.5% - 6.0% ] 5.73% | 190,662 | 24.9% |
[ 6.0% - 6.5% ] 6.20% | 129,927 | 25.5% |
[ 6.5% - 7.0% ] 6.74% | 63,207 | 29.1% |
[ 7.0% - 7.5% ] 7.26% | 113,420 | 25.2% |
[ 7.5% - 8.0% ] 7.80% | 31,415 | 33.3% |
[ 8.0% - 8.5% ] 8.22% | 37,194 | 32.8% |
[ 8.5% - 9.0% ] 8.74% | 36,032 | 22.8% |
[ 9.0% - 9.5% ] 9.34% | 44,656 | 27.2% |
[ 9.5% - 10.0% ] 9.76% | 25,290 | 28.8% |
[ 10.0% - 10.5% ] 10.23% | 9,161 | 41.1% |
[ 10.5% - 11.0% ] 10.73% | 39,413 | 33.2% |
[ 11.0% - 11.5% ] 11.35% | 30,408 | 28.4% |
[ 11.5% - 12.0% ] 11.72% | 8,266 | 25.4% |
[ 12.0% - 12.5% ] 12.27% | 12,387 | 27.7% |
[ 12.5% - 13.0% ] 12.78% | 10,247 | 22.3% |
[ 13.0% - 13.5% ] 13.10% | 8,899 | 31.9% |
[ 13.5% - 14.0% ] 13.72% | 11,492 | 21.3% |
[ 14.0% - 14.5% ] 14.29% | 7,035 | 35.4% |
[ 14.5% - 15.0% ] 14.62% | 9,236 | 28.7% |
[ 15.0% - 15.5% ] 15.31% | 9,777 | 20.2% |
[ 15.5% - 16.0% ] 15.57% | 4,786 | 19.8% |
[ 16.0% - 16.5% ] 16.14% | 2,850 | 42.7% |
[ 16.5% - 17.0% ] 16.67% | 8,894 | 13.6% |
[ 17.0% - 17.5% ] 17.18% | 1,100 | 28.9% |
[ 17.5% - 18.0% ] 17.58% | 3,266 | 22.3% |
[ 18.0% - 18.5% ] 18.36% | 12,767 | 19.9% |
[ 18.5% - 19.0% ] 18.82% | 15,336 | 21.8% |
[ 19.0% - 19.5% ] 19.26% | 2,965 | 16.6% |
[ 19.5% - 20.0% ] 19.73% | 12,856 | 20.8% |
[ 20.0% - 20.5% ] 20.11% | 5,072 | 30.3% |
[ 20.5% - 21.0% ] 20.74% | 2,430 | 36.2% |
[ 21.0% - 21.5% ] 21.28% | 860 | 17.2% |
[ 21.5% - 22.0% ] 21.75% | 3,489 | 36.7% |
[ 22.0% - 22.5% ] 22.22% | 513 | 43.9% |
[ 22.5% - 23.0% ] 22.66% | 128 | 11.3% |
[ 23.0% - 23.5% ] 23.12% | 1,514 | 18.3% |
[ 23.5% - 24.0% ] 23.90% | 3,151 | 39.3% |
[ 24.0% - 24.5% ] 24.30% | 461 | 14.6% |
[ 25.0% - 25.5% ] 25.00% | 328 | 53.8% |
[ 25.0% - 25.5% ] 25.29% | 601 | 42.8% |
[ 25.5% - 26.0% ] 25.73% | 2,274 | 30.8% |
[ 26.0% - 26.5% ] 26.33% | 1,409 | 34.5% |
[ 26.5% - 27.0% ] 26.64% | 1,310 | 26.4% |
[ 27.0% - 27.5% ] 27.50% | 80 | 34.8% |
[ 29.5% - 30.0% ] 29.55% | 247 | 65.8% |
[ 30.0% - 30.5% ] 30.19% | 361 | 6.1% |
[ 30.5% - 31.0% ] 30.94% | 278 | 45.2% |
[ 32.5% - 33.0% ] 32.88% | 222 | 36.4% |
[ 33.0% - 33.5% ] 33.33% | 279 | 22.5% |
[ 33.5% - 34.0% ] 33.95% | 1,302 | 33.5% |
[ 35.0% - 35.5% ] 35.00% | 40 | 53.8% |
[ 35.0% - 35.5% ] 35.32% | 201 | 45.8% |
[ 36.5% - 37.0% ] 36.87% | 651 | 17.3% |
[ 37.0% - 37.5% ] 37.20% | 2,016 | 60.2% |
[ 39.5% - 40.0% ] 39.60% | 404 | 17.2% |
[ 42.5% - 43.0% ] 42.86% | 56 | 17.2% |
[ 44.5% - 45.0% ] 44.83% | 58 | 100.0% |
[ 47.0% - 47.5% ] 47.19% | 320 | 78.3% |
[ 52.0% - 52.5% ] 52.38% | 21 | 100.0% |