Immigrants from Hungary 3 or more Vehicles in Household
COMPARE
Immigrants from Hungary
Select to Compare
3 or more Vehicles in Household
Immigrants from Hungary 3 or more Vehicles in Household
18.5%
3+ VEHICLES AVAILABLE
5.5/ 100
METRIC RATING
226th/ 347
METRIC RANK
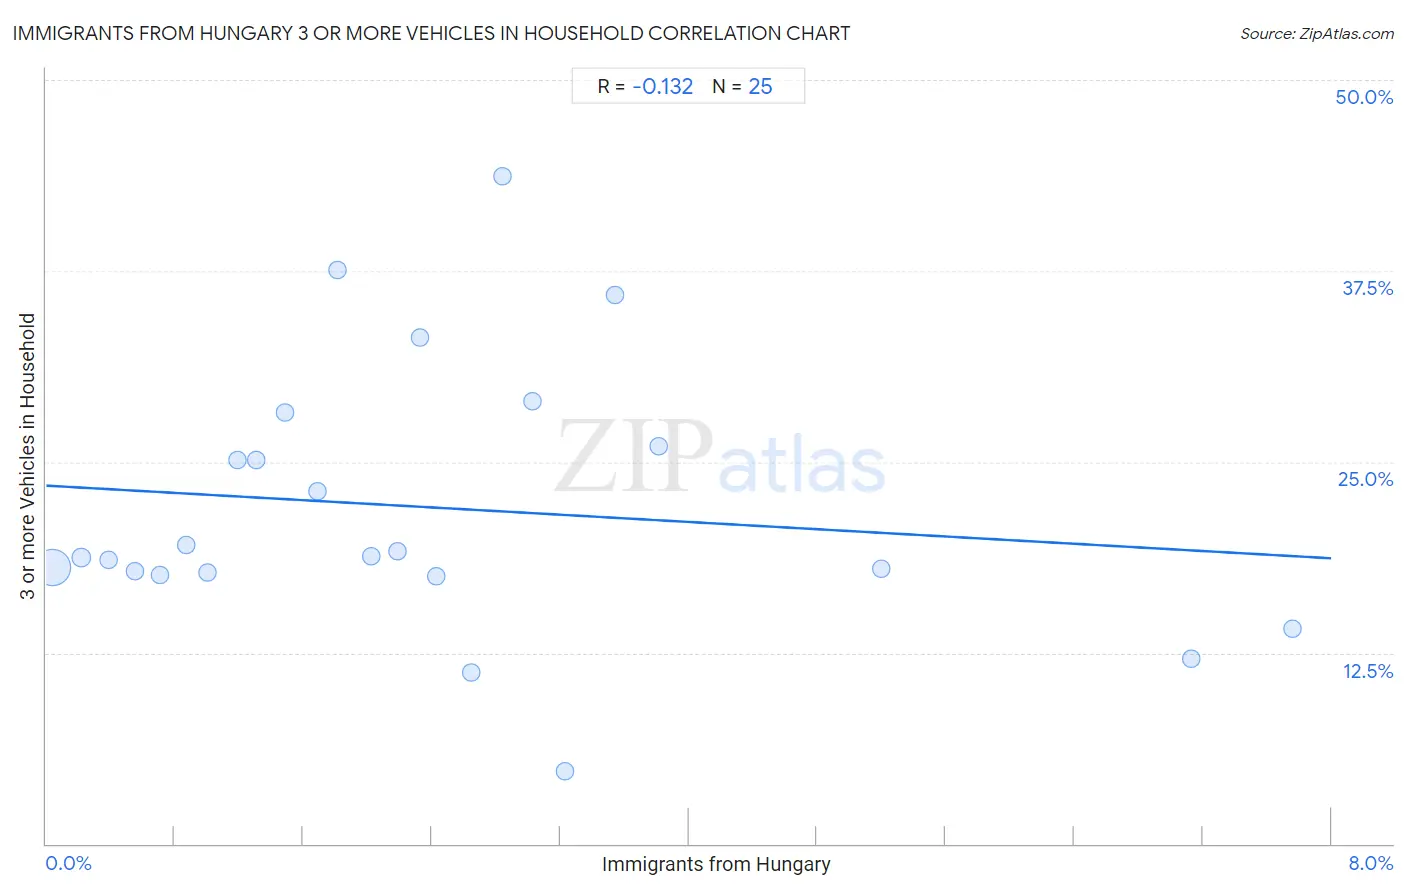
Immigrants from Hungary 3 or more Vehicles in Household Correlation Chart
The statistical analysis conducted on geographies consisting of 195,641,507 people shows a poor negative correlation between the proportion of Immigrants from Hungary and percentage of households with 3 or more vehicles available in the United States with a correlation coefficient (R) of -0.132 and weighted average of 18.5%. On average, for every 1% (one percent) increase in Immigrants from Hungary within a typical geography, there is a decrease of 0.59% in percentage of households with 3 or more vehicles available.
It is essential to understand that the correlation between the percentage of Immigrants from Hungary and percentage of households with 3 or more vehicles available does not imply a direct cause-and-effect relationship. It remains uncertain whether the presence of Immigrants from Hungary influences an upward or downward trend in the level of percentage of households with 3 or more vehicles available within an area, or if Immigrants from Hungary simply ended up residing in those areas with higher or lower levels of percentage of households with 3 or more vehicles available due to other factors.
Demographics Similar to Immigrants from Hungary by 3 or more Vehicles in Household
In terms of 3 or more vehicles in household, the demographic groups most similar to Immigrants from Hungary are Immigrants from Lithuania (18.5%, a difference of 0.030%), Immigrants from Singapore (18.4%, a difference of 0.030%), Immigrants from Argentina (18.5%, a difference of 0.040%), Turkish (18.4%, a difference of 0.050%), and Immigrants from Czechoslovakia (18.5%, a difference of 0.15%).
| Demographics | Rating | Rank | 3 or more Vehicles in Household |
| Immigrants from Armenia | 8.6 /100 | #219 | Tragic 18.6% |
| Nigerians | 7.9 /100 | #220 | Tragic 18.6% |
| Immigrants from Poland | 7.5 /100 | #221 | Tragic 18.6% |
| Belizeans | 7.3 /100 | #222 | Tragic 18.6% |
| Immigrants from Czechoslovakia | 5.9 /100 | #223 | Tragic 18.5% |
| Immigrants from Argentina | 5.6 /100 | #224 | Tragic 18.5% |
| Immigrants from Lithuania | 5.6 /100 | #225 | Tragic 18.5% |
| Immigrants from Hungary | 5.5 /100 | #226 | Tragic 18.5% |
| Immigrants from Singapore | 5.4 /100 | #227 | Tragic 18.4% |
| Turks | 5.4 /100 | #228 | Tragic 18.4% |
| Immigrants from Switzerland | 5.0 /100 | #229 | Tragic 18.4% |
| Immigrants from Western Asia | 4.8 /100 | #230 | Tragic 18.4% |
| Immigrants from Belgium | 4.8 /100 | #231 | Tragic 18.4% |
| Immigrants from Uganda | 4.6 /100 | #232 | Tragic 18.4% |
| Hondurans | 4.6 /100 | #233 | Tragic 18.4% |
Immigrants from Hungary 3 or more Vehicles in Household Correlation Summary
| Measurement | Immigrants from Hungary Data | 3 or more Vehicles in Household Data |
| Minimum | 0.039% | 4.8% |
| Maximum | 7.8% | 43.7% |
| Range | 7.7% | 39.0% |
| Mean | 2.4% | 22.0% |
| Median | 2.0% | 18.9% |
| Interquartile 25% (IQ1) | 0.94% | 17.7% |
| Interquartile 75% (IQ3) | 3.1% | 27.1% |
| Interquartile Range (IQR) | 2.2% | 9.4% |
| Standard Deviation (Sample) | 2.0% | 8.8% |
| Standard Deviation (Population) | 1.9% | 8.7% |
Correlation Details
| Immigrants from Hungary Percentile | Sample Size | 3 or more Vehicles in Household |
[ 0.0% - 0.5% ] 0.039% | 180,530,759 | 18.1% |
[ 0.0% - 0.5% ] 0.22% | 11,011,692 | 18.7% |
[ 0.0% - 0.5% ] 0.39% | 2,384,425 | 18.6% |
[ 0.5% - 1.0% ] 0.55% | 1,002,005 | 17.9% |
[ 0.5% - 1.0% ] 0.70% | 304,010 | 17.6% |
[ 0.5% - 1.0% ] 0.87% | 129,377 | 19.6% |
[ 1.0% - 1.5% ] 1.01% | 47,444 | 17.8% |
[ 1.0% - 1.5% ] 1.19% | 84,971 | 25.1% |
[ 1.0% - 1.5% ] 1.31% | 6,499 | 25.1% |
[ 1.0% - 1.5% ] 1.49% | 50,070 | 28.2% |
[ 1.5% - 2.0% ] 1.69% | 15,069 | 23.1% |
[ 1.5% - 2.0% ] 1.81% | 1,987 | 37.5% |
[ 2.0% - 2.5% ] 2.02% | 34,658 | 18.9% |
[ 2.0% - 2.5% ] 2.19% | 11,295 | 19.2% |
[ 2.0% - 2.5% ] 2.33% | 1,546 | 33.1% |
[ 2.0% - 2.5% ] 2.43% | 4,902 | 17.5% |
[ 2.5% - 3.0% ] 2.65% | 3,968 | 11.3% |
[ 2.5% - 3.0% ] 2.84% | 598 | 43.7% |
[ 3.0% - 3.5% ] 3.03% | 8,612 | 29.0% |
[ 3.0% - 3.5% ] 3.23% | 124 | 4.8% |
[ 3.5% - 4.0% ] 3.54% | 2,741 | 35.9% |
[ 3.5% - 4.0% ] 3.81% | 1,599 | 26.1% |
[ 5.0% - 5.5% ] 5.20% | 1,174 | 18.0% |
[ 7.0% - 7.5% ] 7.13% | 603 | 12.1% |
[ 7.5% - 8.0% ] 7.76% | 1,379 | 14.1% |