Canadian 3 or more Vehicles in Household
COMPARE
Canadian
Select to Compare
3 or more Vehicles in Household
Canadian 3 or more Vehicles in Household
21.0%
3+ VEHICLES AVAILABLE
98.3/ 100
METRIC RATING
97th/ 347
METRIC RANK
Canadian 3 or more Vehicles in Household Correlation Chart
The statistical analysis conducted on geographies consisting of 437,139,388 people shows a moderate positive correlation between the proportion of Canadians and percentage of households with 3 or more vehicles available in the United States with a correlation coefficient (R) of 0.488 and weighted average of 21.0%. On average, for every 1% (one percent) increase in Canadians within a typical geography, there is an increase of 0.50% in percentage of households with 3 or more vehicles available.
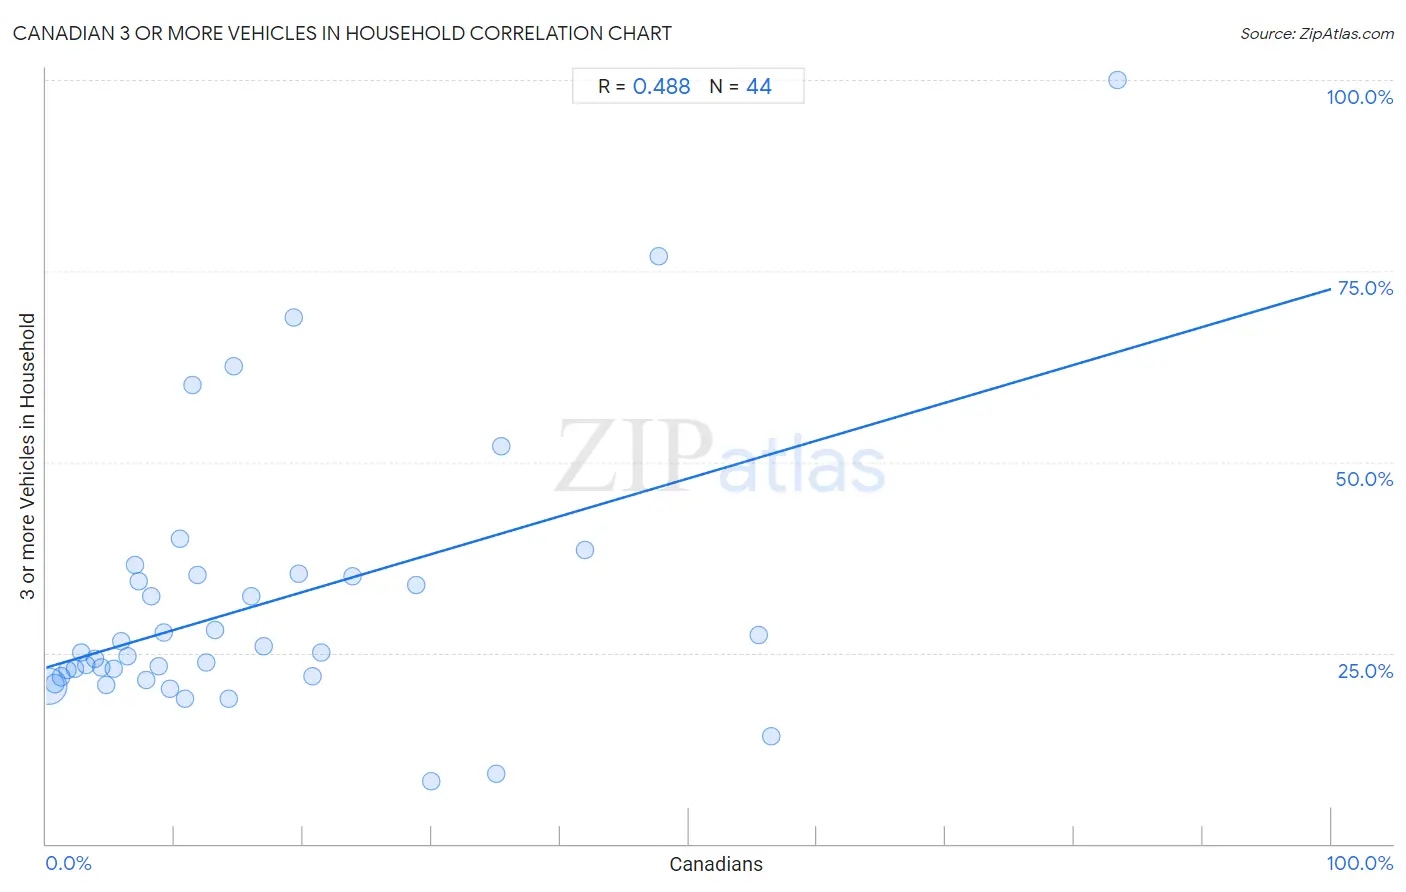
It is essential to understand that the correlation between the percentage of Canadians and percentage of households with 3 or more vehicles available does not imply a direct cause-and-effect relationship. It remains uncertain whether the presence of Canadians influences an upward or downward trend in the level of percentage of households with 3 or more vehicles available within an area, or if Canadians simply ended up residing in those areas with higher or lower levels of percentage of households with 3 or more vehicles available due to other factors.
Demographics Similar to Canadians by 3 or more Vehicles in Household
In terms of 3 or more vehicles in household, the demographic groups most similar to Canadians are Hmong (21.0%, a difference of 0.060%), Alaska Native (21.0%, a difference of 0.060%), Comanche (21.0%, a difference of 0.10%), Cree (21.0%, a difference of 0.11%), and Pakistani (21.0%, a difference of 0.20%).
| Demographics | Rating | Rank | 3 or more Vehicles in Household |
| Immigrants from Afghanistan | 99.1 /100 | #90 | Exceptional 21.2% |
| Belgians | 98.9 /100 | #91 | Exceptional 21.2% |
| Apache | 98.9 /100 | #92 | Exceptional 21.2% |
| Immigrants from Indonesia | 98.8 /100 | #93 | Exceptional 21.1% |
| Immigrants from Cambodia | 98.6 /100 | #94 | Exceptional 21.1% |
| Pakistanis | 98.5 /100 | #95 | Exceptional 21.0% |
| Cree | 98.4 /100 | #96 | Exceptional 21.0% |
| Canadians | 98.3 /100 | #97 | Exceptional 21.0% |
| Hmong | 98.2 /100 | #98 | Exceptional 21.0% |
| Alaska Natives | 98.2 /100 | #99 | Exceptional 21.0% |
| Comanche | 98.2 /100 | #100 | Exceptional 21.0% |
| Blackfeet | 97.9 /100 | #101 | Exceptional 20.9% |
| Seminole | 97.8 /100 | #102 | Exceptional 20.9% |
| Dutch West Indians | 97.8 /100 | #103 | Exceptional 20.9% |
| Luxembourgers | 97.7 /100 | #104 | Exceptional 20.9% |
Canadian 3 or more Vehicles in Household Correlation Summary
| Measurement | Canadian Data | 3 or more Vehicles in Household Data |
| Minimum | 0.16% | 8.2% |
| Maximum | 83.3% | 100.0% |
| Range | 83.2% | 91.8% |
| Mean | 17.0% | 31.5% |
| Median | 11.1% | 25.0% |
| Interquartile 25% (IQ1) | 5.5% | 21.9% |
| Interquartile 75% (IQ3) | 21.1% | 35.1% |
| Interquartile Range (IQR) | 15.5% | 13.2% |
| Standard Deviation (Sample) | 17.6% | 17.9% |
| Standard Deviation (Population) | 17.4% | 17.7% |
Correlation Details
| Canadian Percentile | Sample Size | 3 or more Vehicles in Household |
[ 0.0% - 0.5% ] 0.16% | 393,368,865 | 20.5% |
[ 0.5% - 1.0% ] 0.67% | 34,525,605 | 21.0% |
[ 1.0% - 1.5% ] 1.19% | 5,659,537 | 21.9% |
[ 1.5% - 2.0% ] 1.68% | 2,005,747 | 22.7% |
[ 2.0% - 2.5% ] 2.24% | 725,228 | 23.0% |
[ 2.5% - 3.0% ] 2.76% | 276,660 | 25.0% |
[ 3.0% - 3.5% ] 3.16% | 177,389 | 23.4% |
[ 3.5% - 4.0% ] 3.80% | 139,801 | 24.2% |
[ 4.0% - 4.5% ] 4.29% | 61,213 | 23.1% |
[ 4.5% - 5.0% ] 4.68% | 61,187 | 20.8% |
[ 5.0% - 5.5% ] 5.28% | 13,776 | 22.9% |
[ 5.5% - 6.0% ] 5.79% | 19,987 | 26.5% |
[ 6.0% - 6.5% ] 6.33% | 40,930 | 24.6% |
[ 6.5% - 7.0% ] 6.90% | 8,476 | 36.5% |
[ 7.0% - 7.5% ] 7.19% | 12,121 | 34.3% |
[ 7.5% - 8.0% ] 7.83% | 1,852 | 21.4% |
[ 8.0% - 8.5% ] 8.20% | 4,575 | 32.4% |
[ 8.5% - 9.0% ] 8.72% | 12,686 | 23.2% |
[ 9.0% - 9.5% ] 9.11% | 3,478 | 27.6% |
[ 9.5% - 10.0% ] 9.67% | 5,168 | 20.2% |
[ 10.0% - 10.5% ] 10.38% | 530 | 39.9% |
[ 10.5% - 11.0% ] 10.81% | 2,211 | 19.0% |
[ 11.0% - 11.5% ] 11.36% | 88 | 60.0% |
[ 11.5% - 12.0% ] 11.73% | 3,589 | 35.1% |
[ 12.0% - 12.5% ] 12.46% | 2,560 | 23.7% |
[ 13.0% - 13.5% ] 13.13% | 99 | 27.9% |
[ 14.0% - 14.5% ] 14.21% | 1,562 | 18.9% |
[ 14.5% - 15.0% ] 14.63% | 82 | 62.5% |
[ 15.5% - 16.0% ] 15.91% | 2,037 | 32.4% |
[ 16.5% - 17.0% ] 16.90% | 71 | 25.8% |
[ 19.0% - 19.5% ] 19.24% | 447 | 68.8% |
[ 19.5% - 20.0% ] 19.67% | 239 | 35.4% |
[ 20.5% - 21.0% ] 20.73% | 82 | 21.9% |
[ 21.0% - 21.5% ] 21.43% | 28 | 25.0% |
[ 23.5% - 24.0% ] 23.79% | 391 | 35.0% |
[ 28.5% - 29.0% ] 28.77% | 285 | 33.8% |
[ 30.0% - 30.5% ] 30.00% | 200 | 8.2% |
[ 35.0% - 35.5% ] 35.00% | 20 | 9.1% |
[ 35.0% - 35.5% ] 35.42% | 96 | 52.0% |
[ 41.5% - 42.0% ] 41.94% | 31 | 38.5% |
[ 47.5% - 48.0% ] 47.62% | 105 | 76.9% |
[ 55.0% - 55.5% ] 55.45% | 101 | 27.3% |
[ 56.0% - 56.5% ] 56.39% | 133 | 14.1% |
[ 83.0% - 83.5% ] 83.33% | 120 | 100.0% |