Ottawa 3 or more Vehicles in Household

COMPARE

Ottawa
Race
Ancestry
AfghanAfricanAlaska NativeAlaskan AthabascanAlbanianAleutAlsatianAmericanApacheArabArapahoArgentineanArmenianAssyrian/Chaldean/SyriacAustralianAustrianBahamianBangladeshiBarbadianBasqueBelgianBelizeanBermudanBhutaneseBlackfeetBolivianBrazilianBritishBritish West IndianBulgarianBurmeseCajunCambodianCanadianCape VerdeanCarpatho RusynCelticCentral AmericanCentral American IndianCherokeeCheyenneChickasawChileanChineseChippewaChoctawColombianColvilleComancheCosta RicanCreeCreekCroatianCrowCubanCypriotCzechCzechoslovakianDanishDelawareDominicanDutchDutch West IndianEastern EuropeanEcuadorianEgyptianEnglishEstonianEthiopianEuropeanFijianFilipinoFinnishFrenchFrench American IndianFrench CanadianGermanGerman RussianGhanaianGreekGuamanian/ChamorroGuatemalanGuyaneseHaitianHmongHonduranHopiHoumaHungarianIcelanderIndian (Asian)IndonesianInupiatIranianIraqiIrishIroquoisIsraeliItalianJamaicanJapaneseJordanianKenyanKiowaKoreanLaotianLatvianLebaneseLiberianLithuanianLumbeeLuxembourgerMacedonianMalaysianMalteseMarshalleseMenomineeMexicanMexican American IndianMongolianMoroccanNative HawaiianNavajoNepaleseNew ZealanderNicaraguanNigerianNorthern EuropeanNorwegianOkinawanOsageOttawaPaiutePakistaniPalestinianPanamanianParaguayanPennsylvania GermanPeruvianPimaPolishPortuguesePotawatomiPuebloPuerto RicanPuget Sound SalishRomanianRussianSalvadoranSamoanScandinavianScotch-IrishScottishSeminoleSenegaleseSerbianShoshoneSierra LeoneanSiouxSlavicSlovakSloveneSomaliSouth AfricanSouth AmericanSouth American IndianSoviet UnionSpaniardSpanishSpanish AmericanSpanish American IndianSri LankanSubsaharan AfricanSudaneseSwedishSwissSyrianTaiwaneseThaiTlingit-HaidaTohono O'OdhamTonganTrinidadian and TobagonianTsimshianTurkishU.S. Virgin IslanderUgandanUkrainianUruguayanUteVenezuelanVietnameseWelshWest IndianYakamaYaquiYugoslavianYumanYup'ikZimbabwean
Immigration
NonimmigrantsImmigrantsAfghanistanAfricaAlbaniaArgentinaArmeniaAsiaAustraliaAustriaBahamasBangladeshBarbadosBelarusBelgiumBelizeBoliviaBosnia and HerzegovinaBrazilBulgariaBurma/MyanmarCabo VerdeCambodiaCameroonCanadaCaribbeanCentral AmericaChileChinaColombiaCongoCosta RicaCroatiaCubaCzechoslovakiaDenmarkDominicaDominican RepublicEastern AfricaEastern AsiaEastern EuropeEcuadorEgyptEl SalvadorEnglandEritreaEthiopiaEuropeFijiFranceGermanyGhanaGreeceGrenadaGuatemalaGuyanaHaitiHondurasHong KongHungaryIndiaIndonesiaIranIraqIrelandIsraelItalyJamaicaJapanJordanKazakhstanKenyaKoreaKuwaitLaosLatin AmericaLatviaLebanonLiberiaLithuaniaMalaysiaMexicoMicronesiaMiddle AfricaMoldovaMoroccoNepalNetherlandsNicaraguaNigeriaNorth AmericaNorth MacedoniaNorthern AfricaNorthern EuropeNorwayOceaniaPakistanPanamaPeruPhilippinesPolandPortugalRomaniaRussiaSaudi ArabiaScotlandSenegalSerbiaSierra LeoneSingaporeSomaliaSouth AfricaSouth AmericaSouth Central AsiaSouth Eastern AsiaSouthern EuropeSpainSri LankaSt. Vincent and the GrenadinesSudanSwedenSwitzerlandSyriaTaiwanThailandTrinidad and TobagoTurkeyUgandaUkraineUruguayUzbekistanVenezuelaVietnamWest IndiesWestern AfricaWestern AsiaWestern EuropeYemenZaireZimbabweAzores
Select to Compare
Race
Ancestry
AfghanAfricanAlaska NativeAlaskan AthabascanAlbanianAleutAlsatianAmericanApacheArabArapahoArgentineanArmenianAssyrian/Chaldean/SyriacAustralianAustrianBahamianBangladeshiBarbadianBasqueBelgianBelizeanBermudanBhutaneseBlackfeetBolivianBrazilianBritishBritish West IndianBulgarianBurmeseCajunCambodianCanadianCape VerdeanCarpatho RusynCelticCentral AmericanCentral American IndianCherokeeCheyenneChickasawChileanChineseChippewaChoctawColombianColvilleComancheCosta RicanCreeCreekCroatianCrowCubanCypriotCzechCzechoslovakianDanishDelawareDominicanDutchDutch West IndianEastern EuropeanEcuadorianEgyptianEnglishEstonianEthiopianEuropeanFijianFilipinoFinnishFrenchFrench American IndianFrench CanadianGermanGerman RussianGhanaianGreekGuamanian/ChamorroGuatemalanGuyaneseHaitianHmongHonduranHopiHoumaHungarianIcelanderIndian (Asian)IndonesianInupiatIranianIraqiIrishIroquoisIsraeliItalianJamaicanJapaneseJordanianKenyanKiowaKoreanLaotianLatvianLebaneseLiberianLithuanianLumbeeLuxembourgerMacedonianMalaysianMalteseMarshalleseMenomineeMexicanMexican American IndianMongolianMoroccanNative HawaiianNavajoNepaleseNew ZealanderNicaraguanNigerianNorthern EuropeanNorwegianOkinawanOsagePaiutePakistaniPalestinianPanamanianParaguayanPennsylvania GermanPeruvianPimaPolishPortuguesePotawatomiPuebloPuerto RicanPuget Sound SalishRomanianRussianSalvadoranSamoanScandinavianScotch-IrishScottishSeminoleSenegaleseSerbianShoshoneSierra LeoneanSiouxSlavicSlovakSloveneSomaliSouth AfricanSouth AmericanSouth American IndianSoviet UnionSpaniardSpanishSpanish AmericanSpanish American IndianSri LankanSubsaharan AfricanSudaneseSwedishSwissSyrianTaiwaneseThaiTlingit-HaidaTohono O'OdhamTonganTrinidadian and TobagonianTsimshianTurkishU.S. Virgin IslanderUgandanUkrainianUruguayanUteVenezuelanVietnameseWelshWest IndianYakamaYaquiYugoslavianYumanYup'ikZimbabwean
Immigration
NonimmigrantsImmigrantsAfghanistanAfricaAlbaniaArgentinaArmeniaAsiaAustraliaAustriaBahamasBangladeshBarbadosBelarusBelgiumBelizeBoliviaBosnia and HerzegovinaBrazilBulgariaBurma/MyanmarCabo VerdeCambodiaCameroonCanadaCaribbeanCentral AmericaChileChinaColombiaCongoCosta RicaCroatiaCubaCzechoslovakiaDenmarkDominicaDominican RepublicEastern AfricaEastern AsiaEastern EuropeEcuadorEgyptEl SalvadorEnglandEritreaEthiopiaEuropeFijiFranceGermanyGhanaGreeceGrenadaGuatemalaGuyanaHaitiHondurasHong KongHungaryIndiaIndonesiaIranIraqIrelandIsraelItalyJamaicaJapanJordanKazakhstanKenyaKoreaKuwaitLaosLatin AmericaLatviaLebanonLiberiaLithuaniaMalaysiaMexicoMicronesiaMiddle AfricaMoldovaMoroccoNepalNetherlandsNicaraguaNigeriaNorth AmericaNorth MacedoniaNorthern AfricaNorthern EuropeNorwayOceaniaPakistanPanamaPeruPhilippinesPolandPortugalRomaniaRussiaSaudi ArabiaScotlandSenegalSerbiaSierra LeoneSingaporeSomaliaSouth AfricaSouth AmericaSouth Central AsiaSouth Eastern AsiaSouthern EuropeSpainSri LankaSt. Vincent and the GrenadinesSudanSwedenSwitzerlandSyriaTaiwanThailandTrinidad and TobagoTurkeyUgandaUkraineUruguayUzbekistanVenezuelaVietnamWest IndiesWestern AfricaWestern AsiaWestern EuropeYemenZaireZimbabweAzores
3 or more Vehicles in Household
Income
Poverty
Unemployment
Labor Participation
Family Structure
Vehicle Availability
Education Level
Disability

Ottawa 3 or more Vehicles in Household
Excellent

20.1%
3+ VEHICLES AVAILABLE
84.9/ 100
METRIC RATING
141st/ 347
METRIC RANK

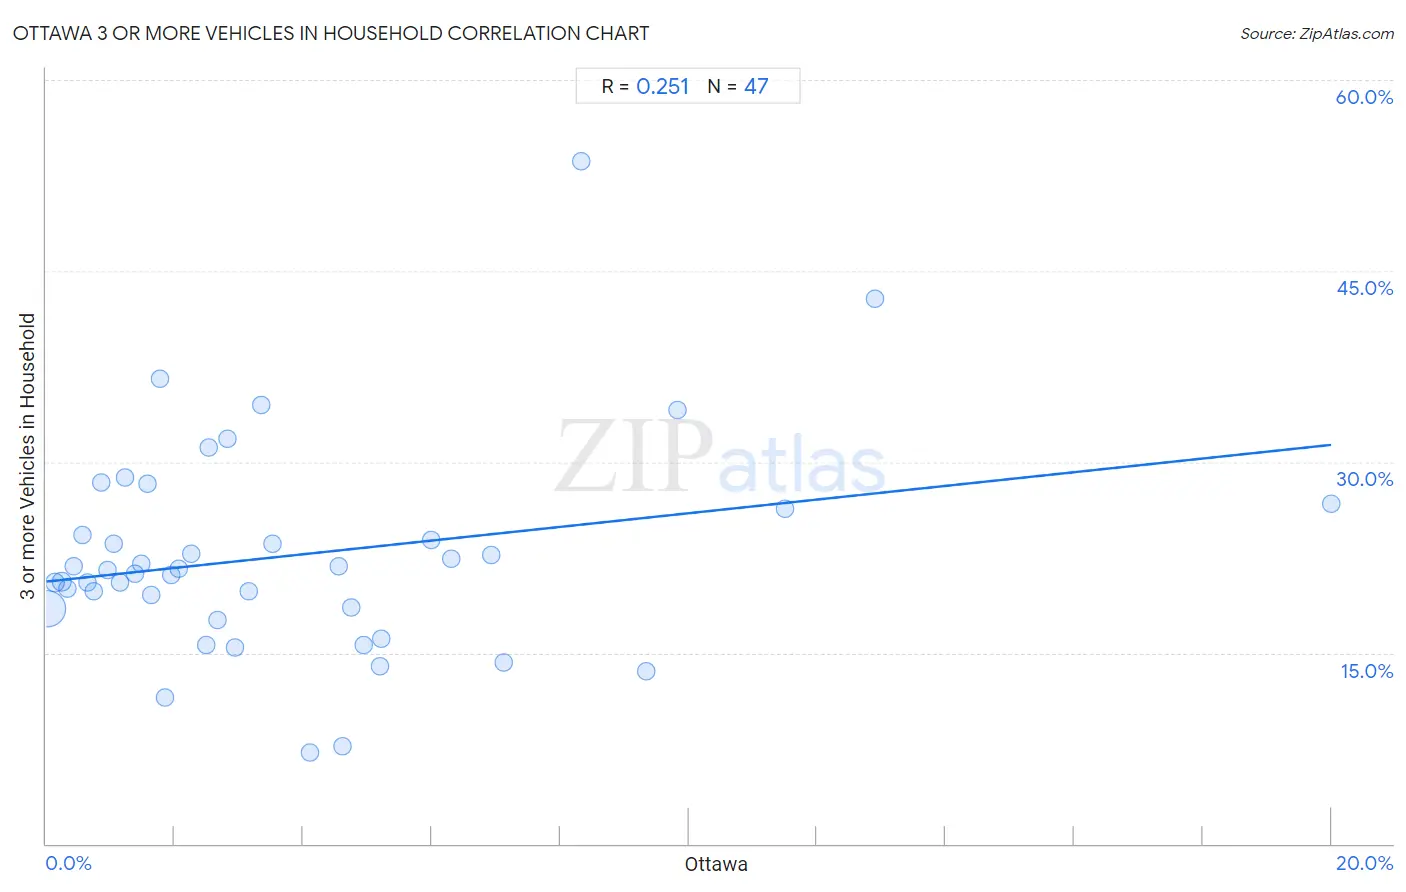
Ottawa 3 or more Vehicles in Household Correlation Chart

The statistical analysis conducted on geographies consisting of 49,939,188 people shows a weak positive correlation between the proportion of Ottawa and percentage of households with 3 or more vehicles available in the United States with a correlation coefficient (R) of 0.251 and weighted average of 20.1%. On average, for every 1% (one percent) increase in Ottawa within a typical geography, there is an increase of 0.54% in percentage of households with 3 or more vehicles available.
Ottawa 3 or more Vehicles in Household
It is essential to understand that the correlation between the percentage of Ottawa and percentage of households with 3 or more vehicles available does not imply a direct cause-and-effect relationship. It remains uncertain whether the presence of Ottawa influences an upward or downward trend in the level of percentage of households with 3 or more vehicles available within an area, or if Ottawa simply ended up residing in those areas with higher or lower levels of percentage of households with 3 or more vehicles available due to other factors.

Demographics Similar to Ottawa by 3 or more Vehicles in Household

In terms of 3 or more vehicles in household, the demographic groups most similar to Ottawa are French American Indian (20.1%, a difference of 0.060%), Jordanian (20.1%, a difference of 0.060%), Lithuanian (20.1%, a difference of 0.070%), Slovene (20.2%, a difference of 0.090%), and Iranian (20.1%, a difference of 0.12%).
DemographicsRating | Rank3 or more Vehicles in Household
Poles
87.3
/100
|
#134
Excellent
20.2%
Immigrants from India
87.2
/100
|
#135
Excellent
20.2%
Immigrants from Nicaragua
87.1
/100
|
#136
Excellent
20.2%
Immigrants from Iraq
87.1
/100
|
#137
Excellent
20.2%
Aleuts
86.3
/100
|
#138
Excellent
20.2%
Slovenes
85.5
/100
|
#139
Excellent
20.2%
French American Indians
85.3
/100
|
#140
Excellent
20.1%
Ottawa
84.9
/100
|
#141
Excellent
20.1%
Jordanians
84.4
/100
|
#142
Excellent
20.1%
Lithuanians
84.4
/100
|
#143
Excellent
20.1%
Iranians
84.0
/100
|
#144
Excellent
20.1%
Palestinians
83.9
/100
|
#145
Excellent
20.1%
Australians
83.6
/100
|
#146
Excellent
20.1%
Slovaks
83.0
/100
|
#147
Excellent
20.1%
Guatemalans
82.6
/100
|
#148
Excellent
20.1%

Ottawa 3 or more Vehicles in Household Correlation Summary

MeasurementOttawa Data3 or more Vehicles in Household Data
Minimum0.015%7.1%
Maximum20.0%53.7%
Range20.0%46.5%
Mean3.8%22.6%
Median2.5%21.5%
Interquartile 25% (IQ1)1.1%18.5%
Interquartile 75% (IQ3)5.2%26.3%
Interquartile Range (IQR)4.1%7.8%
Standard Deviation (Sample)3.9%8.4%
Standard Deviation (Population)3.9%8.3%

Correlation Details

Ottawa PercentileSample Size3 or more Vehicles in Household
[
0.0%
-
0.5%
]
0.015%
45,126,99918.5%
[
0.0%
-
0.5%
]
0.14%
2,782,50420.5%
[
0.0%
-
0.5%
]
0.24%
897,36920.6%
[
0.0%
-
0.5%
]
0.34%
466,85820.1%
[
0.0%
-
0.5%
]
0.43%
161,46721.8%
[
0.5%
-
1.0%
]
0.57%
64,87624.3%
[
0.5%
-
1.0%
]
0.64%
95,46320.5%
[
0.5%
-
1.0%
]
0.74%
113,05219.9%
[
0.5%
-
1.0%
]
0.85%
32,97428.4%
[
0.5%
-
1.0%
]
0.96%
7,92721.5%
[
1.0%
-
1.5%
]
1.06%
14,29823.6%
[
1.0%
-
1.5%
]
1.15%
40,27020.5%
[
1.0%
-
1.5%
]
1.22%
4,43028.8%
[
1.0%
-
1.5%
]
1.37%
28,62121.2%
[
1.0%
-
1.5%
]
1.47%
7,80022.0%
[
1.5%
-
2.0%
]
1.58%
17,15828.3%
[
1.5%
-
2.0%
]
1.63%
4,66319.6%
[
1.5%
-
2.0%
]
1.77%
11336.5%
[
1.5%
-
2.0%
]
1.84%
7,81411.5%
[
1.5%
-
2.0%
]
1.94%
16,07221.1%
[
2.0%
-
2.5%
]
2.05%
1,94821.6%
[
2.0%
-
2.5%
]
2.27%
11,20922.8%
[
2.0%
-
2.5%
]
2.50%
6,24815.7%
[
2.5%
-
3.0%
]
2.53%
47431.1%
[
2.5%
-
3.0%
]
2.67%
1,27417.6%
[
2.5%
-
3.0%
]
2.83%
63631.8%
[
2.5%
-
3.0%
]
2.93%
5,14815.4%
[
3.0%
-
3.5%
]
3.15%
6,89419.9%
[
3.0%
-
3.5%
]
3.35%
1,10534.4%
[
3.5%
-
4.0%
]
3.52%
1,99123.5%
[
4.0%
-
4.5%
]
4.10%
3907.1%
[
4.5%
-
5.0%
]
4.56%
35121.8%
[
4.5%
-
5.0%
]
4.62%
3687.6%
[
4.5%
-
5.0%
]
4.76%
4,85718.6%
[
4.5%
-
5.0%
]
4.95%
20215.6%
[
5.0%
-
5.5%
]
5.20%
25013.9%
[
5.0%
-
5.5%
]
5.22%
86216.1%
[
5.5%
-
6.0%
]
5.99%
26723.9%
[
6.0%
-
6.5%
]
6.30%
1,03122.4%
[
6.5%
-
7.0%
]
6.93%
1,41522.7%
[
7.0%
-
7.5%
]
7.11%
75914.3%
[
8.0%
-
8.5%
]
8.33%
8453.7%
[
9.0%
-
9.5%
]
9.33%
7513.5%
[
9.5%
-
10.0%
]
9.83%
35634.0%
[
11.0%
-
11.5%
]
11.49%
8726.3%
[
12.5%
-
13.0%
]
12.90%
12442.9%
[
20.0%
-
20.5%
]
20.00%
5526.7%