Tlingit-Haida Median Household Income

COMPARE

Tlingit-Haida
Race
Ancestry
AfghanAfricanAlaska NativeAlaskan AthabascanAlbanianAleutAlsatianAmericanApacheArabArapahoArgentineanArmenianAssyrian/Chaldean/SyriacAustralianAustrianBahamianBangladeshiBarbadianBasqueBelgianBelizeanBermudanBhutaneseBlackfeetBolivianBrazilianBritishBritish West IndianBulgarianBurmeseCajunCambodianCanadianCape VerdeanCarpatho RusynCelticCentral AmericanCentral American IndianCherokeeCheyenneChickasawChileanChineseChippewaChoctawColombianColvilleComancheCosta RicanCreeCreekCroatianCrowCubanCypriotCzechCzechoslovakianDanishDelawareDominicanDutchDutch West IndianEastern EuropeanEcuadorianEgyptianEnglishEstonianEthiopianEuropeanFijianFilipinoFinnishFrenchFrench American IndianFrench CanadianGermanGerman RussianGhanaianGreekGuamanian/ChamorroGuatemalanGuyaneseHaitianHmongHonduranHopiHoumaHungarianIcelanderIndian (Asian)IndonesianInupiatIranianIraqiIrishIroquoisIsraeliItalianJamaicanJapaneseJordanianKenyanKiowaKoreanLaotianLatvianLebaneseLiberianLithuanianLumbeeLuxembourgerMacedonianMalaysianMalteseMarshalleseMenomineeMexicanMexican American IndianMongolianMoroccanNative HawaiianNavajoNepaleseNew ZealanderNicaraguanNigerianNorthern EuropeanNorwegianOkinawanOsageOttawaPaiutePakistaniPalestinianPanamanianParaguayanPennsylvania GermanPeruvianPimaPolishPortuguesePotawatomiPuebloPuerto RicanPuget Sound SalishRomanianRussianSalvadoranSamoanScandinavianScotch-IrishScottishSeminoleSenegaleseSerbianShoshoneSierra LeoneanSiouxSlavicSlovakSloveneSomaliSouth AfricanSouth AmericanSouth American IndianSoviet UnionSpaniardSpanishSpanish AmericanSpanish American IndianSri LankanSubsaharan AfricanSudaneseSwedishSwissSyrianTaiwaneseThaiTlingit-HaidaTohono O'OdhamTonganTrinidadian and TobagonianTsimshianTurkishU.S. Virgin IslanderUgandanUkrainianUruguayanUteVenezuelanVietnameseWelshWest IndianYakamaYaquiYugoslavianYumanYup'ikZimbabwean
Immigration
NonimmigrantsImmigrantsAfghanistanAfricaAlbaniaArgentinaArmeniaAsiaAustraliaAustriaBahamasBangladeshBarbadosBelarusBelgiumBelizeBoliviaBosnia and HerzegovinaBrazilBulgariaBurma/MyanmarCabo VerdeCambodiaCameroonCanadaCaribbeanCentral AmericaChileChinaColombiaCongoCosta RicaCroatiaCubaCzechoslovakiaDenmarkDominicaDominican RepublicEastern AfricaEastern AsiaEastern EuropeEcuadorEgyptEl SalvadorEnglandEritreaEthiopiaEuropeFijiFranceGermanyGhanaGreeceGrenadaGuatemalaGuyanaHaitiHondurasHong KongHungaryIndiaIndonesiaIranIraqIrelandIsraelItalyJamaicaJapanJordanKazakhstanKenyaKoreaKuwaitLaosLatin AmericaLatviaLebanonLiberiaLithuaniaMalaysiaMexicoMicronesiaMiddle AfricaMoldovaMoroccoNepalNetherlandsNicaraguaNigeriaNorth AmericaNorth MacedoniaNorthern AfricaNorthern EuropeNorwayOceaniaPakistanPanamaPeruPhilippinesPolandPortugalRomaniaRussiaSaudi ArabiaScotlandSenegalSerbiaSierra LeoneSingaporeSomaliaSouth AfricaSouth AmericaSouth Central AsiaSouth Eastern AsiaSouthern EuropeSpainSri LankaSt. Vincent and the GrenadinesSudanSwedenSwitzerlandSyriaTaiwanThailandTrinidad and TobagoTurkeyUgandaUkraineUruguayUzbekistanVenezuelaVietnamWest IndiesWestern AfricaWestern AsiaWestern EuropeYemenZaireZimbabweAzores
Select to Compare
Race
Ancestry
AfghanAfricanAlaska NativeAlaskan AthabascanAlbanianAleutAlsatianAmericanApacheArabArapahoArgentineanArmenianAssyrian/Chaldean/SyriacAustralianAustrianBahamianBangladeshiBarbadianBasqueBelgianBelizeanBermudanBhutaneseBlackfeetBolivianBrazilianBritishBritish West IndianBulgarianBurmeseCajunCambodianCanadianCape VerdeanCarpatho RusynCelticCentral AmericanCentral American IndianCherokeeCheyenneChickasawChileanChineseChippewaChoctawColombianColvilleComancheCosta RicanCreeCreekCroatianCrowCubanCypriotCzechCzechoslovakianDanishDelawareDominicanDutchDutch West IndianEastern EuropeanEcuadorianEgyptianEnglishEstonianEthiopianEuropeanFijianFilipinoFinnishFrenchFrench American IndianFrench CanadianGermanGerman RussianGhanaianGreekGuamanian/ChamorroGuatemalanGuyaneseHaitianHmongHonduranHopiHoumaHungarianIcelanderIndian (Asian)IndonesianInupiatIranianIraqiIrishIroquoisIsraeliItalianJamaicanJapaneseJordanianKenyanKiowaKoreanLaotianLatvianLebaneseLiberianLithuanianLumbeeLuxembourgerMacedonianMalaysianMalteseMarshalleseMenomineeMexicanMexican American IndianMongolianMoroccanNative HawaiianNavajoNepaleseNew ZealanderNicaraguanNigerianNorthern EuropeanNorwegianOkinawanOsageOttawaPaiutePakistaniPalestinianPanamanianParaguayanPennsylvania GermanPeruvianPimaPolishPortuguesePotawatomiPuebloPuerto RicanPuget Sound SalishRomanianRussianSalvadoranSamoanScandinavianScotch-IrishScottishSeminoleSenegaleseSerbianShoshoneSierra LeoneanSiouxSlavicSlovakSloveneSomaliSouth AfricanSouth AmericanSouth American IndianSoviet UnionSpaniardSpanishSpanish AmericanSpanish American IndianSri LankanSubsaharan AfricanSudaneseSwedishSwissSyrianTaiwaneseThaiTohono O'OdhamTonganTrinidadian and TobagonianTsimshianTurkishU.S. Virgin IslanderUgandanUkrainianUruguayanUteVenezuelanVietnameseWelshWest IndianYakamaYaquiYugoslavianYumanYup'ikZimbabwean
Immigration
NonimmigrantsImmigrantsAfghanistanAfricaAlbaniaArgentinaArmeniaAsiaAustraliaAustriaBahamasBangladeshBarbadosBelarusBelgiumBelizeBoliviaBosnia and HerzegovinaBrazilBulgariaBurma/MyanmarCabo VerdeCambodiaCameroonCanadaCaribbeanCentral AmericaChileChinaColombiaCongoCosta RicaCroatiaCubaCzechoslovakiaDenmarkDominicaDominican RepublicEastern AfricaEastern AsiaEastern EuropeEcuadorEgyptEl SalvadorEnglandEritreaEthiopiaEuropeFijiFranceGermanyGhanaGreeceGrenadaGuatemalaGuyanaHaitiHondurasHong KongHungaryIndiaIndonesiaIranIraqIrelandIsraelItalyJamaicaJapanJordanKazakhstanKenyaKoreaKuwaitLaosLatin AmericaLatviaLebanonLiberiaLithuaniaMalaysiaMexicoMicronesiaMiddle AfricaMoldovaMoroccoNepalNetherlandsNicaraguaNigeriaNorth AmericaNorth MacedoniaNorthern AfricaNorthern EuropeNorwayOceaniaPakistanPanamaPeruPhilippinesPolandPortugalRomaniaRussiaSaudi ArabiaScotlandSenegalSerbiaSierra LeoneSingaporeSomaliaSouth AfricaSouth AmericaSouth Central AsiaSouth Eastern AsiaSouthern EuropeSpainSri LankaSt. Vincent and the GrenadinesSudanSwedenSwitzerlandSyriaTaiwanThailandTrinidad and TobagoTurkeyUgandaUkraineUruguayUzbekistanVenezuelaVietnamWest IndiesWestern AfricaWestern AsiaWestern EuropeYemenZaireZimbabweAzores
Median Household Income
Income
Poverty
Unemployment
Labor Participation
Family Structure
Vehicle Availability
Education Level
Disability

Tlingit-Haida Median Household Income
Fair

$83,968
HOUSEHOLD INCOME
32.6/ 100
METRIC RATING
188th/ 347
METRIC RANK

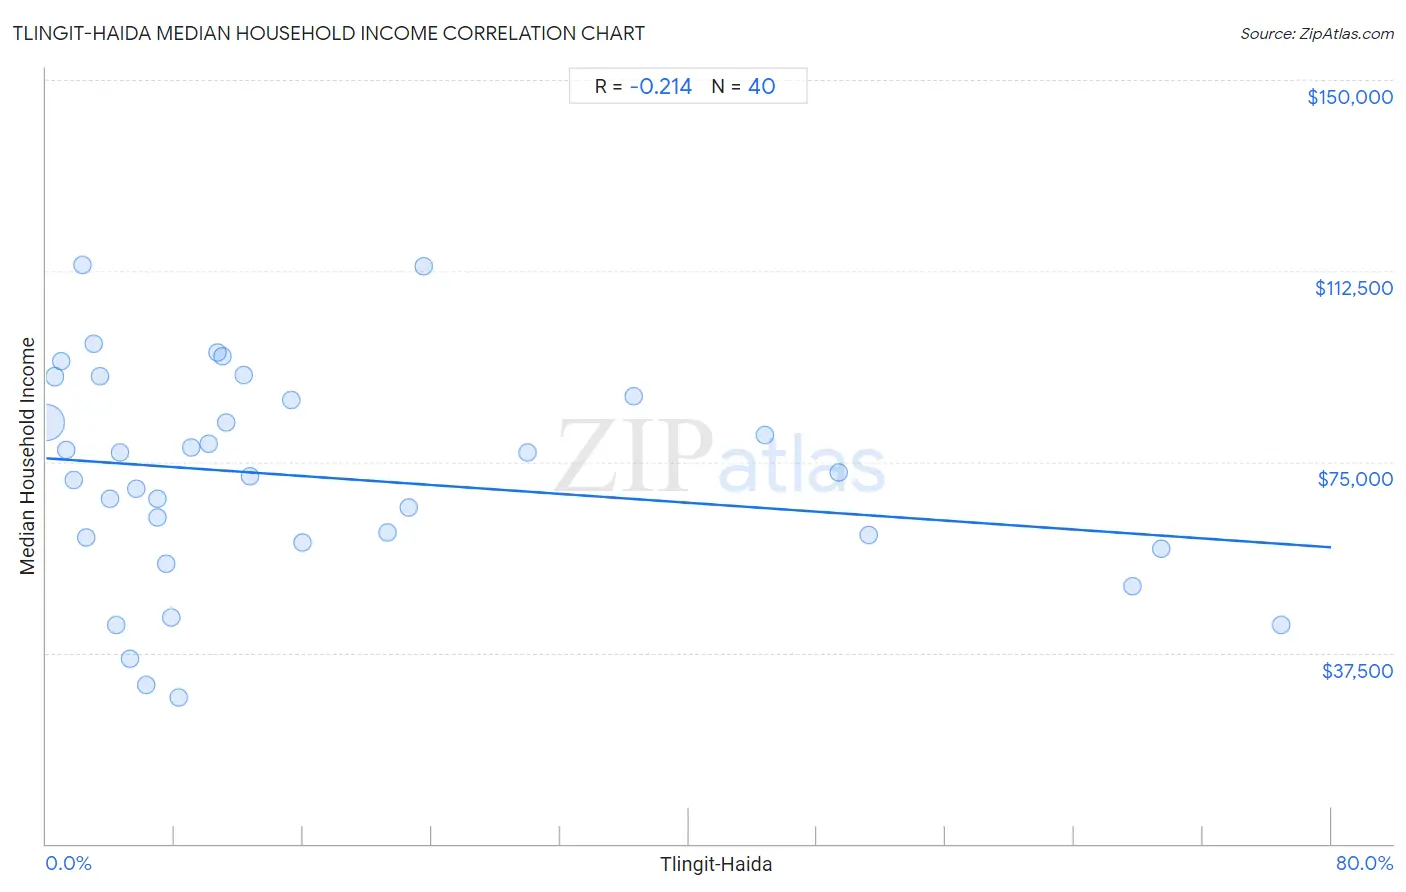
Tlingit-Haida Median Household Income Correlation Chart

The statistical analysis conducted on geographies consisting of 60,854,436 people shows a weak negative correlation between the proportion of Tlingit-Haida and median household income in the United States with a correlation coefficient (R) of -0.214 and weighted average of $83,968. On average, for every 1% (one percent) increase in Tlingit-Haida within a typical geography, there is a decrease of $219 in median household income.
Tlingit-Haida Median Household Income
It is essential to understand that the correlation between the percentage of Tlingit-Haida and median household income does not imply a direct cause-and-effect relationship. It remains uncertain whether the presence of Tlingit-Haida influences an upward or downward trend in the level of median household income within an area, or if Tlingit-Haida simply ended up residing in those areas with higher or lower levels of median household income due to other factors.

Demographics Similar to Tlingit-Haida by Median Household Income

In terms of median household income, the demographic groups most similar to Tlingit-Haida are Puget Sound Salish ($84,011, a difference of 0.050%), Belgian ($84,008, a difference of 0.050%), Immigrants from Colombia ($83,902, a difference of 0.080%), Kenyan ($84,085, a difference of 0.14%), and Slovak ($83,798, a difference of 0.20%).
DemographicsRating | RankMedian Household Income
Hawaiians
44.1
/100
|
#181
Average
$84,729
Uruguayans
43.5
/100
|
#182
Average
$84,691
Spaniards
42.7
/100
|
#183
Average
$84,644
Immigrants from Eastern Africa
37.4
/100
|
#184
Fair
$84,299
Kenyans
34.2
/100
|
#185
Fair
$84,085
Puget Sound Salish
33.2
/100
|
#186
Fair
$84,011
Belgians
33.2
/100
|
#187
Fair
$84,008
Tlingit-Haida
32.6
/100
|
#188
Fair
$83,968
Immigrants from Colombia
31.7
/100
|
#189
Fair
$83,902
Slovaks
30.2
/100
|
#190
Fair
$83,798
Iraqis
29.6
/100
|
#191
Fair
$83,753
Welsh
28.0
/100
|
#192
Fair
$83,628
Finns
27.7
/100
|
#193
Fair
$83,607
Ghanaians
27.4
/100
|
#194
Fair
$83,582
Immigrants from Armenia
27.0
/100
|
#195
Fair
$83,555

Tlingit-Haida Median Household Income Correlation Summary

MeasurementTlingit-Haida DataMedian Household Income Data
Minimum0.036%$28,750
Maximum76.8%$113,574
Range76.8%$84,824
Mean17.1%$71,962
Median8.6%$72,542
Interquartile 25% (IQ1)4.2%$59,644
Interquartile 75% (IQ3)21.9%$87,562
Interquartile Range (IQR)17.7%$27,918
Standard Deviation (Sample)20.4%$20,793
Standard Deviation (Population)20.1%$20,531

Correlation Details

Tlingit-Haida PercentileSample SizeMedian Household Income
[
0.0%
-
0.5%
]
0.036%
59,016,735$82,774
[
0.5%
-
1.0%
]
0.54%
1,312,339$91,719
[
0.5%
-
1.0%
]
0.91%
246,810$94,692
[
1.0%
-
1.5%
]
1.24%
85,687$77,245
[
1.5%
-
2.0%
]
1.71%
25,685$71,517
[
2.0%
-
2.5%
]
2.28%
8,447$113,574
[
2.0%
-
2.5%
]
2.46%
3,655$60,068
[
2.5%
-
3.0%
]
2.92%
6,194$98,251
[
3.0%
-
3.5%
]
3.33%
10,388$91,915
[
3.5%
-
4.0%
]
3.97%
1,964$67,711
[
4.0%
-
4.5%
]
4.35%
115$42,866
[
4.5%
-
5.0%
]
4.62%
822$76,875
[
5.0%
-
5.5%
]
5.24%
420$36,250
[
5.5%
-
6.0%
]
5.62%
1,762$69,612
[
6.0%
-
6.5%
]
6.21%
177$31,111
[
6.5%
-
7.0%
]
6.91%
564$64,135
[
6.5%
-
7.0%
]
6.94%
2,146$67,672
[
7.0%
-
7.5%
]
7.50%
40$55,000
[
7.5%
-
8.0%
]
7.80%
1,257$44,313
[
8.0%
-
8.5%
]
8.22%
146$28,750
[
8.5%
-
9.0%
]
9.00%
6,691$77,749
[
10.0%
-
10.5%
]
10.13%
2,902$78,556
[
10.5%
-
11.0%
]
10.70%
29,933$96,480
[
11.0%
-
11.5%
]
11.00%
32,108$95,711
[
11.0%
-
11.5%
]
11.18%
13,913$82,763
[
12.0%
-
12.5%
]
12.26%
18,041$92,057
[
12.5%
-
13.0%
]
12.66%
8,647$72,115
[
15.0%
-
15.5%
]
15.26%
2,169$87,206
[
15.5%
-
16.0%
]
15.92%
1,727$59,219
[
21.0%
-
21.5%
]
21.23%
4,267$61,062
[
22.5%
-
23.0%
]
22.55%
1,073$66,146
[
23.5%
-
24.0%
]
23.53%
85$113,393
[
29.5%
-
30.0%
]
29.96%
1,128$76,875
[
36.5%
-
37.0%
]
36.59%
82$87,917
[
44.5%
-
45.0%
]
44.78%
920$80,313
[
49.0%
-
49.5%
]
49.33%
1,792$72,969
[
51.0%
-
51.5%
]
51.24%
804$60,625
[
67.5%
-
68.0%
]
67.59%
361$50,500
[
69.0%
-
69.5%
]
69.41%
1,602$57,923
[
76.5%
-
77.0%
]
76.85%
838$42,857