Tlingit-Haida Single Male Poverty
COMPARE
Tlingit-Haida
Select to Compare
Single Male Poverty
Tlingit-Haida Single Male Poverty
11.6%
POVERTY | SINGLE MALES
99.9/ 100
METRIC RATING
49th/ 347
METRIC RANK
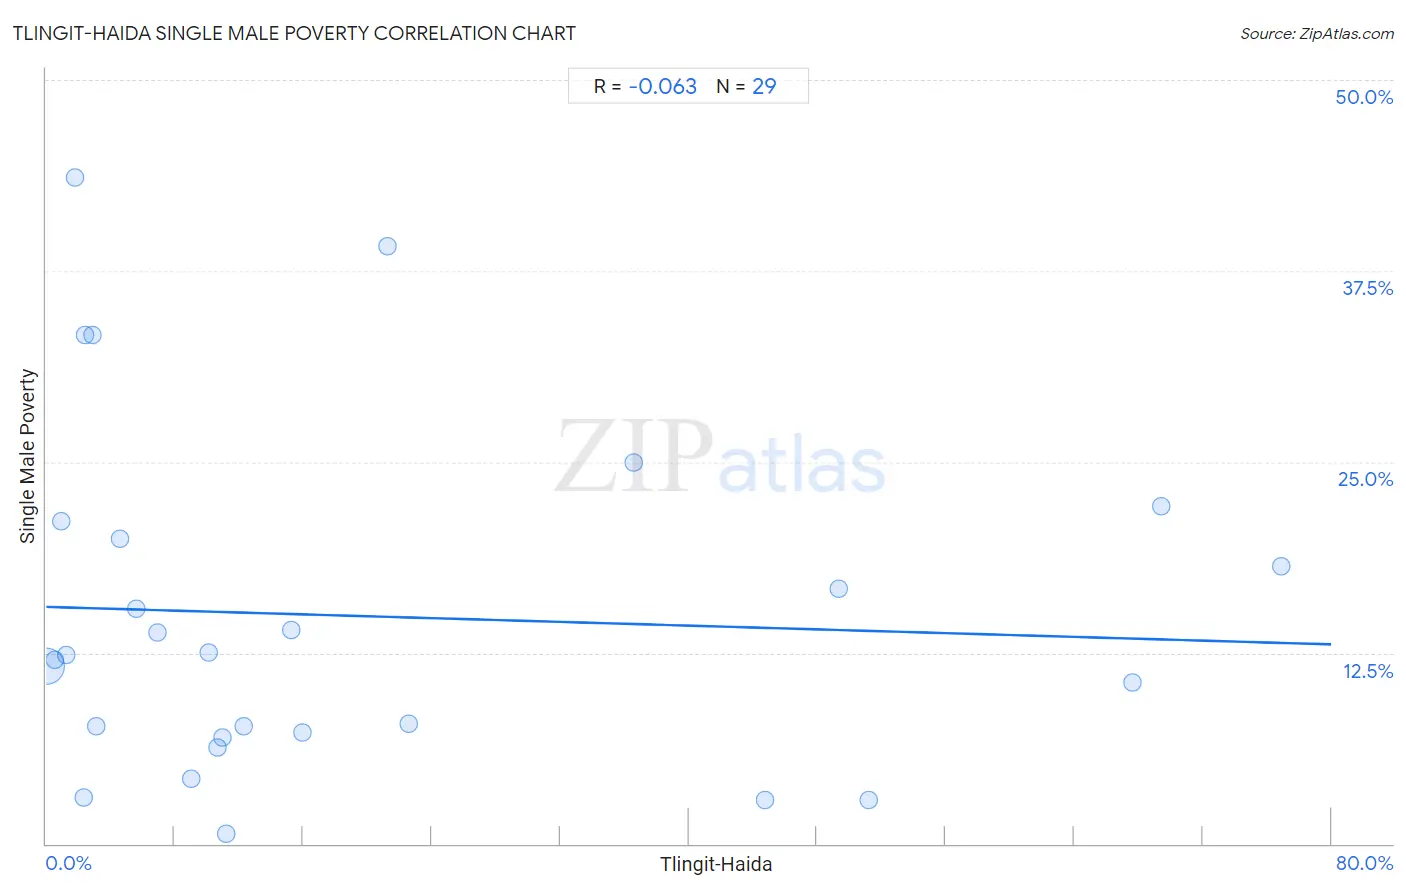
Tlingit-Haida Single Male Poverty Correlation Chart
The statistical analysis conducted on geographies consisting of 58,517,751 people shows a slight negative correlation between the proportion of Tlingit-Haida and poverty level among single males in the United States with a correlation coefficient (R) of -0.063 and weighted average of 11.6%. On average, for every 1% (one percent) increase in Tlingit-Haida within a typical geography, there is a decrease of 0.031% in poverty level among single males.
It is essential to understand that the correlation between the percentage of Tlingit-Haida and poverty level among single males does not imply a direct cause-and-effect relationship. It remains uncertain whether the presence of Tlingit-Haida influences an upward or downward trend in the level of poverty level among single males within an area, or if Tlingit-Haida simply ended up residing in those areas with higher or lower levels of poverty level among single males due to other factors.
Demographics Similar to Tlingit-Haida by Single Male Poverty
In terms of single male poverty, the demographic groups most similar to Tlingit-Haida are Immigrants from Indonesia (11.6%, a difference of 0.020%), Immigrants from Lithuania (11.6%, a difference of 0.060%), Nepalese (11.6%, a difference of 0.10%), Paraguayan (11.6%, a difference of 0.17%), and Immigrants from Bulgaria (11.6%, a difference of 0.29%).
| Demographics | Rating | Rank | Single Male Poverty |
| Egyptians | 99.9 /100 | #42 | Exceptional 11.5% |
| Immigrants from Peru | 99.9 /100 | #43 | Exceptional 11.5% |
| Immigrants from Cameroon | 99.9 /100 | #44 | Exceptional 11.5% |
| Immigrants from Poland | 99.9 /100 | #45 | Exceptional 11.5% |
| Immigrants from Bulgaria | 99.9 /100 | #46 | Exceptional 11.6% |
| Nepalese | 99.9 /100 | #47 | Exceptional 11.6% |
| Immigrants from Indonesia | 99.9 /100 | #48 | Exceptional 11.6% |
| Tlingit-Haida | 99.9 /100 | #49 | Exceptional 11.6% |
| Immigrants from Lithuania | 99.9 /100 | #50 | Exceptional 11.6% |
| Paraguayans | 99.9 /100 | #51 | Exceptional 11.6% |
| Samoans | 99.9 /100 | #52 | Exceptional 11.7% |
| Bulgarians | 99.9 /100 | #53 | Exceptional 11.7% |
| Immigrants from Uzbekistan | 99.9 /100 | #54 | Exceptional 11.7% |
| Cypriots | 99.9 /100 | #55 | Exceptional 11.7% |
| Burmese | 99.8 /100 | #56 | Exceptional 11.7% |
Tlingit-Haida Single Male Poverty Correlation Summary
| Measurement | Tlingit-Haida Data | Single Male Poverty Data |
| Minimum | 0.034% | 0.66% |
| Maximum | 76.8% | 43.6% |
| Range | 76.8% | 43.0% |
| Mean | 19.6% | 14.9% |
| Median | 10.7% | 12.4% |
| Interquartile 25% (IQ1) | 2.7% | 7.1% |
| Interquartile 75% (IQ3) | 29.6% | 20.6% |
| Interquartile Range (IQR) | 26.9% | 13.5% |
| Standard Deviation (Sample) | 23.0% | 11.1% |
| Standard Deviation (Population) | 22.6% | 10.9% |
Correlation Details
| Tlingit-Haida Percentile | Sample Size | Single Male Poverty |
[ 0.0% - 0.5% ] 0.034% | 57,122,719 | 11.7% |
[ 0.5% - 1.0% ] 0.55% | 1,033,664 | 12.1% |
[ 0.5% - 1.0% ] 0.90% | 148,921 | 21.1% |
[ 1.0% - 1.5% ] 1.21% | 62,770 | 12.4% |
[ 1.5% - 2.0% ] 1.75% | 14,151 | 43.6% |
[ 2.0% - 2.5% ] 2.30% | 7,531 | 3.0% |
[ 2.0% - 2.5% ] 2.44% | 2,128 | 33.3% |
[ 2.5% - 3.0% ] 2.87% | 698 | 33.3% |
[ 3.0% - 3.5% ] 3.12% | 1,216 | 7.7% |
[ 4.5% - 5.0% ] 4.62% | 822 | 20.0% |
[ 5.5% - 6.0% ] 5.62% | 1,762 | 15.4% |
[ 6.5% - 7.0% ] 6.94% | 2,146 | 13.8% |
[ 8.5% - 9.0% ] 9.00% | 6,691 | 4.3% |
[ 10.0% - 10.5% ] 10.13% | 2,902 | 12.5% |
[ 10.5% - 11.0% ] 10.70% | 29,933 | 6.3% |
[ 11.0% - 11.5% ] 11.00% | 32,108 | 6.9% |
[ 11.0% - 11.5% ] 11.18% | 13,913 | 0.66% |
[ 12.0% - 12.5% ] 12.26% | 18,041 | 7.7% |
[ 15.0% - 15.5% ] 15.26% | 2,169 | 14.0% |
[ 15.5% - 16.0% ] 15.92% | 1,727 | 7.3% |
[ 21.0% - 21.5% ] 21.23% | 4,267 | 39.1% |
[ 22.5% - 23.0% ] 22.55% | 1,073 | 7.8% |
[ 36.5% - 37.0% ] 36.59% | 82 | 25.0% |
[ 44.5% - 45.0% ] 44.78% | 920 | 2.9% |
[ 49.0% - 49.5% ] 49.33% | 1,792 | 16.7% |
[ 51.0% - 51.5% ] 51.24% | 804 | 2.9% |
[ 67.5% - 68.0% ] 67.59% | 361 | 10.5% |
[ 69.0% - 69.5% ] 69.41% | 1,602 | 22.1% |
[ 76.5% - 77.0% ] 76.85% | 838 | 18.2% |