Immigrants from Guatemala 3 or more Vehicles in Household
COMPARE
Immigrants from Guatemala
Select to Compare
3 or more Vehicles in Household
Immigrants from Guatemala 3 or more Vehicles in Household
19.7%
3+ VEHICLES AVAILABLE
65.6/ 100
METRIC RATING
161st/ 347
METRIC RANK
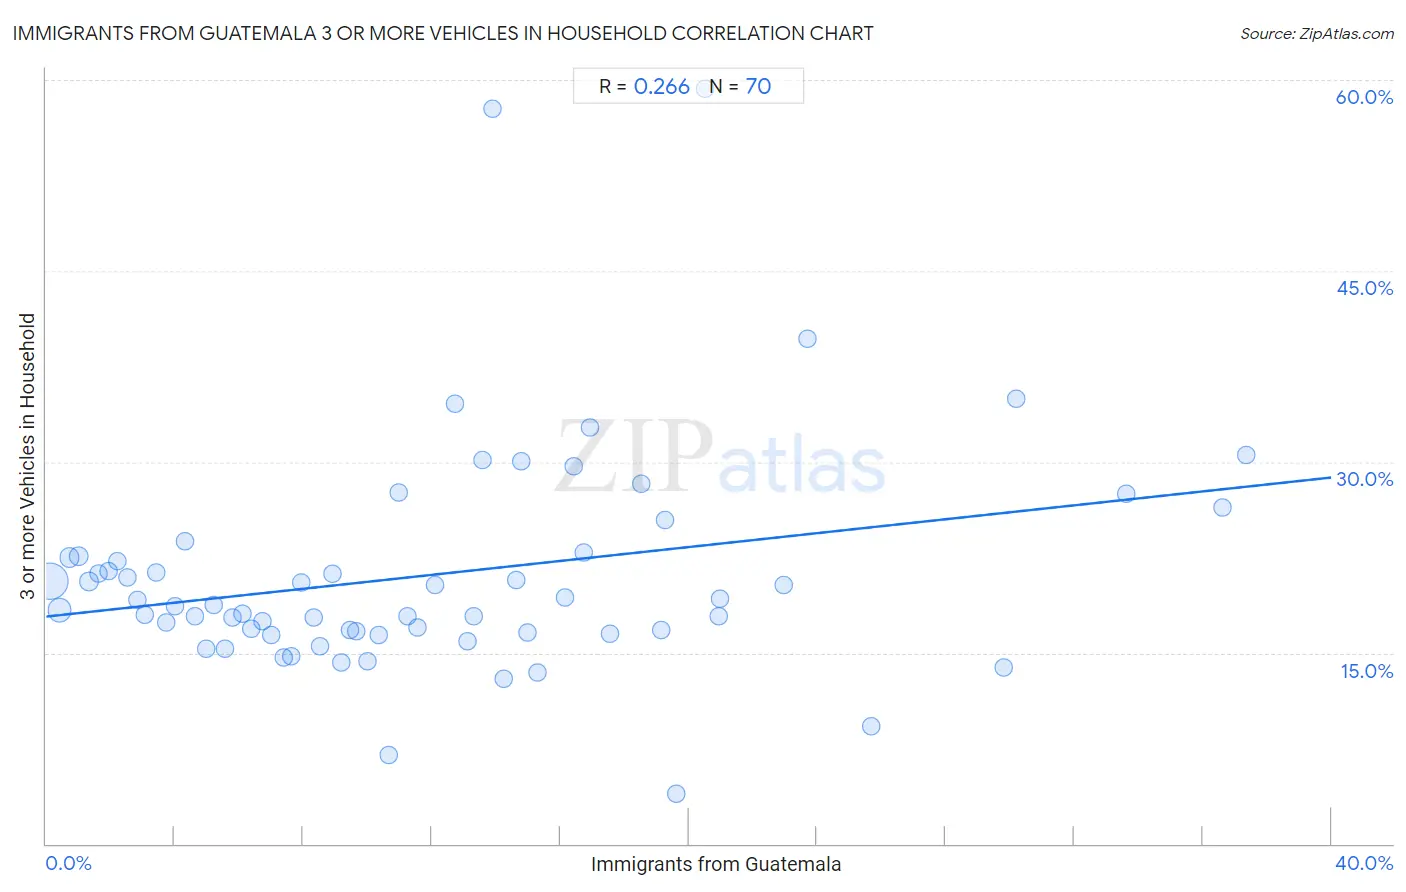
Immigrants from Guatemala 3 or more Vehicles in Household Correlation Chart
The statistical analysis conducted on geographies consisting of 377,138,976 people shows a weak positive correlation between the proportion of Immigrants from Guatemala and percentage of households with 3 or more vehicles available in the United States with a correlation coefficient (R) of 0.266 and weighted average of 19.7%. On average, for every 1% (one percent) increase in Immigrants from Guatemala within a typical geography, there is an increase of 0.27% in percentage of households with 3 or more vehicles available.
It is essential to understand that the correlation between the percentage of Immigrants from Guatemala and percentage of households with 3 or more vehicles available does not imply a direct cause-and-effect relationship. It remains uncertain whether the presence of Immigrants from Guatemala influences an upward or downward trend in the level of percentage of households with 3 or more vehicles available within an area, or if Immigrants from Guatemala simply ended up residing in those areas with higher or lower levels of percentage of households with 3 or more vehicles available due to other factors.
Demographics Similar to Immigrants from Guatemala by 3 or more Vehicles in Household
In terms of 3 or more vehicles in household, the demographic groups most similar to Immigrants from Guatemala are Immigrants from Lebanon (19.8%, a difference of 0.16%), Estonian (19.7%, a difference of 0.19%), Chilean (19.7%, a difference of 0.21%), Immigrants from Pakistan (19.8%, a difference of 0.22%), and Yugoslavian (19.7%, a difference of 0.22%).
| Demographics | Rating | Rank | 3 or more Vehicles in Household |
| Immigrants from Jordan | 75.0 /100 | #154 | Good 19.9% |
| Tlingit-Haida | 73.4 /100 | #155 | Good 19.9% |
| Thais | 71.1 /100 | #156 | Good 19.8% |
| Hungarians | 70.5 /100 | #157 | Good 19.8% |
| Armenians | 68.8 /100 | #158 | Good 19.8% |
| Immigrants from Pakistan | 68.2 /100 | #159 | Good 19.8% |
| Immigrants from Lebanon | 67.6 /100 | #160 | Good 19.8% |
| Immigrants from Guatemala | 65.6 /100 | #161 | Good 19.7% |
| Estonians | 63.2 /100 | #162 | Good 19.7% |
| Chileans | 63.0 /100 | #163 | Good 19.7% |
| Yugoslavians | 62.9 /100 | #164 | Good 19.7% |
| Immigrants from Costa Rica | 61.9 /100 | #165 | Good 19.7% |
| Immigrants from Cameroon | 60.9 /100 | #166 | Good 19.7% |
| Ukrainians | 58.9 /100 | #167 | Average 19.6% |
| Peruvians | 58.8 /100 | #168 | Average 19.6% |
Immigrants from Guatemala 3 or more Vehicles in Household Correlation Summary
| Measurement | Immigrants from Guatemala Data | 3 or more Vehicles in Household Data |
| Minimum | 0.12% | 3.9% |
| Maximum | 37.4% | 59.3% |
| Range | 37.2% | 55.5% |
| Mean | 12.0% | 21.1% |
| Median | 10.5% | 18.7% |
| Interquartile 25% (IQ1) | 5.2% | 16.6% |
| Interquartile 75% (IQ3) | 16.7% | 22.6% |
| Interquartile Range (IQR) | 11.5% | 6.0% |
| Standard Deviation (Sample) | 8.8% | 9.0% |
| Standard Deviation (Population) | 8.7% | 9.0% |
Correlation Details
| Immigrants from Guatemala Percentile | Sample Size | 3 or more Vehicles in Household |
[ 0.0% - 0.5% ] 0.12% | 223,885,391 | 20.6% |
[ 0.0% - 0.5% ] 0.42% | 70,661,862 | 18.3% |
[ 0.5% - 1.0% ] 0.72% | 29,057,143 | 22.4% |
[ 1.0% - 1.5% ] 1.02% | 16,116,492 | 22.6% |
[ 1.0% - 1.5% ] 1.34% | 9,904,224 | 20.6% |
[ 1.5% - 2.0% ] 1.64% | 5,036,985 | 21.3% |
[ 1.5% - 2.0% ] 1.95% | 3,750,239 | 21.4% |
[ 2.0% - 2.5% ] 2.23% | 2,825,632 | 22.2% |
[ 2.5% - 3.0% ] 2.53% | 1,370,014 | 20.9% |
[ 2.5% - 3.0% ] 2.84% | 1,977,481 | 19.1% |
[ 3.0% - 3.5% ] 3.06% | 4,687,256 | 18.0% |
[ 3.0% - 3.5% ] 3.44% | 791,617 | 21.3% |
[ 3.5% - 4.0% ] 3.74% | 928,393 | 17.3% |
[ 4.0% - 4.5% ] 4.01% | 490,768 | 18.7% |
[ 4.0% - 4.5% ] 4.30% | 380,862 | 23.8% |
[ 4.5% - 5.0% ] 4.62% | 948,802 | 17.9% |
[ 4.5% - 5.0% ] 4.99% | 264,008 | 15.3% |
[ 5.0% - 5.5% ] 5.22% | 372,619 | 18.7% |
[ 5.5% - 6.0% ] 5.58% | 410,285 | 15.3% |
[ 5.5% - 6.0% ] 5.81% | 235,955 | 17.7% |
[ 6.0% - 6.5% ] 6.11% | 618,009 | 18.0% |
[ 6.0% - 6.5% ] 6.38% | 257,432 | 16.9% |
[ 6.5% - 7.0% ] 6.72% | 369,428 | 17.4% |
[ 7.0% - 7.5% ] 7.01% | 189,599 | 16.4% |
[ 7.0% - 7.5% ] 7.40% | 127,864 | 14.7% |
[ 7.5% - 8.0% ] 7.61% | 352,179 | 14.7% |
[ 7.5% - 8.0% ] 7.94% | 130,957 | 20.5% |
[ 8.0% - 8.5% ] 8.31% | 1,937 | 17.8% |
[ 8.5% - 9.0% ] 8.52% | 94,498 | 15.5% |
[ 8.5% - 9.0% ] 8.90% | 59,632 | 21.3% |
[ 9.0% - 9.5% ] 9.19% | 40,398 | 14.3% |
[ 9.0% - 9.5% ] 9.46% | 31,748 | 16.8% |
[ 9.5% - 10.0% ] 9.66% | 154,334 | 16.7% |
[ 10.0% - 10.5% ] 10.01% | 62,743 | 14.4% |
[ 10.0% - 10.5% ] 10.35% | 74,296 | 16.4% |
[ 10.5% - 11.0% ] 10.66% | 47,943 | 7.0% |
[ 10.5% - 11.0% ] 10.99% | 8,854 | 27.6% |
[ 11.0% - 11.5% ] 11.24% | 2,670 | 17.9% |
[ 11.5% - 12.0% ] 11.56% | 21,512 | 17.0% |
[ 12.0% - 12.5% ] 12.08% | 1,622 | 20.3% |
[ 12.5% - 13.0% ] 12.71% | 11,184 | 34.5% |
[ 13.0% - 13.5% ] 13.13% | 11,363 | 15.9% |
[ 13.0% - 13.5% ] 13.31% | 64,350 | 17.8% |
[ 13.5% - 14.0% ] 13.57% | 2,115 | 30.1% |
[ 13.5% - 14.0% ] 13.90% | 331 | 57.8% |
[ 14.0% - 14.5% ] 14.23% | 42,230 | 13.0% |
[ 14.5% - 15.0% ] 14.64% | 9,827 | 20.8% |
[ 14.5% - 15.0% ] 14.79% | 7,973 | 30.0% |
[ 14.5% - 15.0% ] 14.98% | 43,649 | 16.6% |
[ 15.0% - 15.5% ] 15.30% | 36,578 | 13.5% |
[ 16.0% - 16.5% ] 16.16% | 51,792 | 19.4% |
[ 16.0% - 16.5% ] 16.40% | 4,085 | 29.6% |
[ 16.5% - 17.0% ] 16.73% | 3,055 | 22.9% |
[ 16.5% - 17.0% ] 16.91% | 6,488 | 32.7% |
[ 17.5% - 18.0% ] 17.53% | 9,320 | 16.5% |
[ 18.5% - 19.0% ] 18.51% | 1,275 | 28.3% |
[ 19.0% - 19.5% ] 19.14% | 2,189 | 16.7% |
[ 19.0% - 19.5% ] 19.25% | 3,538 | 25.5% |
[ 19.5% - 20.0% ] 19.59% | 47,142 | 3.9% |
[ 20.0% - 20.5% ] 20.50% | 2,205 | 59.3% |
[ 20.5% - 21.0% ] 20.92% | 7,247 | 17.8% |
[ 20.5% - 21.0% ] 20.97% | 267 | 19.2% |
[ 22.5% - 23.0% ] 22.97% | 1,389 | 20.3% |
[ 23.5% - 24.0% ] 23.70% | 211 | 39.7% |
[ 25.5% - 26.0% ] 25.70% | 2,506 | 9.2% |
[ 29.5% - 30.0% ] 29.81% | 21,778 | 13.8% |
[ 30.0% - 30.5% ] 30.20% | 149 | 35.0% |
[ 33.5% - 34.0% ] 33.61% | 244 | 27.5% |
[ 36.5% - 37.0% ] 36.61% | 631 | 26.4% |
[ 37.0% - 37.5% ] 37.36% | 182 | 30.6% |