Ute 3 or more Vehicles in Household

COMPARE

Ute
Race
Ancestry
AfghanAfricanAlaska NativeAlaskan AthabascanAlbanianAleutAlsatianAmericanApacheArabArapahoArgentineanArmenianAssyrian/Chaldean/SyriacAustralianAustrianBahamianBangladeshiBarbadianBasqueBelgianBelizeanBermudanBhutaneseBlackfeetBolivianBrazilianBritishBritish West IndianBulgarianBurmeseCajunCambodianCanadianCape VerdeanCarpatho RusynCelticCentral AmericanCentral American IndianCherokeeCheyenneChickasawChileanChineseChippewaChoctawColombianColvilleComancheCosta RicanCreeCreekCroatianCrowCubanCypriotCzechCzechoslovakianDanishDelawareDominicanDutchDutch West IndianEastern EuropeanEcuadorianEgyptianEnglishEstonianEthiopianEuropeanFijianFilipinoFinnishFrenchFrench American IndianFrench CanadianGermanGerman RussianGhanaianGreekGuamanian/ChamorroGuatemalanGuyaneseHaitianHmongHonduranHopiHoumaHungarianIcelanderIndian (Asian)IndonesianInupiatIranianIraqiIrishIroquoisIsraeliItalianJamaicanJapaneseJordanianKenyanKiowaKoreanLaotianLatvianLebaneseLiberianLithuanianLumbeeLuxembourgerMacedonianMalaysianMalteseMarshalleseMenomineeMexicanMexican American IndianMongolianMoroccanNative HawaiianNavajoNepaleseNew ZealanderNicaraguanNigerianNorthern EuropeanNorwegianOkinawanOsageOttawaPaiutePakistaniPalestinianPanamanianParaguayanPennsylvania GermanPeruvianPimaPolishPortuguesePotawatomiPuebloPuerto RicanPuget Sound SalishRomanianRussianSalvadoranSamoanScandinavianScotch-IrishScottishSeminoleSenegaleseSerbianShoshoneSierra LeoneanSiouxSlavicSlovakSloveneSomaliSouth AfricanSouth AmericanSouth American IndianSoviet UnionSpaniardSpanishSpanish AmericanSpanish American IndianSri LankanSubsaharan AfricanSudaneseSwedishSwissSyrianTaiwaneseThaiTlingit-HaidaTohono O'OdhamTonganTrinidadian and TobagonianTsimshianTurkishU.S. Virgin IslanderUgandanUkrainianUruguayanUteVenezuelanVietnameseWelshWest IndianYakamaYaquiYugoslavianYumanYup'ikZimbabwean
Immigration
NonimmigrantsImmigrantsAfghanistanAfricaAlbaniaArgentinaArmeniaAsiaAustraliaAustriaBahamasBangladeshBarbadosBelarusBelgiumBelizeBoliviaBosnia and HerzegovinaBrazilBulgariaBurma/MyanmarCabo VerdeCambodiaCameroonCanadaCaribbeanCentral AmericaChileChinaColombiaCongoCosta RicaCroatiaCubaCzechoslovakiaDenmarkDominicaDominican RepublicEastern AfricaEastern AsiaEastern EuropeEcuadorEgyptEl SalvadorEnglandEritreaEthiopiaEuropeFijiFranceGermanyGhanaGreeceGrenadaGuatemalaGuyanaHaitiHondurasHong KongHungaryIndiaIndonesiaIranIraqIrelandIsraelItalyJamaicaJapanJordanKazakhstanKenyaKoreaKuwaitLaosLatin AmericaLatviaLebanonLiberiaLithuaniaMalaysiaMexicoMicronesiaMiddle AfricaMoldovaMoroccoNepalNetherlandsNicaraguaNigeriaNorth AmericaNorth MacedoniaNorthern AfricaNorthern EuropeNorwayOceaniaPakistanPanamaPeruPhilippinesPolandPortugalRomaniaRussiaSaudi ArabiaScotlandSenegalSerbiaSierra LeoneSingaporeSomaliaSouth AfricaSouth AmericaSouth Central AsiaSouth Eastern AsiaSouthern EuropeSpainSri LankaSt. Vincent and the GrenadinesSudanSwedenSwitzerlandSyriaTaiwanThailandTrinidad and TobagoTurkeyUgandaUkraineUruguayUzbekistanVenezuelaVietnamWest IndiesWestern AfricaWestern AsiaWestern EuropeYemenZaireZimbabweAzores
Select to Compare
Race
Ancestry
AfghanAfricanAlaska NativeAlaskan AthabascanAlbanianAleutAlsatianAmericanApacheArabArapahoArgentineanArmenianAssyrian/Chaldean/SyriacAustralianAustrianBahamianBangladeshiBarbadianBasqueBelgianBelizeanBermudanBhutaneseBlackfeetBolivianBrazilianBritishBritish West IndianBulgarianBurmeseCajunCambodianCanadianCape VerdeanCarpatho RusynCelticCentral AmericanCentral American IndianCherokeeCheyenneChickasawChileanChineseChippewaChoctawColombianColvilleComancheCosta RicanCreeCreekCroatianCrowCubanCypriotCzechCzechoslovakianDanishDelawareDominicanDutchDutch West IndianEastern EuropeanEcuadorianEgyptianEnglishEstonianEthiopianEuropeanFijianFilipinoFinnishFrenchFrench American IndianFrench CanadianGermanGerman RussianGhanaianGreekGuamanian/ChamorroGuatemalanGuyaneseHaitianHmongHonduranHopiHoumaHungarianIcelanderIndian (Asian)IndonesianInupiatIranianIraqiIrishIroquoisIsraeliItalianJamaicanJapaneseJordanianKenyanKiowaKoreanLaotianLatvianLebaneseLiberianLithuanianLumbeeLuxembourgerMacedonianMalaysianMalteseMarshalleseMenomineeMexicanMexican American IndianMongolianMoroccanNative HawaiianNavajoNepaleseNew ZealanderNicaraguanNigerianNorthern EuropeanNorwegianOkinawanOsageOttawaPaiutePakistaniPalestinianPanamanianParaguayanPennsylvania GermanPeruvianPimaPolishPortuguesePotawatomiPuebloPuerto RicanPuget Sound SalishRomanianRussianSalvadoranSamoanScandinavianScotch-IrishScottishSeminoleSenegaleseSerbianShoshoneSierra LeoneanSiouxSlavicSlovakSloveneSomaliSouth AfricanSouth AmericanSouth American IndianSoviet UnionSpaniardSpanishSpanish AmericanSpanish American IndianSri LankanSubsaharan AfricanSudaneseSwedishSwissSyrianTaiwaneseThaiTlingit-HaidaTohono O'OdhamTonganTrinidadian and TobagonianTsimshianTurkishU.S. Virgin IslanderUgandanUkrainianUruguayanVenezuelanVietnameseWelshWest IndianYakamaYaquiYugoslavianYumanYup'ikZimbabwean
Immigration
NonimmigrantsImmigrantsAfghanistanAfricaAlbaniaArgentinaArmeniaAsiaAustraliaAustriaBahamasBangladeshBarbadosBelarusBelgiumBelizeBoliviaBosnia and HerzegovinaBrazilBulgariaBurma/MyanmarCabo VerdeCambodiaCameroonCanadaCaribbeanCentral AmericaChileChinaColombiaCongoCosta RicaCroatiaCubaCzechoslovakiaDenmarkDominicaDominican RepublicEastern AfricaEastern AsiaEastern EuropeEcuadorEgyptEl SalvadorEnglandEritreaEthiopiaEuropeFijiFranceGermanyGhanaGreeceGrenadaGuatemalaGuyanaHaitiHondurasHong KongHungaryIndiaIndonesiaIranIraqIrelandIsraelItalyJamaicaJapanJordanKazakhstanKenyaKoreaKuwaitLaosLatin AmericaLatviaLebanonLiberiaLithuaniaMalaysiaMexicoMicronesiaMiddle AfricaMoldovaMoroccoNepalNetherlandsNicaraguaNigeriaNorth AmericaNorth MacedoniaNorthern AfricaNorthern EuropeNorwayOceaniaPakistanPanamaPeruPhilippinesPolandPortugalRomaniaRussiaSaudi ArabiaScotlandSenegalSerbiaSierra LeoneSingaporeSomaliaSouth AfricaSouth AmericaSouth Central AsiaSouth Eastern AsiaSouthern EuropeSpainSri LankaSt. Vincent and the GrenadinesSudanSwedenSwitzerlandSyriaTaiwanThailandTrinidad and TobagoTurkeyUgandaUkraineUruguayUzbekistanVenezuelaVietnamWest IndiesWestern AfricaWestern AsiaWestern EuropeYemenZaireZimbabweAzores
3 or more Vehicles in Household
Income
Poverty
Unemployment
Labor Participation
Family Structure
Vehicle Availability
Education Level
Disability

Ute 3 or more Vehicles in Household
Exceptional

22.7%
3+ VEHICLES AVAILABLE
100.0/ 100
METRIC RATING
45th/ 347
METRIC RANK

Ute 3 or more Vehicles in Household Correlation Chart

The statistical analysis conducted on geographies consisting of 55,668,268 people shows a weak negative correlation between the proportion of Ute and percentage of households with 3 or more vehicles available in the United States with a correlation coefficient (R) of -0.210 and weighted average of 22.7%. On average, for every 1% (one percent) increase in Ute within a typical geography, there is a decrease of 0.092% in percentage of households with 3 or more vehicles available.
Ute 3 or more Vehicles in Household
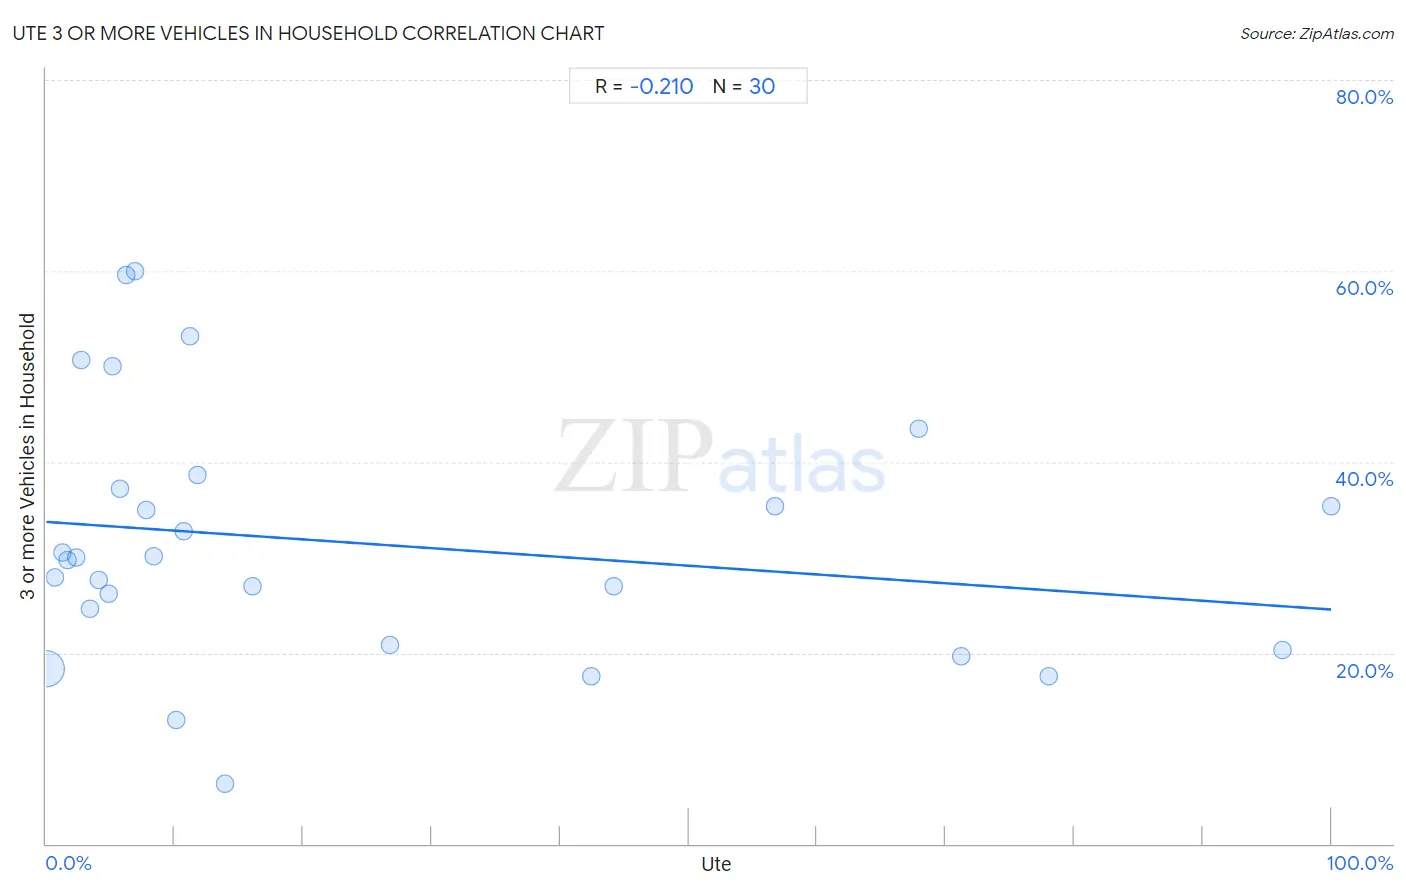
It is essential to understand that the correlation between the percentage of Ute and percentage of households with 3 or more vehicles available does not imply a direct cause-and-effect relationship. It remains uncertain whether the presence of Ute influences an upward or downward trend in the level of percentage of households with 3 or more vehicles available within an area, or if Ute simply ended up residing in those areas with higher or lower levels of percentage of households with 3 or more vehicles available due to other factors.

Demographics Similar to Ute by 3 or more Vehicles in Household

In terms of 3 or more vehicles in household, the demographic groups most similar to Ute are Cheyenne (22.7%, a difference of 0.10%), American (22.6%, a difference of 0.19%), Malaysian (22.6%, a difference of 0.20%), Scottish (22.6%, a difference of 0.21%), and Osage (22.7%, a difference of 0.23%).
DemographicsRating | Rank3 or more Vehicles in Household
Dutch
100.0
/100
|
#38
Exceptional
22.9%
Yaqui
100.0
/100
|
#39
Exceptional
22.9%
Europeans
100.0
/100
|
#40
Exceptional
22.9%
Germans
100.0
/100
|
#41
Exceptional
22.7%
Natives/Alaskans
100.0
/100
|
#42
Exceptional
22.7%
Osage
100.0
/100
|
#43
Exceptional
22.7%
Cheyenne
100.0
/100
|
#44
Exceptional
22.7%
Ute
100.0
/100
|
#45
Exceptional
22.7%
Americans
100.0
/100
|
#46
Exceptional
22.6%
Malaysians
100.0
/100
|
#47
Exceptional
22.6%
Scottish
100.0
/100
|
#48
Exceptional
22.6%
Scotch-Irish
100.0
/100
|
#49
Exceptional
22.6%
Sioux
100.0
/100
|
#50
Exceptional
22.6%
Whites/Caucasians
100.0
/100
|
#51
Exceptional
22.6%
Welsh
100.0
/100
|
#52
Exceptional
22.6%

Ute 3 or more Vehicles in Household Correlation Summary

MeasurementUte Data3 or more Vehicles in Household Data
Minimum0.028%6.3%
Maximum100.0%60.0%
Range100.0%53.7%
Mean23.9%31.5%
Median9.2%29.9%
Interquartile 25% (IQ1)4.1%20.8%
Interquartile 75% (IQ3)42.4%37.1%
Interquartile Range (IQR)38.3%16.3%
Standard Deviation (Sample)30.4%13.3%
Standard Deviation (Population)29.9%13.1%

Correlation Details

Ute PercentileSample Size3 or more Vehicles in Household
[
0.0%
-
0.5%
]
0.028%
55,248,49518.4%
[
0.5%
-
1.0%
]
0.68%
249,34427.9%
[
1.0%
-
1.5%
]
1.22%
56,63530.5%
[
1.5%
-
2.0%
]
1.67%
10,15929.7%
[
2.0%
-
2.5%
]
2.33%
50,99830.0%
[
2.5%
-
3.0%
]
2.75%
8,45850.7%
[
3.0%
-
3.5%
]
3.36%
38724.6%
[
4.0%
-
4.5%
]
4.09%
2,00427.7%
[
4.5%
-
5.0%
]
4.86%
8,83026.2%
[
5.0%
-
5.5%
]
5.13%
1,15150.0%
[
5.5%
-
6.0%
]
5.71%
14,89437.1%
[
6.0%
-
6.5%
]
6.22%
49859.5%
[
6.5%
-
7.0%
]
6.87%
77160.0%
[
7.5%
-
8.0%
]
7.81%
1,75435.0%
[
8.0%
-
8.5%
]
8.33%
1,28530.2%
[
10.0%
-
10.5%
]
10.13%
15812.9%
[
10.5%
-
11.0%
]
10.75%
57732.7%
[
11.0%
-
11.5%
]
11.16%
48453.2%
[
11.5%
-
12.0%
]
11.76%
5,49538.6%
[
13.5%
-
14.0%
]
13.93%
2446.3%
[
16.0%
-
16.5%
]
16.07%
61627.0%
[
26.5%
-
27.0%
]
26.77%
31020.8%
[
42.0%
-
42.5%
]
42.40%
28317.6%
[
44.0%
-
44.5%
]
44.12%
13627.0%
[
56.5%
-
57.0%
]
56.67%
6035.3%
[
67.5%
-
68.0%
]
67.87%
83143.5%
[
71.0%
-
71.5%
]
71.25%
1,18619.7%
[
78.0%
-
78.5%
]
78.06%
1,69117.6%
[
96.0%
-
96.5%
]
96.19%
47220.3%
[
99.5%
-
100.0%
]
100.00%
6235.3%