Spaniard 3 or more Vehicles in Household
COMPARE
Spaniard
Select to Compare
3 or more Vehicles in Household
Spaniard 3 or more Vehicles in Household
22.3%
3+ VEHICLES AVAILABLE
100.0/ 100
METRIC RATING
58th/ 347
METRIC RANK
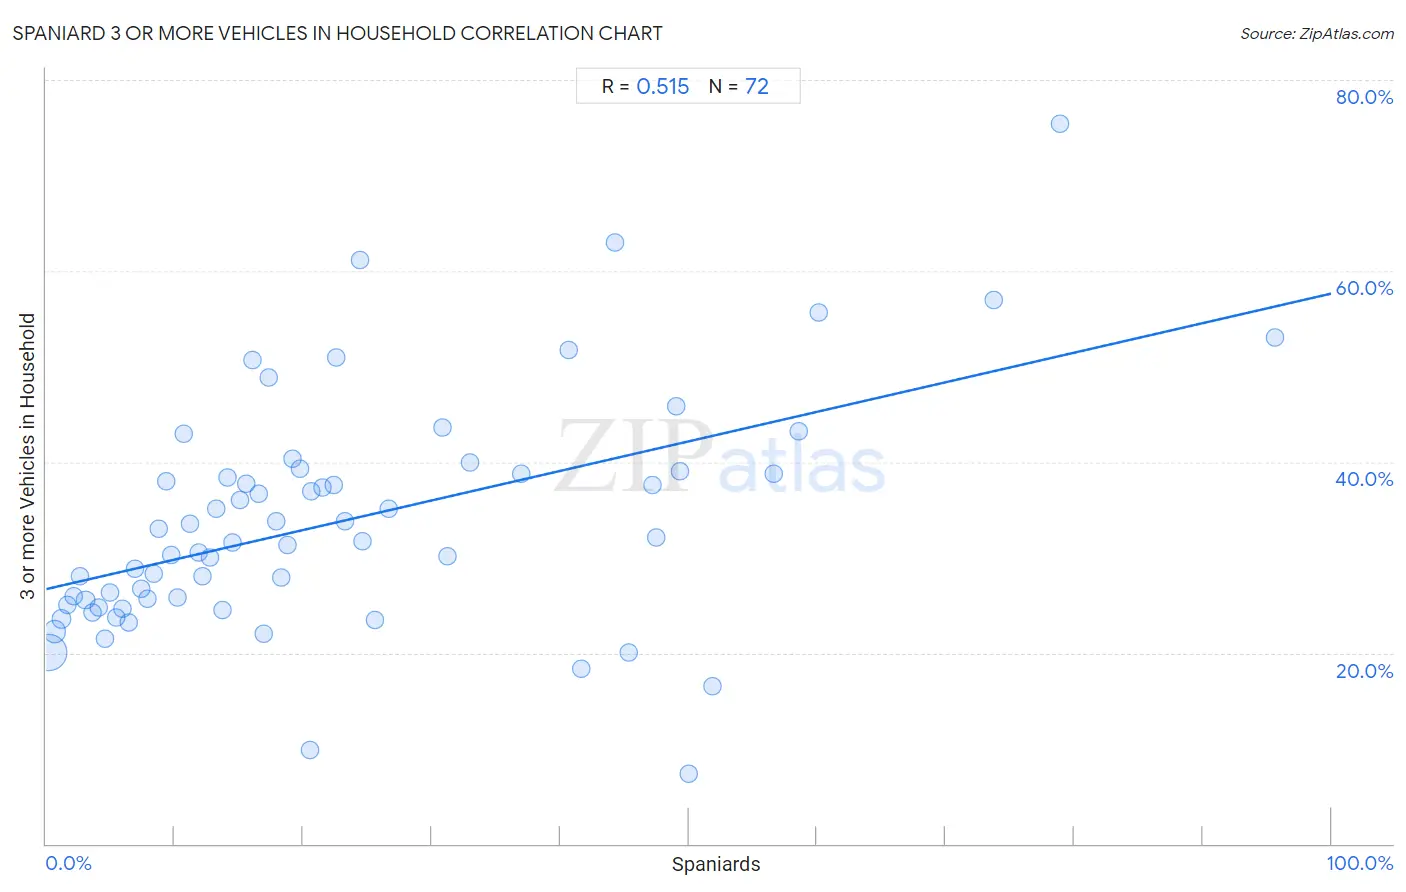
Spaniard 3 or more Vehicles in Household Correlation Chart
The statistical analysis conducted on geographies consisting of 443,028,178 people shows a substantial positive correlation between the proportion of Spaniards and percentage of households with 3 or more vehicles available in the United States with a correlation coefficient (R) of 0.515 and weighted average of 22.3%. On average, for every 1% (one percent) increase in Spaniards within a typical geography, there is an increase of 0.31% in percentage of households with 3 or more vehicles available.
It is essential to understand that the correlation between the percentage of Spaniards and percentage of households with 3 or more vehicles available does not imply a direct cause-and-effect relationship. It remains uncertain whether the presence of Spaniards influences an upward or downward trend in the level of percentage of households with 3 or more vehicles available within an area, or if Spaniards simply ended up residing in those areas with higher or lower levels of percentage of households with 3 or more vehicles available due to other factors.
Demographics Similar to Spaniards by 3 or more Vehicles in Household
In terms of 3 or more vehicles in household, the demographic groups most similar to Spaniards are Navajo (22.3%, a difference of 0.060%), Pennsylvania German (22.3%, a difference of 0.13%), Finnish (22.3%, a difference of 0.15%), Hispanic or Latino (22.4%, a difference of 0.29%), and Bhutanese (22.2%, a difference of 0.30%).
| Demographics | Rating | Rank | 3 or more Vehicles in Household |
| Whites/Caucasians | 100.0 /100 | #51 | Exceptional 22.6% |
| Welsh | 100.0 /100 | #52 | Exceptional 22.6% |
| Czechs | 100.0 /100 | #53 | Exceptional 22.5% |
| Crow | 100.0 /100 | #54 | Exceptional 22.5% |
| Immigrants from Laos | 100.0 /100 | #55 | Exceptional 22.4% |
| Hispanics or Latinos | 100.0 /100 | #56 | Exceptional 22.4% |
| Pennsylvania Germans | 100.0 /100 | #57 | Exceptional 22.3% |
| Spaniards | 100.0 /100 | #58 | Exceptional 22.3% |
| Navajo | 100.0 /100 | #59 | Exceptional 22.3% |
| Finns | 99.9 /100 | #60 | Exceptional 22.3% |
| Bhutanese | 99.9 /100 | #61 | Exceptional 22.2% |
| Fijians | 99.9 /100 | #62 | Exceptional 22.2% |
| Chickasaw | 99.9 /100 | #63 | Exceptional 22.2% |
| Immigrants from Taiwan | 99.9 /100 | #64 | Exceptional 22.1% |
| Pima | 99.9 /100 | #65 | Exceptional 22.0% |
Spaniard 3 or more Vehicles in Household Correlation Summary
| Measurement | Spaniard Data | 3 or more Vehicles in Household Data |
| Minimum | 0.20% | 7.3% |
| Maximum | 95.6% | 75.5% |
| Range | 95.4% | 68.2% |
| Mean | 23.3% | 33.9% |
| Median | 17.1% | 31.9% |
| Interquartile 25% (IQ1) | 8.6% | 25.3% |
| Interquartile 75% (IQ3) | 32.1% | 38.9% |
| Interquartile Range (IQR) | 23.5% | 13.6% |
| Standard Deviation (Sample) | 20.4% | 12.2% |
| Standard Deviation (Population) | 20.2% | 12.2% |
Correlation Details
| Spaniard Percentile | Sample Size | 3 or more Vehicles in Household |
[ 0.0% - 0.5% ] 0.20% | 336,474,551 | 20.0% |
[ 0.5% - 1.0% ] 0.66% | 78,372,647 | 22.2% |
[ 1.0% - 1.5% ] 1.15% | 15,884,923 | 23.5% |
[ 1.5% - 2.0% ] 1.65% | 4,484,911 | 25.0% |
[ 2.0% - 2.5% ] 2.10% | 2,181,223 | 25.9% |
[ 2.5% - 3.0% ] 2.62% | 1,323,387 | 28.1% |
[ 3.0% - 3.5% ] 3.06% | 811,540 | 25.6% |
[ 3.5% - 4.0% ] 3.59% | 542,199 | 24.2% |
[ 4.0% - 4.5% ] 4.04% | 321,911 | 24.7% |
[ 4.5% - 5.0% ] 4.60% | 1,080,334 | 21.4% |
[ 4.5% - 5.0% ] 4.95% | 344,841 | 26.3% |
[ 5.0% - 5.5% ] 5.47% | 308,022 | 23.8% |
[ 5.5% - 6.0% ] 5.97% | 290,901 | 24.6% |
[ 6.0% - 6.5% ] 6.41% | 153,678 | 23.2% |
[ 6.5% - 7.0% ] 6.95% | 36,630 | 28.8% |
[ 7.0% - 7.5% ] 7.42% | 48,157 | 26.6% |
[ 7.5% - 8.0% ] 7.84% | 61,586 | 25.6% |
[ 8.0% - 8.5% ] 8.37% | 17,636 | 28.2% |
[ 8.5% - 9.0% ] 8.79% | 23,158 | 33.0% |
[ 9.0% - 9.5% ] 9.30% | 12,069 | 38.0% |
[ 9.5% - 10.0% ] 9.76% | 17,410 | 30.2% |
[ 10.0% - 10.5% ] 10.26% | 53,332 | 25.8% |
[ 10.5% - 11.0% ] 10.71% | 14,039 | 43.0% |
[ 11.0% - 11.5% ] 11.14% | 18,245 | 33.5% |
[ 11.5% - 12.0% ] 11.90% | 18,069 | 30.5% |
[ 12.0% - 12.5% ] 12.15% | 8,159 | 28.0% |
[ 12.5% - 13.0% ] 12.74% | 2,496 | 30.0% |
[ 13.0% - 13.5% ] 13.18% | 4,157 | 35.1% |
[ 13.5% - 14.0% ] 13.72% | 11,095 | 24.5% |
[ 14.0% - 14.5% ] 14.10% | 1,532 | 38.4% |
[ 14.0% - 14.5% ] 14.48% | 6,563 | 31.5% |
[ 15.0% - 15.5% ] 15.05% | 8,088 | 36.0% |
[ 15.5% - 16.0% ] 15.52% | 1,656 | 37.7% |
[ 16.0% - 16.5% ] 16.03% | 1,578 | 50.7% |
[ 16.5% - 17.0% ] 16.54% | 2,551 | 36.7% |
[ 16.5% - 17.0% ] 16.90% | 1,852 | 21.9% |
[ 17.0% - 17.5% ] 17.36% | 1,567 | 48.9% |
[ 17.5% - 18.0% ] 17.92% | 4,469 | 33.8% |
[ 18.0% - 18.5% ] 18.32% | 2,336 | 27.9% |
[ 18.5% - 19.0% ] 18.76% | 10,722 | 31.3% |
[ 19.0% - 19.5% ] 19.21% | 2,889 | 40.4% |
[ 19.5% - 20.0% ] 19.73% | 902 | 39.3% |
[ 20.5% - 21.0% ] 20.51% | 156 | 9.8% |
[ 20.5% - 21.0% ] 20.62% | 20,910 | 37.0% |
[ 21.0% - 21.5% ] 21.48% | 2,179 | 37.3% |
[ 22.0% - 22.5% ] 22.37% | 4,650 | 37.5% |
[ 22.5% - 23.0% ] 22.59% | 3,285 | 51.0% |
[ 23.0% - 23.5% ] 23.23% | 6,280 | 33.7% |
[ 24.0% - 24.5% ] 24.38% | 242 | 61.2% |
[ 24.5% - 25.0% ] 24.66% | 1,168 | 31.6% |
[ 25.5% - 26.0% ] 25.56% | 360 | 23.5% |
[ 26.5% - 27.0% ] 26.65% | 2,233 | 35.1% |
[ 30.5% - 31.0% ] 30.82% | 1,603 | 43.7% |
[ 31.0% - 31.5% ] 31.22% | 1,864 | 30.1% |
[ 32.5% - 33.0% ] 32.97% | 185 | 40.0% |
[ 37.0% - 37.5% ] 37.01% | 589 | 38.7% |
[ 40.5% - 41.0% ] 40.69% | 1,504 | 51.8% |
[ 41.5% - 42.0% ] 41.66% | 797 | 18.4% |
[ 44.0% - 44.5% ] 44.26% | 2,212 | 62.9% |
[ 45.0% - 45.5% ] 45.30% | 1,786 | 20.0% |
[ 47.0% - 47.5% ] 47.19% | 1,549 | 37.6% |
[ 47.0% - 47.5% ] 47.44% | 1,541 | 32.1% |
[ 49.0% - 49.5% ] 49.06% | 530 | 45.8% |
[ 49.0% - 49.5% ] 49.29% | 211 | 39.0% |
[ 50.0% - 50.5% ] 50.00% | 82 | 7.3% |
[ 51.5% - 52.0% ] 51.89% | 2,068 | 16.5% |
[ 56.5% - 57.0% ] 56.66% | 413 | 38.7% |
[ 58.5% - 59.0% ] 58.59% | 227 | 43.2% |
[ 60.0% - 60.5% ] 60.11% | 371 | 55.7% |
[ 73.5% - 74.0% ] 73.70% | 540 | 56.9% |
[ 78.5% - 79.0% ] 78.89% | 199 | 75.5% |
[ 95.5% - 96.0% ] 95.61% | 433 | 53.0% |