Area Code 703 Map & Demographics
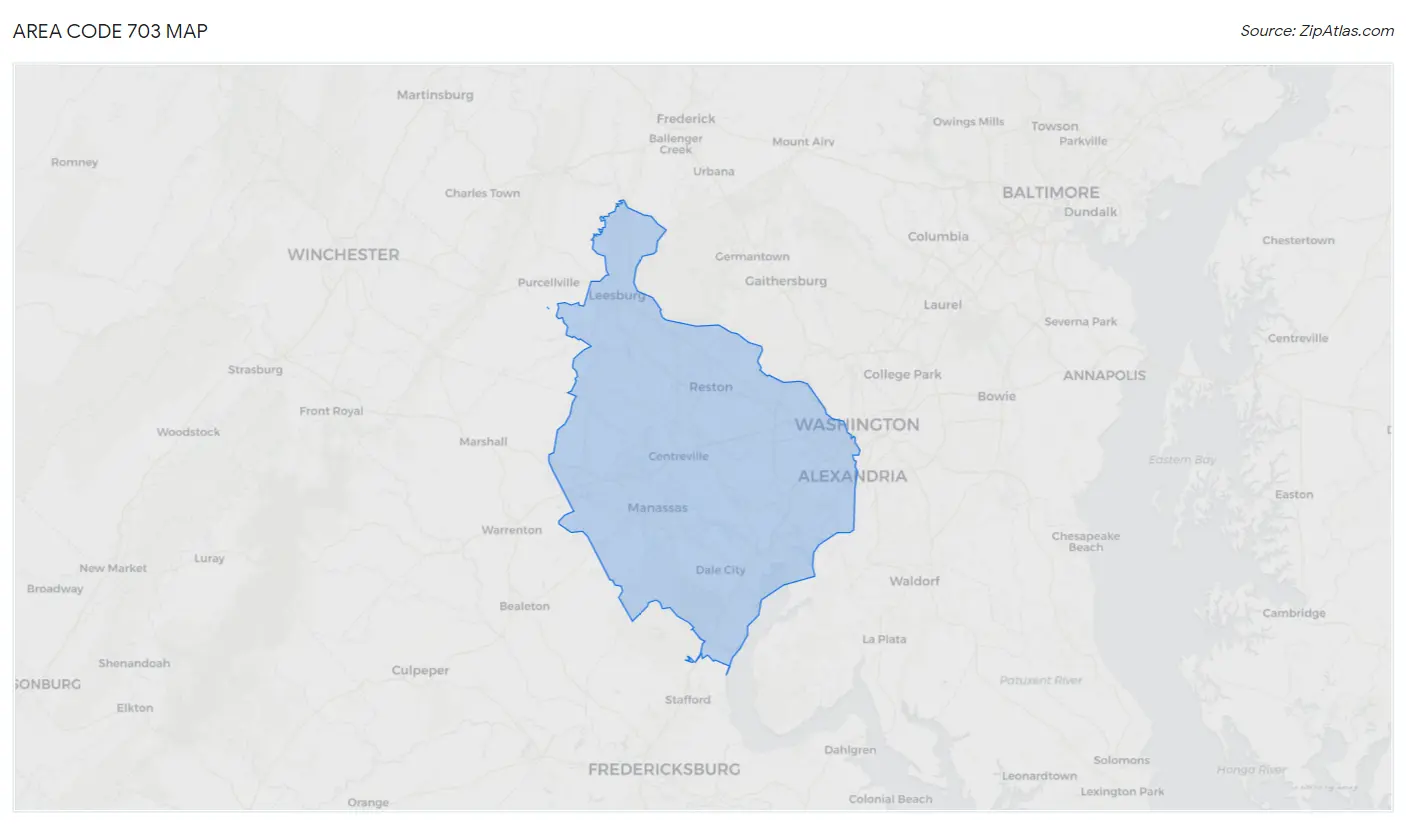
Area Code 703 Map
Area Code 703 Overview
$70,757
PER CAPITA INCOME
$172,927
AVG FAMILY INCOME
$149,718
AVG HOUSEHOLD INCOME
30.6%
WAGE / INCOME GAP [ % ]
69.4¢/ $1
WAGE / INCOME GAP [ $ ]
$11,326
FAMILY INCOME DEFICIT
30.74
INEQUALITY / GINI INDEX
2,238,535
TOTAL POPULATION
1,120,675
MALE POPULATION
1,117,860
FEMALE POPULATION
100.25
MALES / 100 FEMALES
99.75
FEMALES / 100 MALES
38.4
MEDIAN AGE
3.2
AVG FAMILY SIZE
2.7
AVG HOUSEHOLD SIZE
1,291,115
LABOR FORCE [ PEOPLE ]
72.9%
PERCENT IN LABOR FORCE
4.1%
UNEMPLOYMENT RATE
Income in Area Code 703
Income Overview in Area Code 703
Per Capita Income in Area Code 703 is $70,757, while median incomes of families and households are $172,927 and $149,718 respectively.
| Characteristic | Number | Measure |
| Per Capita Income | 2,238,535 | $70,757 |
| Median Family Income | 545,972 | $172,927 |
| Mean Family Income | 545,972 | $16,380,397 |
| Median Household Income | 823,735 | $149,718 |
| Mean Household Income | 823,735 | $14,447,659 |
| Income Deficit | 545,972 | $11,326 |
| Wage / Income Gap (%) | 2,238,535 | 30.61% |
| Wage / Income Gap ($) | 2,238,535 | 69.39¢ per $1 |
| Gini / Inequality Index | 2,238,535 | 30.74 |
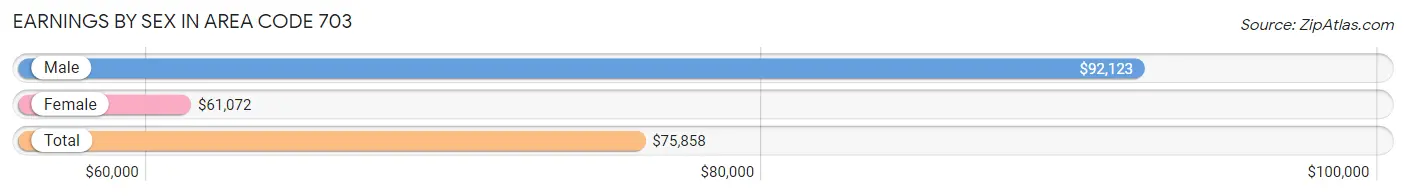
Earnings by Sex in Area Code 703
Average Earnings in Area Code 703 are $75,858, $92,123 for men and $61,072 for women, a difference of 33.7%.
| Sex | Number | Average Earnings |
| Male | 718,357 (53.6%) | $92,123 |
| Female | 622,637 (46.4%) | $61,072 |
| Total | 1,340,994 (100.0%) | $75,858 |
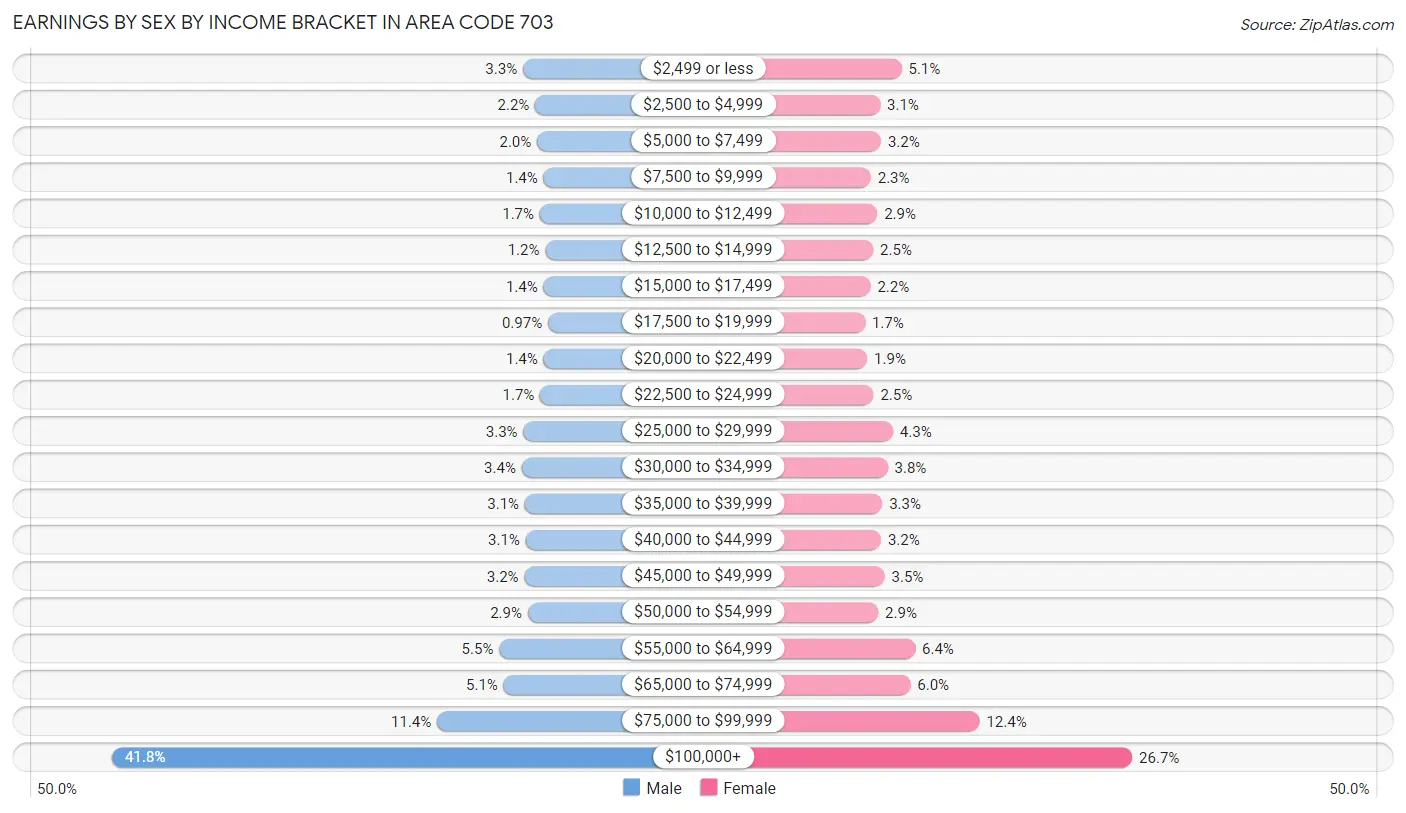
Earnings by Sex by Income Bracket in Area Code 703
The most common earnings brackets in Area Code 703 are $100,000+ for men (300,324 | 41.8%) and $100,000+ for women (166,418 | 26.7%).
| Income | Male | Female |
| $2,499 or less | 23,760 (3.3%) | 31,942 (5.1%) |
| $2,500 to $4,999 | 15,599 (2.2%) | 19,429 (3.1%) |
| $5,000 to $7,499 | 14,319 (2.0%) | 19,942 (3.2%) |
| $7,500 to $9,999 | 9,895 (1.4%) | 14,034 (2.2%) |
| $10,000 to $12,499 | 12,433 (1.7%) | 17,721 (2.9%) |
| $12,500 to $14,999 | 8,799 (1.2%) | 15,392 (2.5%) |
| $15,000 to $17,499 | 9,981 (1.4%) | 13,826 (2.2%) |
| $17,500 to $19,999 | 6,944 (1.0%) | 10,559 (1.7%) |
| $20,000 to $22,499 | 9,938 (1.4%) | 11,870 (1.9%) |
| $22,500 to $24,999 | 12,210 (1.7%) | 15,552 (2.5%) |
| $25,000 to $29,999 | 23,464 (3.3%) | 26,918 (4.3%) |
| $30,000 to $34,999 | 24,643 (3.4%) | 23,792 (3.8%) |
| $35,000 to $39,999 | 22,516 (3.1%) | 20,700 (3.3%) |
| $40,000 to $44,999 | 21,970 (3.1%) | 19,943 (3.2%) |
| $45,000 to $49,999 | 22,812 (3.2%) | 22,057 (3.5%) |
| $50,000 to $54,999 | 20,580 (2.9%) | 18,301 (2.9%) |
| $55,000 to $64,999 | 39,817 (5.5%) | 39,830 (6.4%) |
| $65,000 to $74,999 | 36,766 (5.1%) | 37,040 (5.9%) |
| $75,000 to $99,999 | 81,587 (11.4%) | 77,371 (12.4%) |
| $100,000+ | 300,324 (41.8%) | 166,418 (26.7%) |
| Total | 718,357 (100.0%) | 622,637 (100.0%) |
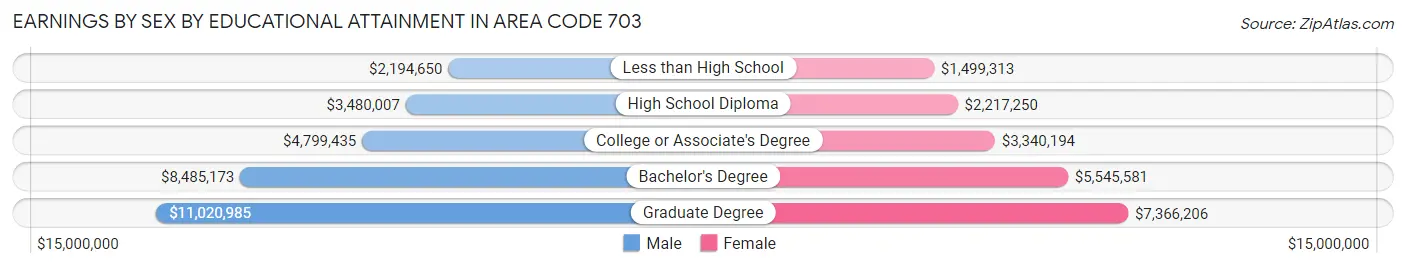
Earnings by Sex by Educational Attainment in Area Code 703
Average earnings in Area Code 703 are $7,828,678 for men and $5,202,321 for women, a difference of 33.6%. Men with an educational attainment of graduate degree enjoy the highest average annual earnings of $11,020,985, while those with less than high school education earn the least with $2,194,650. Women with an educational attainment of graduate degree earn the most with the average annual earnings of $7,366,206, while those with less than high school education have the smallest earnings of $1,499,313.
| Educational Attainment | Male Income | Female Income |
| Less than High School | $2,194,650 | $1,499,313 |
| High School Diploma | $3,480,007 | $2,217,250 |
| College or Associate's Degree | $4,799,435 | $3,340,194 |
| Bachelor's Degree | $8,485,173 | $5,545,581 |
| Graduate Degree | $11,020,985 | $7,366,206 |
| Total | $7,828,678 | $5,202,321 |
Family Income in Area Code 703
Family Income Brackets in Area Code 703
According to the Area Code 703 family income data, there are 17,430,702 families falling into the $200,000+ income range, which is the most common income bracket and makes up 3,192.6% of all families. Conversely, the $10,000 to $14,999 income bracket is the least frequent group with only 271,894 families (49.8%) belonging to this category.
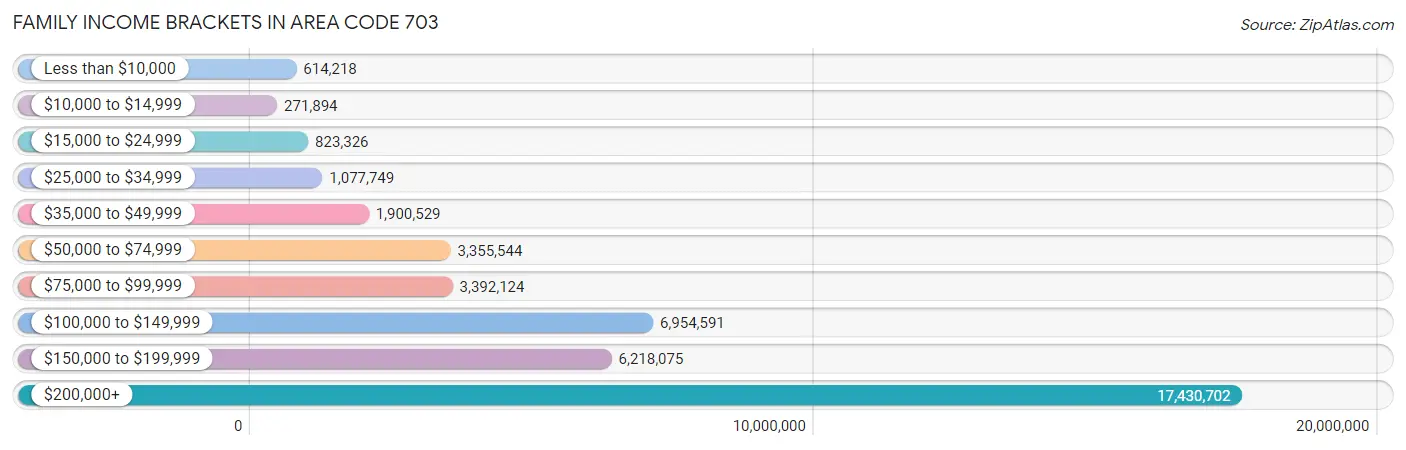
| Income Bracket | # Families | % Families |
| Less than $10,000 | 614,218 | 112.5% |
| $10,000 to $14,999 | 271,894 | 49.8% |
| $15,000 to $24,999 | 823,326 | 150.8% |
| $25,000 to $34,999 | 1,077,749 | 197.4% |
| $35,000 to $49,999 | 1,900,529 | 348.1% |
| $50,000 to $74,999 | 3,355,544 | 614.6% |
| $75,000 to $99,999 | 3,392,124 | 621.3% |
| $100,000 to $149,999 | 6,954,591 | 1,273.8% |
| $150,000 to $199,999 | 6,218,075 | 1,138.9% |
| $200,000+ | 17,430,702 | 3,192.6% |
Family Income by Famaliy Size in Area Code 703
4-person families (125,056 | 22.9%) account for the highest median family income in Area Code 703 with $187,979 per family, while 2-person families (213,151 | 39.0%) have the highest median income of $77,860 per family member.
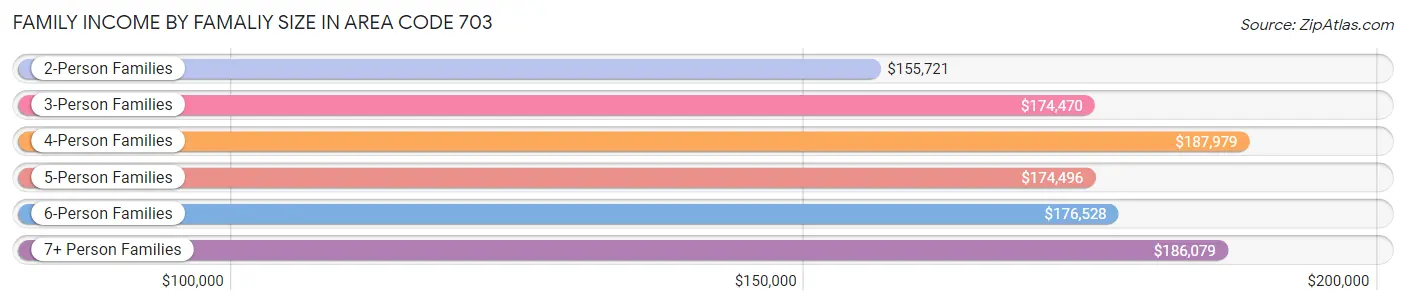
| Income Bracket | # Families | Median Income |
| 2-Person Families | 213,151 (39.0%) | $155,721 |
| 3-Person Families | 128,399 (23.5%) | $174,470 |
| 4-Person Families | 125,056 (22.9%) | $187,979 |
| 5-Person Families | 51,484 (9.4%) | $174,496 |
| 6-Person Families | 18,647 (3.4%) | $176,528 |
| 7+ Person Families | 9,235 (1.7%) | $186,079 |
| Total | 545,972 (100.0%) | $172,927 |
Family Income by Number of Earners in Area Code 703
The median family income in Area Code 703 is $172,927, with families comprising 3+ earners (82,353) having the highest median family income of $200,226, while families with no earners (42,456) have the lowest median family income of $104,981, accounting for 15.1% and 7.8% of families, respectively.
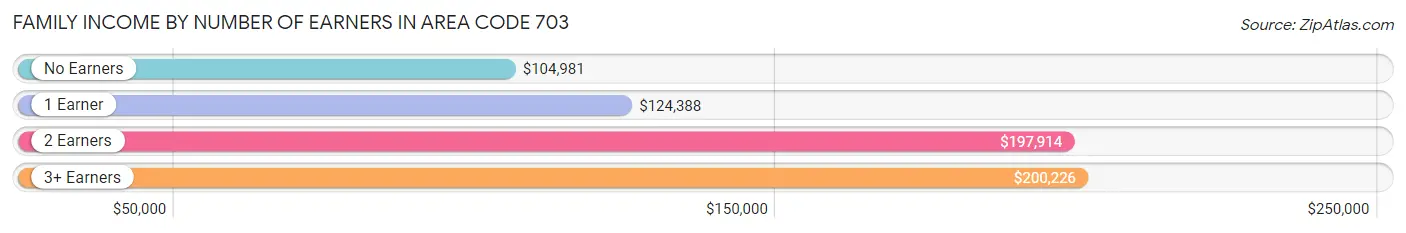
| Number of Earners | # Families | Median Income |
| No Earners | 42,456 (7.8%) | $104,981 |
| 1 Earner | 145,661 (26.7%) | $124,388 |
| 2 Earners | 275,502 (50.5%) | $197,914 |
| 3+ Earners | 82,353 (15.1%) | $200,226 |
| Total | 545,972 (100.0%) | $172,927 |
Household Income in Area Code 703
Household Income Brackets in Area Code 703
With 21,435,232 households falling in the category, the $200,000+ income range is the most frequent in Area Code 703, accounting for 2,602.2% of all households. In contrast, only 700,175 households (85.0%) fall into the $10,000 to $14,999 income bracket, making it the least populous group.
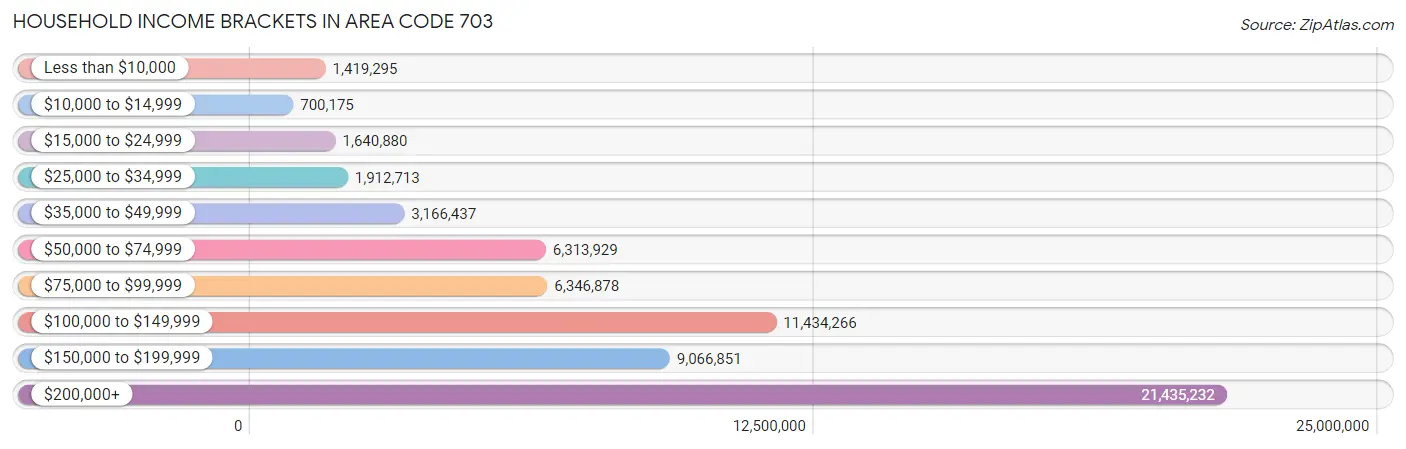
| Income Bracket | # Households | % Households |
| Less than $10,000 | 1,419,295 | 172.3% |
| $10,000 to $14,999 | 700,175 | 85.0% |
| $15,000 to $24,999 | 1,640,880 | 199.2% |
| $25,000 to $34,999 | 1,912,713 | 232.2% |
| $35,000 to $49,999 | 3,166,437 | 384.4% |
| $50,000 to $74,999 | 6,313,929 | 766.5% |
| $75,000 to $99,999 | 6,346,878 | 770.5% |
| $100,000 to $149,999 | 11,434,266 | 1,388.1% |
| $150,000 to $199,999 | 9,066,851 | 1,100.7% |
| $200,000+ | 21,435,232 | 2,602.2% |
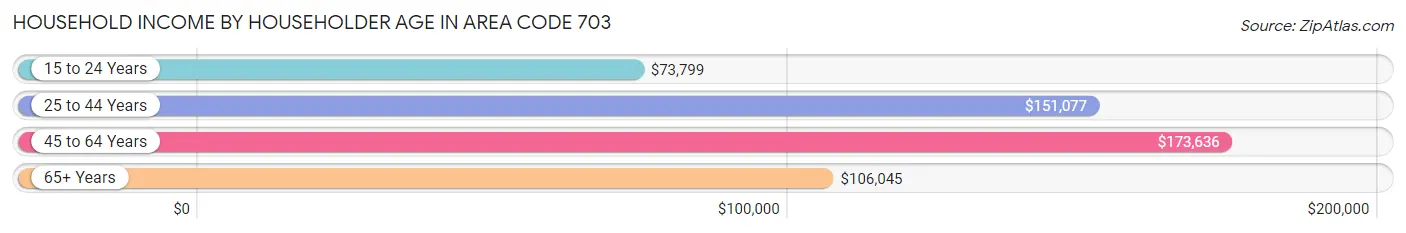
Household Income by Householder Age in Area Code 703
The median household income in Area Code 703 is $149,718, with the highest median household income of $173,636 found in the 45 to 64 years age bracket for the primary householder. A total of 320,832 households (39.0%) fall into this category. Meanwhile, the 15 to 24 years age bracket for the primary householder has the lowest median household income of $73,799, with 24,058 households (2.9%) in this group.
| Income Bracket | # Households | Median Income |
| 15 to 24 Years | 24,058 (2.9%) | $73,799 |
| 25 to 44 Years | 318,501 (38.7%) | $151,077 |
| 45 to 64 Years | 320,832 (39.0%) | $173,636 |
| 65+ Years | 160,344 (19.5%) | $106,045 |
| Total | 823,735 (100.0%) | $149,718 |
Poverty in Area Code 703
Income Below Poverty by Sex and Age in Area Code 703
With 5.2% poverty level for males and 6.7% for females among the residents of Area Code 703, 18 to 24 year old males and 18 to 24 year old females are the most vulnerable to poverty, with 8,107 males (9.0%) and 11,220 females (12.6%) in their respective age groups living below the poverty level.
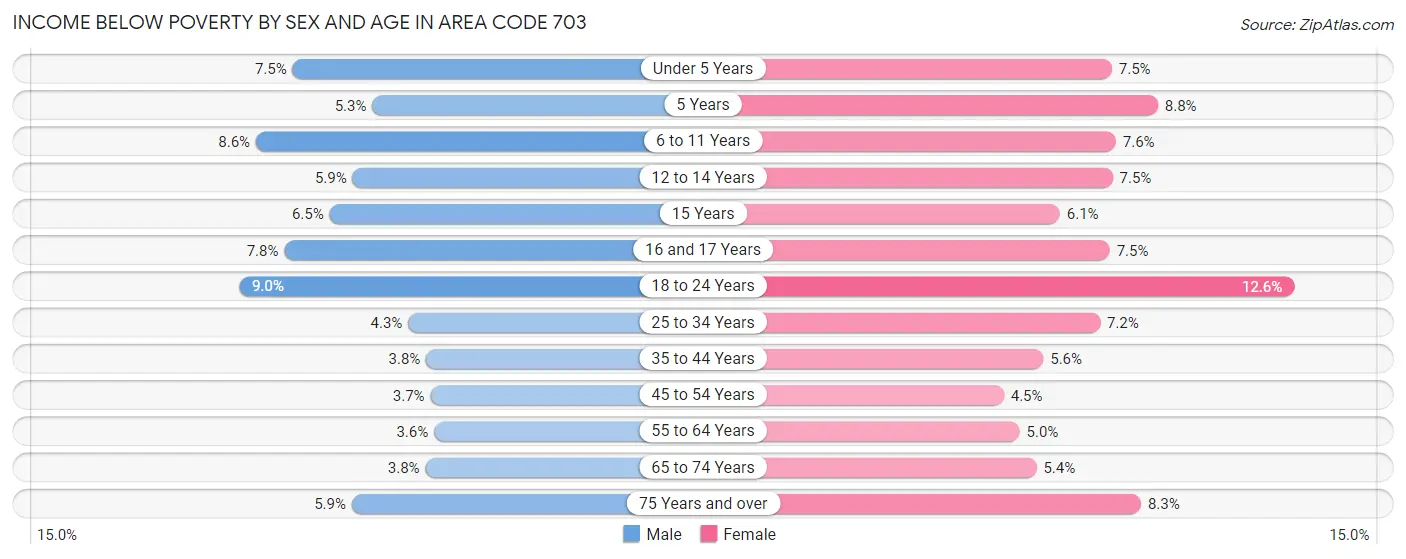
| Age Bracket | Male | Female |
| Under 5 Years | 5,368 (7.5%) | 5,024 (7.5%) |
| 5 Years | 746 (5.3%) | 1,185 (8.8%) |
| 6 to 11 Years | 7,885 (8.6%) | 6,446 (7.6%) |
| 12 to 14 Years | 2,710 (5.9%) | 3,376 (7.5%) |
| 15 Years | 957 (6.5%) | 901 (6.1%) |
| 16 and 17 Years | 2,433 (7.8%) | 2,132 (7.5%) |
| 18 to 24 Years | 8,107 (9.0%) | 11,220 (12.6%) |
| 25 to 34 Years | 6,994 (4.3%) | 11,563 (7.2%) |
| 35 to 44 Years | 6,743 (3.8%) | 9,767 (5.6%) |
| 45 to 54 Years | 5,930 (3.7%) | 7,015 (4.5%) |
| 55 to 64 Years | 4,718 (3.6%) | 6,475 (5.0%) |
| 65 to 74 Years | 3,014 (3.8%) | 4,700 (5.4%) |
| 75 Years and over | 2,644 (5.9%) | 5,107 (8.3%) |
| Total | 58,249 (5.2%) | 74,911 (6.7%) |
Income Above Poverty by Sex and Age in Area Code 703
According to the poverty statistics in Area Code 703, males aged 55 to 64 years and females aged 45 to 54 years are the age groups that are most secure financially, with 96.4% of males and 95.5% of females in these age groups living above the poverty line.
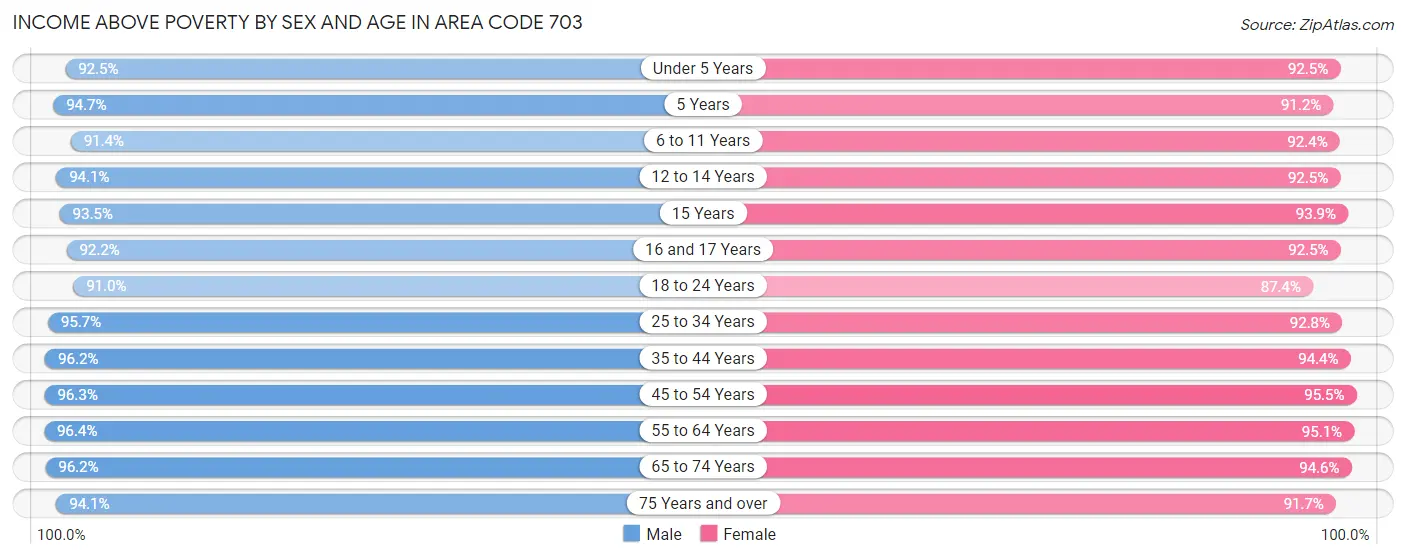
| Age Bracket | Male | Female |
| Under 5 Years | 65,802 (92.5%) | 61,782 (92.5%) |
| 5 Years | 13,282 (94.7%) | 12,276 (91.2%) |
| 6 to 11 Years | 84,251 (91.4%) | 78,089 (92.4%) |
| 12 to 14 Years | 43,442 (94.1%) | 41,406 (92.5%) |
| 15 Years | 13,735 (93.5%) | 13,940 (93.9%) |
| 16 and 17 Years | 28,860 (92.2%) | 26,457 (92.5%) |
| 18 to 24 Years | 81,711 (91.0%) | 77,915 (87.4%) |
| 25 to 34 Years | 155,083 (95.7%) | 149,364 (92.8%) |
| 35 to 44 Years | 169,967 (96.2%) | 164,244 (94.4%) |
| 45 to 54 Years | 154,184 (96.3%) | 148,471 (95.5%) |
| 55 to 64 Years | 126,194 (96.4%) | 124,214 (95.1%) |
| 65 to 74 Years | 75,540 (96.2%) | 81,981 (94.6%) |
| 75 Years and over | 42,244 (94.1%) | 56,226 (91.7%) |
| Total | 1,054,295 (94.8%) | 1,036,365 (93.3%) |
Income Below Poverty Among Married-Couple Families in Area Code 703
The poverty statistics for married-couple families in Area Code 703 show that 2.5% or 11,254 of the total 441,389 families live below the poverty line. Families with 5 or more children have the highest poverty rate of 12.8%, comprising of 263 families. On the other hand, families with no children have the lowest poverty rate of 1.8%, which includes 4,048 families.
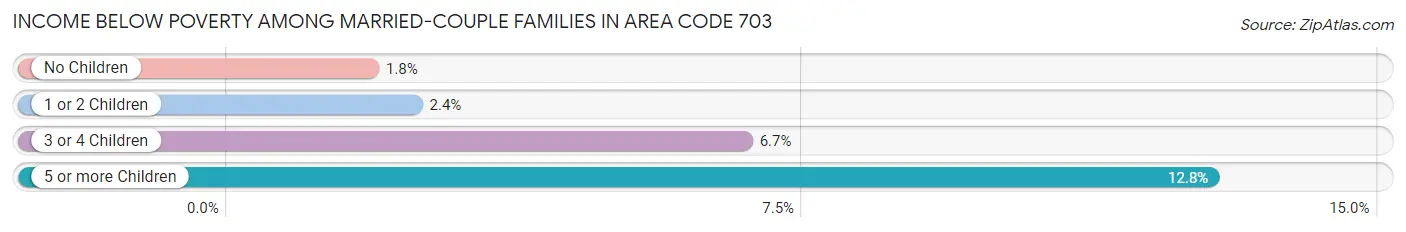
| Children | Above Poverty | Below Poverty |
| No Children | 216,498 (98.2%) | 4,048 (1.8%) |
| 1 or 2 Children | 175,892 (97.6%) | 4,352 (2.4%) |
| 3 or 4 Children | 35,956 (93.3%) | 2,591 (6.7%) |
| 5 or more Children | 1,789 (87.2%) | 263 (12.8%) |
| Total | 430,135 (97.5%) | 11,254 (2.5%) |
Income Below Poverty Among Single-Parent Households in Area Code 703
According to the poverty data in Area Code 703, 6.5% or 2,231 single-father households and 14.0% or 9,811 single-mother households are living below the poverty line. Among single-father households, those with 5 or more children have the highest poverty rate, with 15 households (20.5%) experiencing poverty. Likewise, among single-mother households, those with 5 or more children have the highest poverty rate, with 269 households (88.5%) falling below the poverty line.
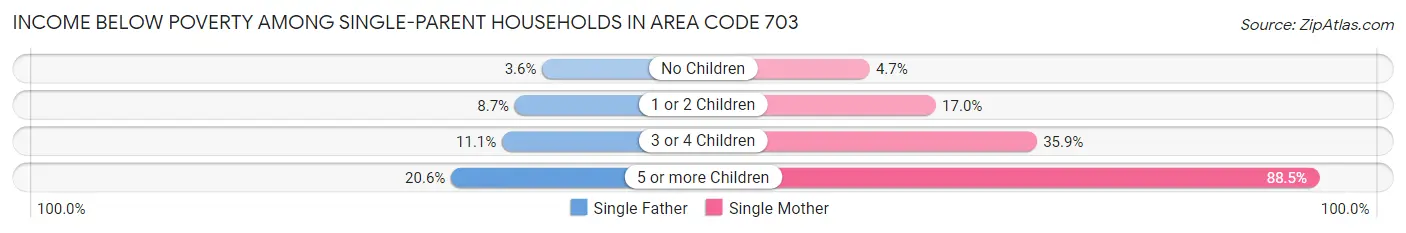
| Children | Single Father | Single Mother |
| No Children | 580 (3.6%) | 1,335 (4.7%) |
| 1 or 2 Children | 1,394 (8.7%) | 5,996 (17.0%) |
| 3 or 4 Children | 242 (11.1%) | 2,211 (35.9%) |
| 5 or more Children | 15 (20.5%) | 269 (88.5%) |
| Total | 2,231 (6.5%) | 9,811 (14.0%) |
Income Below Poverty Among Married-Couple vs Single-Parent Households in Area Code 703
The poverty data for Area Code 703 shows that 11,254 of the married-couple family households (2.5%) and 12,042 of the single-parent households (11.5%) are living below the poverty level. Within the married-couple family households, those with 5 or more children have the highest poverty rate, with 263 households (12.8%) falling below the poverty line. Among the single-parent households, those with 5 or more children have the highest poverty rate, with 284 household (75.3%) living below poverty.
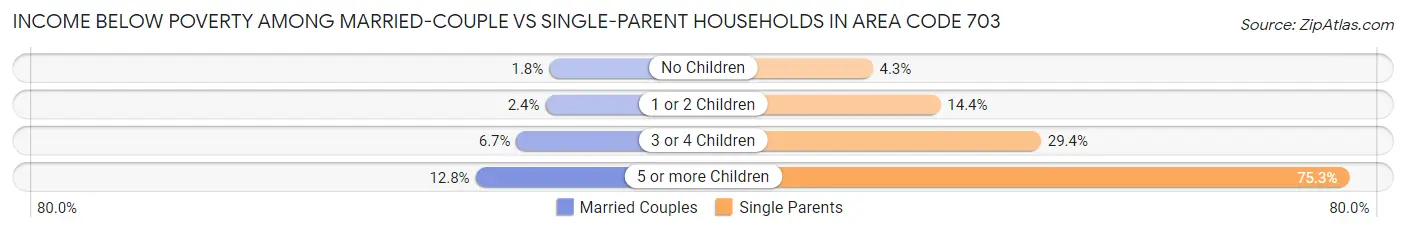
| Children | Married-Couple Families | Single-Parent Households |
| No Children | 4,048 (1.8%) | 1,915 (4.3%) |
| 1 or 2 Children | 4,352 (2.4%) | 7,390 (14.4%) |
| 3 or 4 Children | 2,591 (6.7%) | 2,453 (29.4%) |
| 5 or more Children | 263 (12.8%) | 284 (75.3%) |
| Total | 11,254 (2.5%) | 12,042 (11.5%) |
Race in Area Code 703
The most populous races in Area Code 703 are White / Caucasian (1,224,373 | 54.7%), Hispanic or Latino (411,576 | 18.4%), and Asian (362,018 | 16.2%).
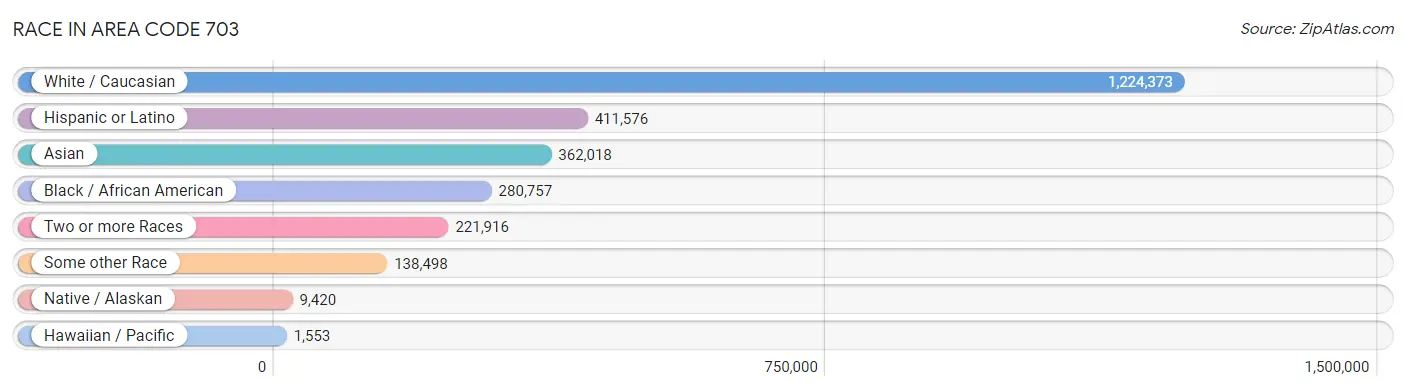
| Race | # Population | % Population |
| Asian | 362,018 | 16.2% |
| Black / African American | 280,757 | 12.5% |
| Hawaiian / Pacific | 1,553 | 0.1% |
| Hispanic or Latino | 411,576 | 18.4% |
| Native / Alaskan | 9,420 | 0.4% |
| White / Caucasian | 1,224,373 | 54.7% |
| Two or more Races | 221,916 | 9.9% |
| Some other Race | 138,498 | 6.2% |
| Total | 2,238,535 | 100.0% |
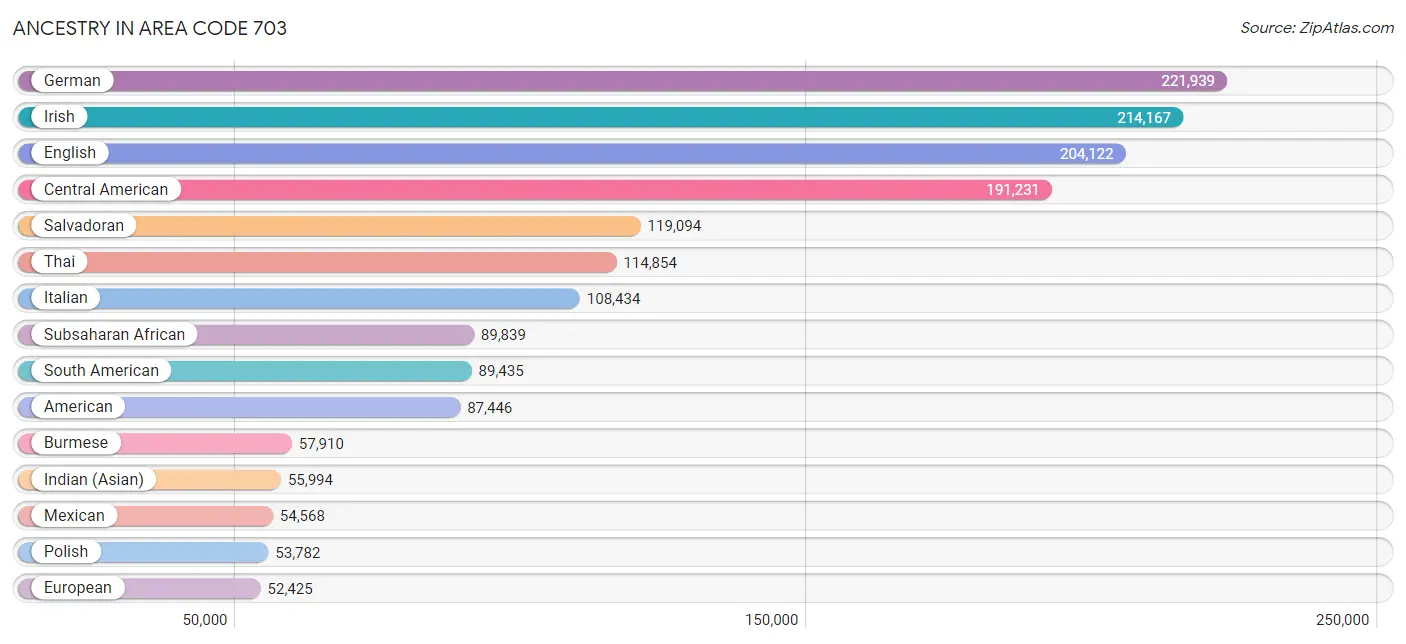
Ancestry in Area Code 703
The most populous ancestries reported in Area Code 703 are German (221,939 | 9.9%), Irish (214,167 | 9.6%), English (204,122 | 9.1%), Central American (191,231 | 8.5%), and Salvadoran (119,094 | 5.3%), together accounting for 42.5% of all Area Code 703 residents.
| Ancestry | # Population | % Population |
| Afghan | 14,454 | 0.6% |
| African | 18,785 | 0.8% |
| Alaska Native | 24 | 0.0% |
| Alaskan Athabascan | 40 | 0.0% |
| Albanian | 1,876 | 0.1% |
| Aleut | 22 | 0.0% |
| Alsatian | 83 | 0.0% |
| American | 87,446 | 3.9% |
| Apache | 365 | 0.0% |
| Arab | 49,441 | 2.2% |
| Argentinean | 4,908 | 0.2% |
| Armenian | 4,230 | 0.2% |
| Assyrian / Chaldean / Syriac | 215 | 0.0% |
| Australian | 1,452 | 0.1% |
| Austrian | 6,131 | 0.3% |
| Bahamian | 79 | 0.0% |
| Bangladeshi | 107 | 0.0% |
| Barbadian | 332 | 0.0% |
| Basque | 141 | 0.0% |
| Belgian | 1,724 | 0.1% |
| Belizean | 182 | 0.0% |
| Bermudan | 19 | 0.0% |
| Bhutanese | 13,764 | 0.6% |
| Blackfeet | 560 | 0.0% |
| Bolivian | 28,218 | 1.3% |
| Brazilian | 3,723 | 0.2% |
| British | 20,852 | 0.9% |
| British West Indian | 468 | 0.0% |
| Bulgarian | 1,972 | 0.1% |
| Burmese | 57,910 | 2.6% |
| Cajun | 416 | 0.0% |
| Cambodian | 2,330 | 0.1% |
| Canadian | 3,528 | 0.2% |
| Cape Verdean | 387 | 0.0% |
| Carpatho Rusyn | 128 | 0.0% |
| Celtic | 430 | 0.0% |
| Central American | 191,231 | 8.5% |
| Central American Indian | 5,296 | 0.2% |
| Cherokee | 3,905 | 0.2% |
| Cheyenne | 5 | 0.0% |
| Chickasaw | 221 | 0.0% |
| Chilean | 3,462 | 0.2% |
| Chinese | 206 | 0.0% |
| Chippewa | 285 | 0.0% |
| Choctaw | 539 | 0.0% |
| Colombian | 13,038 | 0.6% |
| Comanche | 64 | 0.0% |
| Costa Rican | 2,135 | 0.1% |
| Cree | 116 | 0.0% |
| Creek | 308 | 0.0% |
| Croatian | 2,385 | 0.1% |
| Crow | 39 | 0.0% |
| Cuban | 7,441 | 0.3% |
| Cypriot | 153 | 0.0% |
| Czech | 7,939 | 0.4% |
| Czechoslovakian | 1,368 | 0.1% |
| Danish | 6,385 | 0.3% |
| Delaware | 50 | 0.0% |
| Dominican | 5,752 | 0.3% |
| Dutch | 16,520 | 0.7% |
| Dutch West Indian | 62 | 0.0% |
| Eastern European | 10,829 | 0.5% |
| Ecuadorian | 5,559 | 0.3% |
| Egyptian | 7,760 | 0.4% |
| English | 204,122 | 9.1% |
| Estonian | 509 | 0.0% |
| Ethiopian | 33,341 | 1.5% |
| European | 52,425 | 2.3% |
| Fijian | 11 | 0.0% |
| Filipino | 3,429 | 0.2% |
| Finnish | 2,784 | 0.1% |
| French | 36,452 | 1.6% |
| French American Indian | 160 | 0.0% |
| French Canadian | 7,884 | 0.4% |
| German | 221,939 | 9.9% |
| German Russian | 132 | 0.0% |
| Ghanaian | 12,359 | 0.5% |
| Greek | 12,131 | 0.5% |
| Guamanian / Chamorro | 1,570 | 0.1% |
| Guatemalan | 31,083 | 1.4% |
| Guyanese | 418 | 0.0% |
| Haitian | 1,559 | 0.1% |
| Honduran | 27,625 | 1.2% |
| Hopi | 78 | 0.0% |
| Hungarian | 9,185 | 0.4% |
| Icelander | 234 | 0.0% |
| Indian (Asian) | 55,994 | 2.5% |
| Indonesian | 967 | 0.0% |
| Inupiat | 131 | 0.0% |
| Iranian | 15,624 | 0.7% |
| Iraqi | 4,097 | 0.2% |
| Irish | 214,167 | 9.6% |
| Iroquois | 474 | 0.0% |
| Israeli | 555 | 0.0% |
| Italian | 108,434 | 4.8% |
| Jamaican | 5,938 | 0.3% |
| Japanese | 4,605 | 0.2% |
| Jordanian | 3,406 | 0.2% |
| Kenyan | 1,701 | 0.1% |
| Kiowa | 145 | 0.0% |
| Korean | 42,497 | 1.9% |
| Laotian | 2,425 | 0.1% |
| Latvian | 1,050 | 0.1% |
| Lebanese | 8,485 | 0.4% |
| Liberian | 1,160 | 0.1% |
| Lithuanian | 5,248 | 0.2% |
| Lumbee | 402 | 0.0% |
| Luxembourger | 183 | 0.0% |
| Macedonian | 481 | 0.0% |
| Malaysian | 2,880 | 0.1% |
| Maltese | 118 | 0.0% |
| Mexican | 54,568 | 2.4% |
| Mexican American Indian | 2,387 | 0.1% |
| Mongolian | 984 | 0.0% |
| Moroccan | 7,749 | 0.4% |
| Native Hawaiian | 1,733 | 0.1% |
| Navajo | 221 | 0.0% |
| Nepalese | 110 | 0.0% |
| New Zealander | 339 | 0.0% |
| Nicaraguan | 6,767 | 0.3% |
| Nigerian | 4,259 | 0.2% |
| Northern European | 5,593 | 0.3% |
| Norwegian | 15,625 | 0.7% |
| Okinawan | 72 | 0.0% |
| Osage | 93 | 0.0% |
| Ottawa | 24 | 0.0% |
| Pakistani | 6,125 | 0.3% |
| Palestinian | 3,115 | 0.1% |
| Panamanian | 4,000 | 0.2% |
| Paraguayan | 886 | 0.0% |
| Pennsylvania German | 599 | 0.0% |
| Peruvian | 27,800 | 1.2% |
| Polish | 53,782 | 2.4% |
| Portuguese | 6,155 | 0.3% |
| Potawatomi | 53 | 0.0% |
| Pueblo | 277 | 0.0% |
| Puerto Rican | 30,540 | 1.4% |
| Puget Sound Salish | 11 | 0.0% |
| Romanian | 4,002 | 0.2% |
| Russian | 20,727 | 0.9% |
| Salvadoran | 119,094 | 5.3% |
| Samoan | 503 | 0.0% |
| Scandinavian | 5,480 | 0.2% |
| Scotch-Irish | 20,437 | 0.9% |
| Scottish | 38,156 | 1.7% |
| Seminole | 214 | 0.0% |
| Senegalese | 205 | 0.0% |
| Serbian | 1,856 | 0.1% |
| Shoshone | 19 | 0.0% |
| Sierra Leonean | 4,181 | 0.2% |
| Sioux | 421 | 0.0% |
| Slavic | 1,690 | 0.1% |
| Slovak | 6,256 | 0.3% |
| Slovene | 1,071 | 0.1% |
| Somali | 3,046 | 0.1% |
| South African | 1,103 | 0.1% |
| South American | 89,435 | 4.0% |
| South American Indian | 1,744 | 0.1% |
| Spaniard | 7,403 | 0.3% |
| Spanish | 5,142 | 0.2% |
| Spanish American | 245 | 0.0% |
| Spanish American Indian | 176 | 0.0% |
| Sri Lankan | 46,076 | 2.1% |
| Subsaharan African | 89,839 | 4.0% |
| Sudanese | 3,621 | 0.2% |
| Swedish | 18,597 | 0.8% |
| Swiss | 5,115 | 0.2% |
| Syrian | 2,559 | 0.1% |
| Taiwanese | 13 | 0.0% |
| Thai | 114,854 | 5.1% |
| Tlingit-Haida | 78 | 0.0% |
| Tongan | 132 | 0.0% |
| Trinidadian and Tobagonian | 1,959 | 0.1% |
| Turkish | 5,778 | 0.3% |
| U.S. Virgin Islander | 139 | 0.0% |
| Ugandan | 870 | 0.0% |
| Ukrainian | 10,044 | 0.4% |
| Uruguayan | 827 | 0.0% |
| Ute | 19 | 0.0% |
| Venezuelan | 4,322 | 0.2% |
| Vietnamese | 8,962 | 0.4% |
| Welsh | 14,288 | 0.6% |
| West Indian | 2,067 | 0.1% |
| Yaqui | 226 | 0.0% |
| Yugoslavian | 915 | 0.0% |
| Zimbabwean | 269 | 0.0% | View All 186 Rows |
Immigrants in Area Code 703
The most numerous immigrant groups reported in Area Code 703 came from Asia (285,466 | 12.8%), Latin America (209,534 | 9.4%), Central America (134,980 | 6.0%), South Central Asia (127,408 | 5.7%), and Africa (82,516 | 3.7%), together accounting for 37.5% of all Area Code 703 residents.
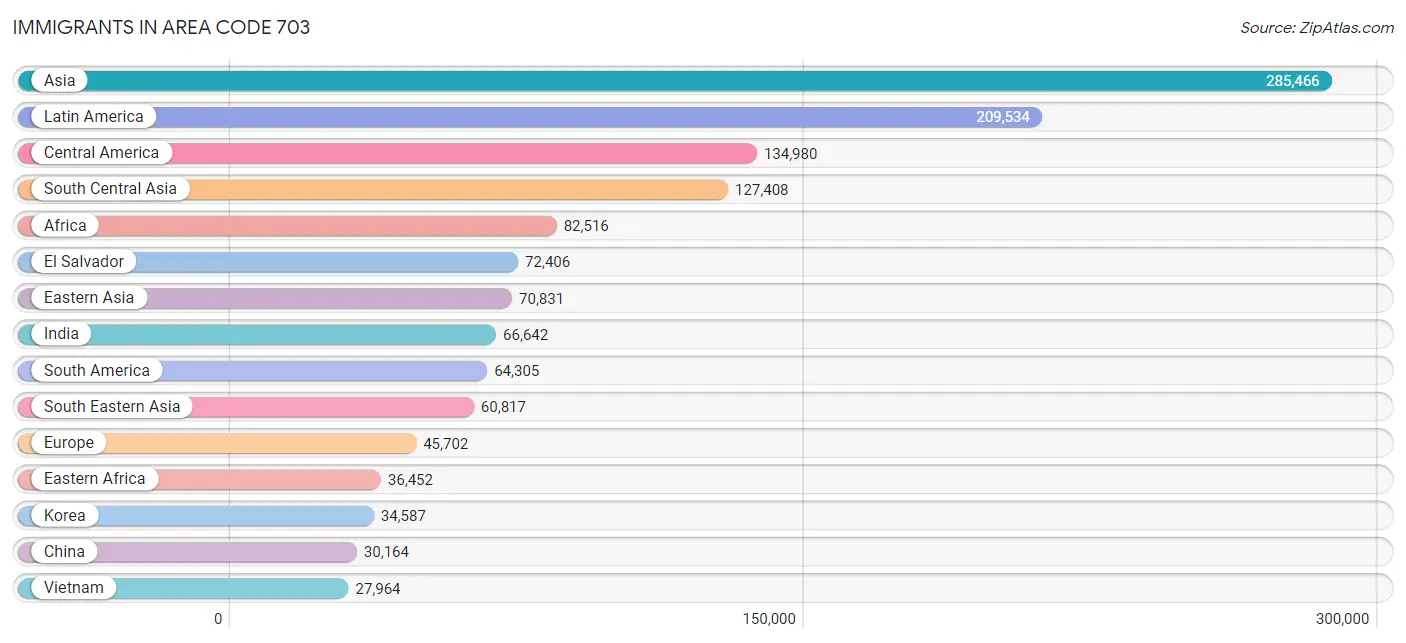
| Immigration Origin | # Population | % Population |
| Afghanistan | 13,694 | 0.6% |
| Africa | 82,516 | 3.7% |
| Albania | 1,169 | 0.1% |
| Argentina | 3,507 | 0.2% |
| Armenia | 519 | 0.0% |
| Asia | 285,466 | 12.8% |
| Australia | 1,143 | 0.1% |
| Austria | 642 | 0.0% |
| Azores | 6 | 0.0% |
| Bahamas | 36 | 0.0% |
| Bangladesh | 8,698 | 0.4% |
| Barbados | 195 | 0.0% |
| Belarus | 544 | 0.0% |
| Belgium | 328 | 0.0% |
| Belize | 125 | 0.0% |
| Bolivia | 19,188 | 0.9% |
| Bosnia and Herzegovina | 689 | 0.0% |
| Brazil | 3,734 | 0.2% |
| Bulgaria | 1,641 | 0.1% |
| Cabo Verde | 36 | 0.0% |
| Cambodia | 2,453 | 0.1% |
| Cameroon | 1,328 | 0.1% |
| Canada | 4,819 | 0.2% |
| Caribbean | 10,249 | 0.5% |
| Central America | 134,980 | 6.0% |
| Chile | 2,137 | 0.1% |
| China | 30,164 | 1.3% |
| Colombia | 8,464 | 0.4% |
| Congo | 270 | 0.0% |
| Costa Rica | 883 | 0.0% |
| Croatia | 207 | 0.0% |
| Cuba | 1,721 | 0.1% |
| Czechoslovakia | 640 | 0.0% |
| Denmark | 227 | 0.0% |
| Dominica | 105 | 0.0% |
| Dominican Republic | 2,281 | 0.1% |
| Eastern Africa | 36,452 | 1.6% |
| Eastern Asia | 70,831 | 3.2% |
| Eastern Europe | 19,074 | 0.9% |
| Ecuador | 2,776 | 0.1% |
| Egypt | 5,888 | 0.3% |
| El Salvador | 72,406 | 3.2% |
| England | 3,059 | 0.1% |
| Eritrea | 2,672 | 0.1% |
| Ethiopia | 26,849 | 1.2% |
| Europe | 45,702 | 2.0% |
| Fiji | 113 | 0.0% |
| France | 2,566 | 0.1% |
| Germany | 5,774 | 0.3% |
| Ghana | 11,838 | 0.5% |
| Greece | 1,506 | 0.1% |
| Grenada | 45 | 0.0% |
| Guatemala | 19,007 | 0.9% |
| Guyana | 836 | 0.0% |
| Haiti | 918 | 0.0% |
| Honduras | 18,510 | 0.8% |
| Hong Kong | 1,916 | 0.1% |
| Hungary | 597 | 0.0% |
| India | 66,642 | 3.0% |
| Indonesia | 1,651 | 0.1% |
| Iran | 10,794 | 0.5% |
| Iraq | 5,178 | 0.2% |
| Ireland | 1,143 | 0.1% |
| Israel | 943 | 0.0% |
| Italy | 2,114 | 0.1% |
| Jamaica | 2,562 | 0.1% |
| Japan | 4,409 | 0.2% |
| Jordan | 2,092 | 0.1% |
| Kazakhstan | 422 | 0.0% |
| Kenya | 1,900 | 0.1% |
| Korea | 34,587 | 1.5% |
| Kuwait | 838 | 0.0% |
| Laos | 1,423 | 0.1% |
| Latin America | 209,534 | 9.4% |
| Latvia | 179 | 0.0% |
| Lebanon | 3,502 | 0.2% |
| Liberia | 973 | 0.0% |
| Lithuania | 234 | 0.0% |
| Malaysia | 1,242 | 0.1% |
| Mexico | 17,819 | 0.8% |
| Micronesia | 27 | 0.0% |
| Middle Africa | 3,237 | 0.1% |
| Moldova | 753 | 0.0% |
| Morocco | 6,244 | 0.3% |
| Nepal | 7,012 | 0.3% |
| Netherlands | 984 | 0.0% |
| Nicaragua | 4,479 | 0.2% |
| Nigeria | 2,993 | 0.1% |
| North Macedonia | 270 | 0.0% |
| Northern Africa | 16,884 | 0.7% |
| Northern Europe | 9,885 | 0.4% |
| Norway | 179 | 0.0% |
| Oceania | 1,725 | 0.1% |
| Pakistan | 17,217 | 0.8% |
| Panama | 1,686 | 0.1% |
| Peru | 18,514 | 0.8% |
| Philippines | 20,735 | 0.9% |
| Poland | 1,947 | 0.1% |
| Portugal | 989 | 0.0% |
| Romania | 1,476 | 0.1% |
| Russia | 4,730 | 0.2% |
| Saudi Arabia | 2,513 | 0.1% |
| Scotland | 431 | 0.0% |
| Senegal | 367 | 0.0% |
| Serbia | 545 | 0.0% |
| Sierra Leone | 4,634 | 0.2% |
| Singapore | 277 | 0.0% |
| Somalia | 2,043 | 0.1% |
| South Africa | 1,579 | 0.1% |
| South America | 64,305 | 2.9% |
| South Central Asia | 127,408 | 5.7% |
| South Eastern Asia | 60,817 | 2.7% |
| Southern Europe | 5,953 | 0.3% |
| Spain | 1,344 | 0.1% |
| Sri Lanka | 1,515 | 0.1% |
| St. Vincent and the Grenadines | 28 | 0.0% |
| Sudan | 3,294 | 0.2% |
| Sweden | 599 | 0.0% |
| Switzerland | 320 | 0.0% |
| Syria | 1,733 | 0.1% |
| Taiwan | 4,548 | 0.2% |
| Thailand | 4,158 | 0.2% |
| Trinidad and Tobago | 1,826 | 0.1% |
| Turkey | 4,529 | 0.2% |
| Uganda | 613 | 0.0% |
| Ukraine | 2,451 | 0.1% |
| Uruguay | 473 | 0.0% |
| Uzbekistan | 581 | 0.0% |
| Venezuela | 3,739 | 0.2% |
| Vietnam | 27,964 | 1.3% |
| West Indies | 223 | 0.0% |
| Western Africa | 22,565 | 1.0% |
| Western Asia | 25,304 | 1.1% |
| Western Europe | 10,619 | 0.5% |
| Yemen | 622 | 0.0% |
| Zaire | 865 | 0.0% |
| Zimbabwe | 333 | 0.0% | View All 137 Rows |
Sex and Age in Area Code 703
Sex and Age in Area Code 703
The most populous age groups in Area Code 703 are 35 to 39 Years (89,799 | 8.0%) for men and 35 to 39 Years (89,814 | 8.0%) for women.
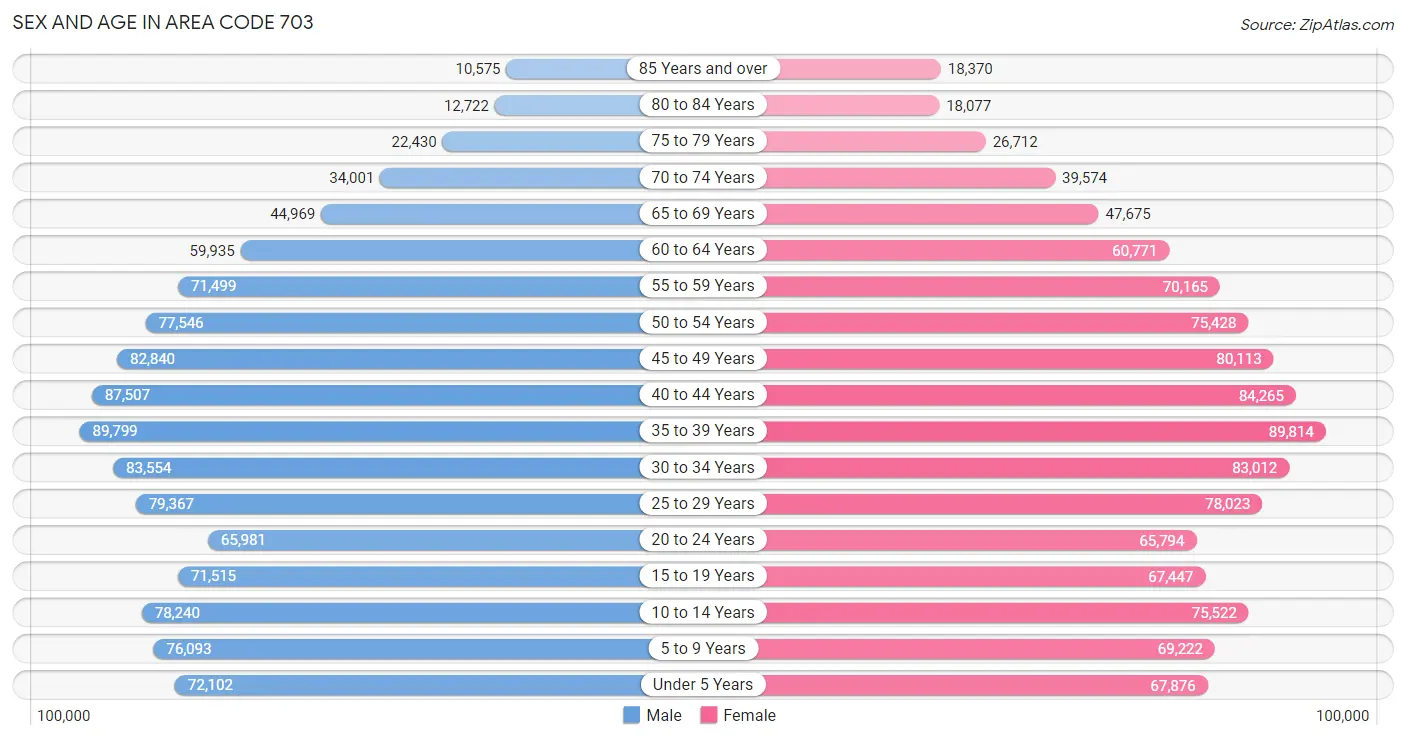
| Age Bracket | Male | Female |
| Under 5 Years | 72,102 (6.4%) | 67,876 (6.1%) |
| 5 to 9 Years | 76,093 (6.8%) | 69,222 (6.2%) |
| 10 to 14 Years | 78,240 (7.0%) | 75,522 (6.8%) |
| 15 to 19 Years | 71,515 (6.4%) | 67,447 (6.0%) |
| 20 to 24 Years | 65,981 (5.9%) | 65,794 (5.9%) |
| 25 to 29 Years | 79,367 (7.1%) | 78,023 (7.0%) |
| 30 to 34 Years | 83,554 (7.5%) | 83,012 (7.4%) |
| 35 to 39 Years | 89,799 (8.0%) | 89,814 (8.0%) |
| 40 to 44 Years | 87,507 (7.8%) | 84,265 (7.5%) |
| 45 to 49 Years | 82,840 (7.4%) | 80,113 (7.2%) |
| 50 to 54 Years | 77,546 (6.9%) | 75,428 (6.8%) |
| 55 to 59 Years | 71,499 (6.4%) | 70,165 (6.3%) |
| 60 to 64 Years | 59,935 (5.3%) | 60,771 (5.4%) |
| 65 to 69 Years | 44,969 (4.0%) | 47,675 (4.3%) |
| 70 to 74 Years | 34,001 (3.0%) | 39,574 (3.5%) |
| 75 to 79 Years | 22,430 (2.0%) | 26,712 (2.4%) |
| 80 to 84 Years | 12,722 (1.1%) | 18,077 (1.6%) |
| 85 Years and over | 10,575 (0.9%) | 18,370 (1.6%) |
| Total | 1,120,675 (100.0%) | 1,117,860 (100.0%) |
Families and Households in Area Code 703
Median Family Size in Area Code 703
The median family size in Area Code 703 is 3.24 persons per family, with married-couple families (441,389 | 80.8%) accounting for the largest median family size of 3.2787 persons per family. On the other hand, single male/father families (34,598 | 6.3%) represent the smallest median family size with 3.00 persons per family.
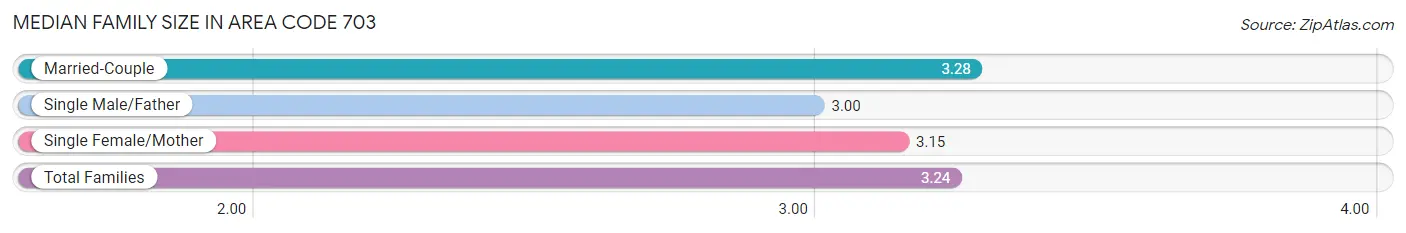
| Family Type | # Families | Family Size |
| Married-Couple | 441,389 (80.8%) | 3.28 |
| Single Male/Father | 34,598 (6.3%) | 3.00 |
| Single Female/Mother | 69,985 (12.8%) | 3.15 |
| Total Families | 545,972 (100.0%) | 3.24 |
Median Household Size in Area Code 703
The median household size in Area Code 703 is 2.70 persons per household, with single female/mother households (69,985 | 8.5%) accounting for the largest median household size of 3.37526 persons per household. non-family households (277,763 | 33.7%) represent the smallest median household size with 1.30 persons per household.
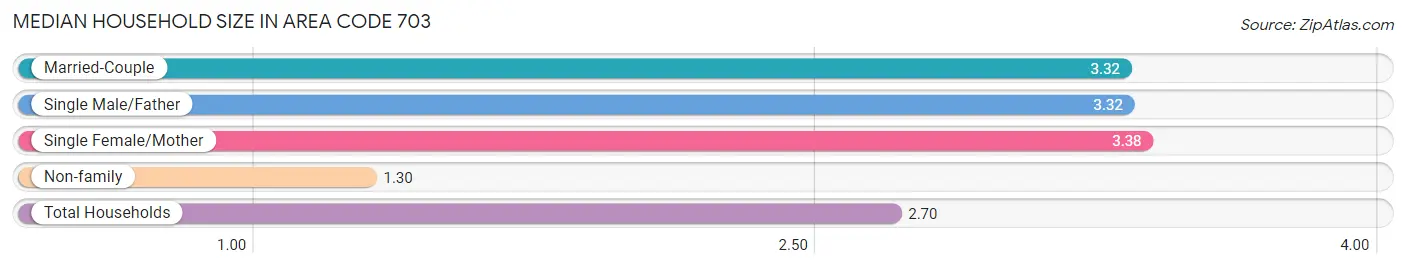
| Household Type | # Households | Household Size |
| Married-Couple | 441,389 (53.6%) | 3.32 |
| Single Male/Father | 34,598 (4.2%) | 3.32 |
| Single Female/Mother | 69,985 (8.5%) | 3.38 |
| Non-family | 277,763 (33.7%) | 1.30 |
| Total Households | 823,735 (100.0%) | 2.70 |
Household Size by Marriage Status in Area Code 703
Out of a total of 823,735 households in Area Code 703, 545,972 (66.3%) are family households, while 277,763 (33.7%) are nonfamily households. The most numerous type of family households are 2-person households, comprising 201,379, and the most common type of nonfamily households are 1-person households, comprising 217,034.
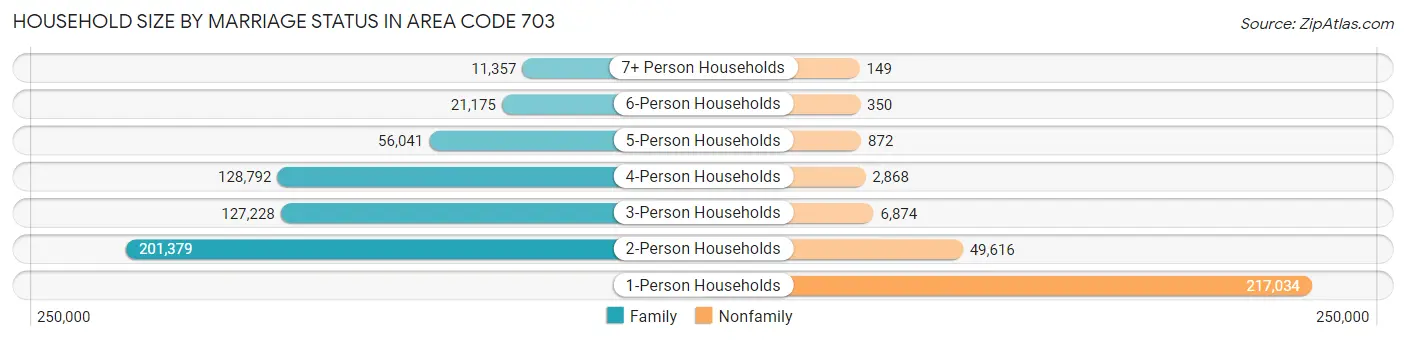
| Household Size | Family Households | Nonfamily Households |
| 1-Person Households | - | 217,034 (26.4%) |
| 2-Person Households | 201,379 (24.4%) | 49,616 (6.0%) |
| 3-Person Households | 127,228 (15.4%) | 6,874 (0.8%) |
| 4-Person Households | 128,792 (15.6%) | 2,868 (0.4%) |
| 5-Person Households | 56,041 (6.8%) | 872 (0.1%) |
| 6-Person Households | 21,175 (2.6%) | 350 (0.0%) |
| 7+ Person Households | 11,357 (1.4%) | 149 (0.0%) |
| Total | 545,972 (66.3%) | 277,763 (33.7%) |
Female Fertility in Area Code 703
Fertility by Age in Area Code 703
Average fertility rate in Area Code 703 is 49.7 births per 1,000 women. Women in the age bracket of 20 to 34 years have the highest fertility rate with 78.4 births per 1,000 women. Women in the age bracket of 20 to 34 years acount for 57.5% of all women with births.
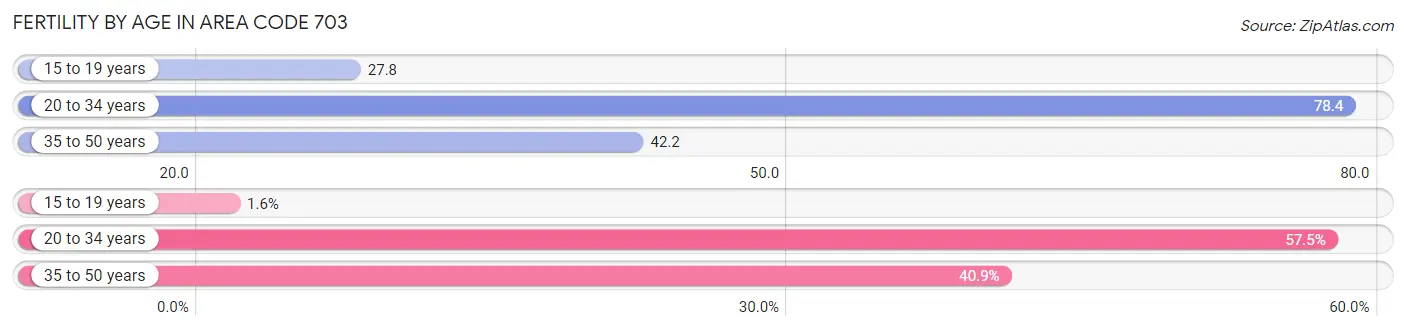
| Age Bracket | Women with Births | Births / 1,000 Women |
| 15 to 19 years | 442 (1.6%) | 27.8 |
| 20 to 34 years | 15,617 (57.5%) | 78.4 |
| 35 to 50 years | 11,107 (40.9%) | 42.2 |
| Total | 27,166 (100.0%) | 49.7 |
Fertility by Age by Marriage Status in Area Code 703
80.6% of women with births (27,166) in Area Code 703 are married. The highest percentage of unmarried women with births falls into 15 to 19 years age bracket with 100.0% of them unmarried at the time of birth, while the lowest percentage of unmarried women with births belong to 35 to 50 years age bracket with 22.4% of them unmarried.
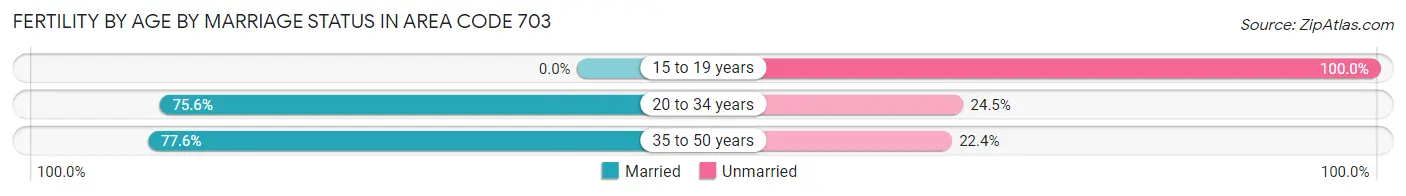
| Age Bracket | Married | Unmarried |
| 15 to 19 years | 0 (0.0%) | 442 (100.0%) |
| 20 to 34 years | 11,798 (75.5%) | 3,819 (24.4%) |
| 35 to 50 years | 8,620 (77.6%) | 2,487 (22.4%) |
| Total | 21,905 (80.6%) | 5,261 (19.4%) |
Fertility by Education in Area Code 703
Average fertility rate in Area Code 703 is 49.7 births per 1,000 women. Women with the education attainment of high school diploma have the highest fertility rate of 81.7 births per 1,000 women, while women with the education attainment of less than high school have the lowest fertility at 44.5 births per 1,000 women. Women with the education attainment of bachelor's degree represent 31.2% of all women with births.
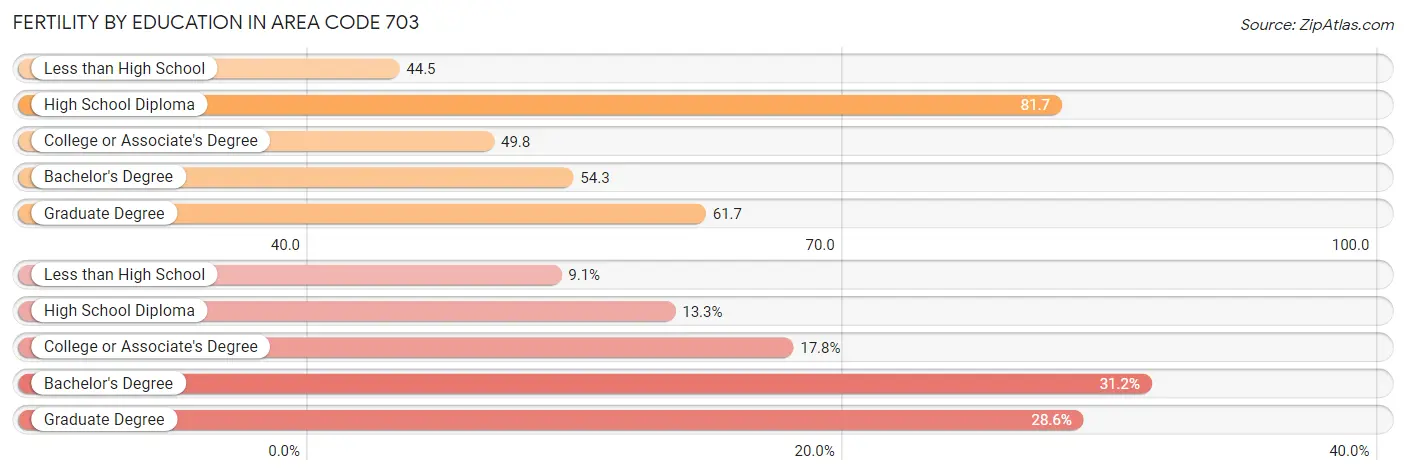
| Educational Attainment | Women with Births | Births / 1,000 Women |
| Less than High School | 2,463 (9.1%) | 44.5 |
| High School Diploma | 3,624 (13.3%) | 81.7 |
| College or Associate's Degree | 4,826 (17.8%) | 49.8 |
| Bachelor's Degree | 8,473 (31.2%) | 54.3 |
| Graduate Degree | 7,780 (28.6%) | 61.7 |
| Total | 27,166 (100.0%) | 49.7 |
Fertility by Education by Marriage Status in Area Code 703
19.4% of women with births in Area Code 703 are unmarried. Women with the educational attainment of bachelor's degree are most likely to be married with 82.0% of them married at childbirth, while women with the educational attainment of less than high school are least likely to be married with 72.9% of them unmarried at childbirth.
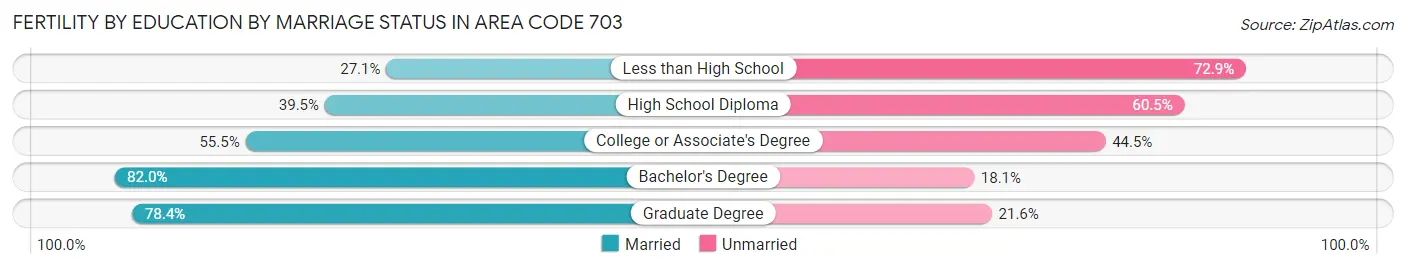
| Educational Attainment | Married | Unmarried |
| Less than High School | 668 (27.1%) | 1,795 (72.9%) |
| High School Diploma | 1,431 (39.5%) | 2,193 (60.5%) |
| College or Associate's Degree | 2,678 (55.5%) | 2,148 (44.5%) |
| Bachelor's Degree | 6,944 (82.0%) | 1,529 (18.0%) |
| Graduate Degree | 6,097 (78.4%) | 1,683 (21.6%) |
| Total | 21,905 (80.6%) | 5,261 (19.4%) |
Employment Characteristics in Area Code 703
Employment by Class of Employer in Area Code 703
Among the 1,232,380 employed individuals in Area Code 703, private company employees (724,551 | 58.8%), federal government employees (187,359 | 15.2%), and not-for-profit organizations (115,820 | 9.4%) make up the most common classes of employment.
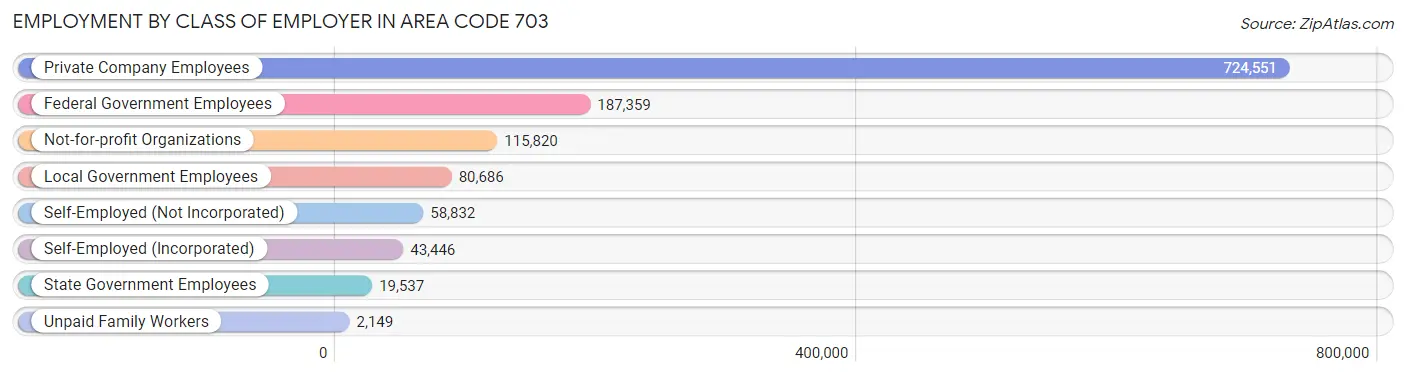
| Employer Class | # Employees | % Employees |
| Private Company Employees | 724,551 | 58.8% |
| Self-Employed (Incorporated) | 43,446 | 3.5% |
| Self-Employed (Not Incorporated) | 58,832 | 4.8% |
| Not-for-profit Organizations | 115,820 | 9.4% |
| Local Government Employees | 80,686 | 6.6% |
| State Government Employees | 19,537 | 1.6% |
| Federal Government Employees | 187,359 | 15.2% |
| Unpaid Family Workers | 2,149 | 0.2% |
| Total | 1,232,380 | 100.0% |
Employment Status by Age in Area Code 703
According to the labor force statistics for Area Code 703, out of the total population over 16 years of age (1,769,942), 73.0% or 1,291,173 individuals are in the labor force, with 4.1% or 53,067 of them unemployed. The age group with the highest labor force participation rate is 25 to 29 years, with 89.0% or 140,046 individuals in the labor force. Within the labor force, the 16 to 19 years age range has the highest percentage of unemployed individuals, with 882.2% or 343,661 of them being unemployed.
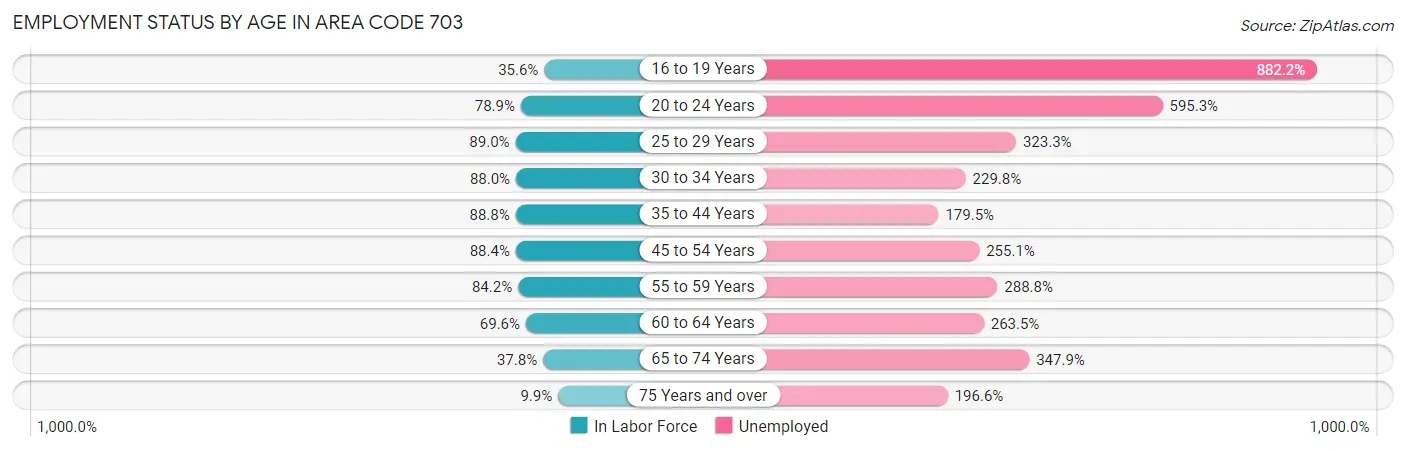
| Age Bracket | In Labor Force | Unemployed |
| 16 to 19 Years | 38,951 (35.6%) | 343,661 (882.2%) |
| 20 to 24 Years | 104,007 (78.9%) | 619,172 (595.3%) |
| 25 to 29 Years | 140,050 (89.0%) | 452,769 (323.3%) |
| 30 to 34 Years | 146,522 (88.0%) | 336,721 (229.8%) |
| 35 to 44 Years | 311,894 (88.8%) | 559,841 (179.5%) |
| 45 to 54 Years | 279,152 (88.4%) | 712,119 (255.1%) |
| 55 to 59 Years | 119,261 (84.2%) | 344,443 (288.8%) |
| 60 to 64 Years | 84,036 (69.6%) | 221,435 (263.5%) |
| 65 to 74 Years | 62,894 (37.8%) | 218,819 (347.9%) |
| 75 Years and over | 10,735 (9.9%) | 21,107 (196.6%) |
| Total | 1,291,115 (73.0%) | 53,074 (4.1%) |
Employment Status by Educational Attainment in Area Code 703
According to labor force statistics for Area Code 703, 85.9% of individuals (1,077,376) out of the total population between 25 and 64 years of age (1,253,638) are in the labor force, with 258.7% or 2,787,172 of them being unemployed. The group with the highest labor force participation rate are those with the educational attainment of bachelor's degree or higher, with 89.1% or 702,337 individuals in the labor force. Within the labor force, individuals with less than high school education have the highest percentage of unemployment, with 460.0% or 282,872 of them being unemployed.
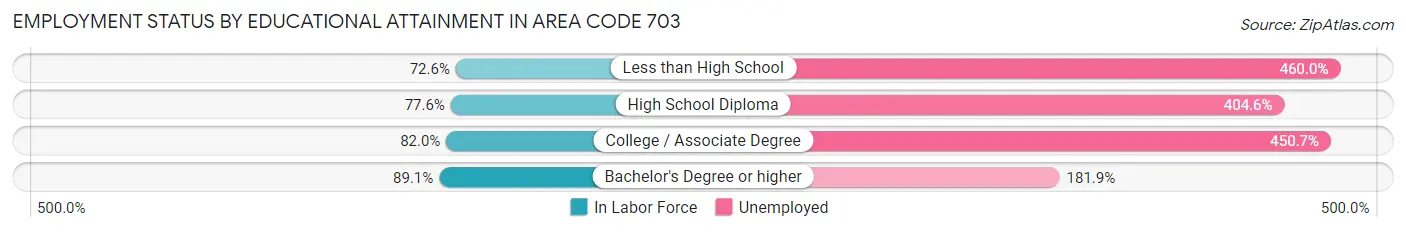
| Educational Attainment | In Labor Force | Unemployed |
| Less than High School | 61,497 (72.6%) | 389,634 (460.0%) |
| High School Diploma | 119,354 (77.6%) | 622,368 (404.6%) |
| College / Associate Degree | 185,964 (82.0%) | 1,021,638 (450.7%) |
| Bachelor's Degree or higher | 702,300 (89.1%) | 1,434,161 (181.9%) |
| Total | 1,077,396 (85.9%) | 3,243,162 (258.7%) |
Employment Occupations by Sex in Area Code 703
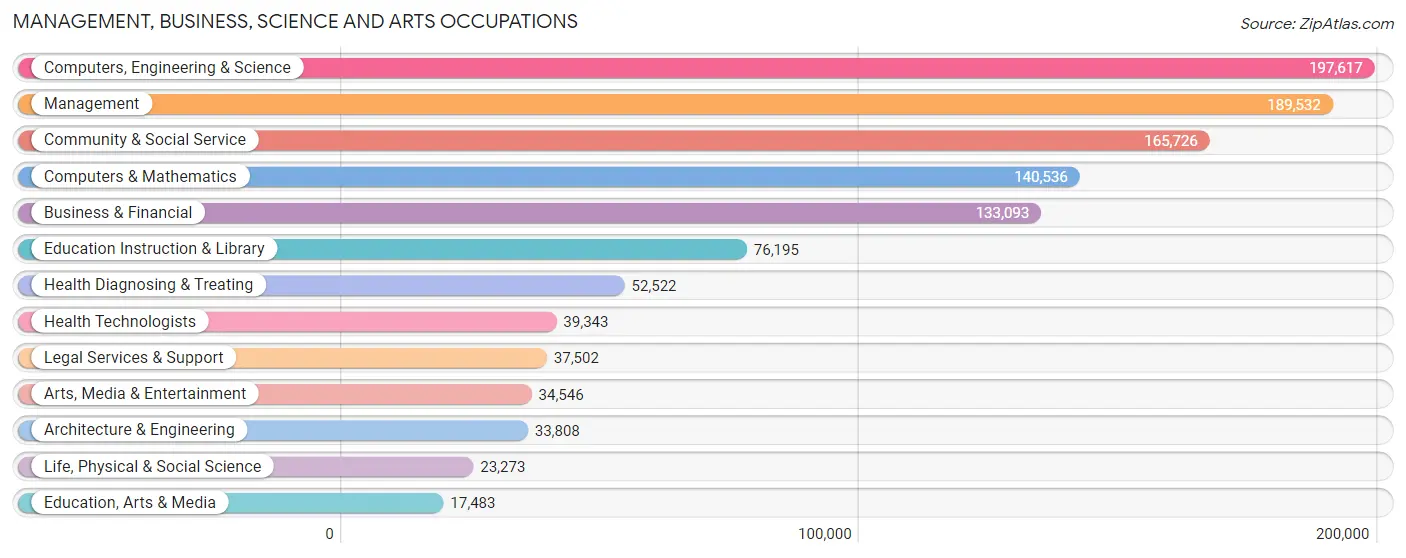
Management, Business, Science and Arts Occupations
The most common Management, Business, Science and Arts occupations in Area Code 703 are Computers, Engineering & Science (197,617 | 16.1%), Management (189,532 | 15.4%), Community & Social Service (165,726 | 13.5%), Computers & Mathematics (140,536 | 11.4%), and Business & Financial (133,093 | 10.8%).
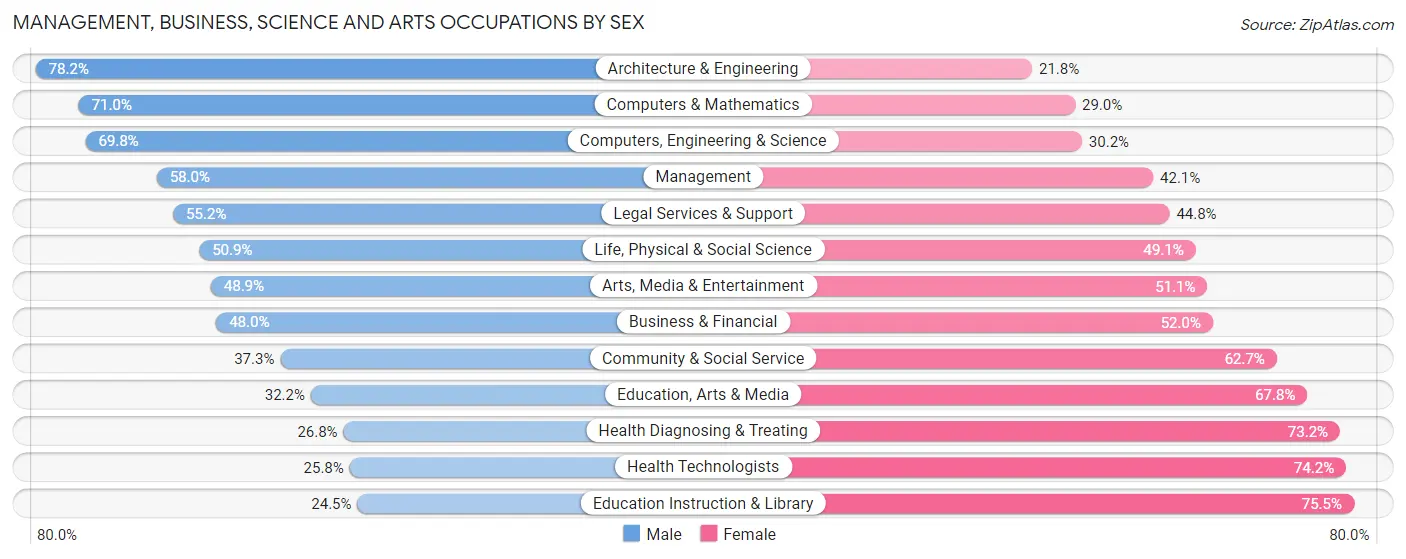
Management, Business, Science and Arts Occupations by Sex
Within the Management, Business, Science and Arts occupations in Area Code 703, the most male-oriented occupations are Architecture & Engineering (78.2%), Computers & Mathematics (71.0%), and Computers, Engineering & Science (69.8%), while the most female-oriented occupations are Education Instruction & Library (75.5%), Health Technologists (74.2%), and Health Diagnosing & Treating (73.2%).
| Occupation | Male | Female |
| Management | 109,835 (58.0%) | 79,697 (42.0%) |
| Business & Financial | 63,892 (48.0%) | 69,201 (52.0%) |
| Computers, Engineering & Science | 138,010 (69.8%) | 59,607 (30.2%) |
| Computers & Mathematics | 99,750 (71.0%) | 40,786 (29.0%) |
| Architecture & Engineering | 26,424 (78.2%) | 7,384 (21.8%) |
| Life, Physical & Social Science | 11,836 (50.9%) | 11,437 (49.1%) |
| Community & Social Service | 61,887 (37.3%) | 103,839 (62.7%) |
| Education, Arts & Media | 5,636 (32.2%) | 11,847 (67.8%) |
| Legal Services & Support | 20,713 (55.2%) | 16,789 (44.8%) |
| Education Instruction & Library | 18,642 (24.5%) | 57,553 (75.5%) |
| Arts, Media & Entertainment | 16,896 (48.9%) | 17,650 (51.1%) |
| Health Diagnosing & Treating | 14,072 (26.8%) | 38,450 (73.2%) |
| Health Technologists | 10,135 (25.8%) | 29,208 (74.2%) |
| Total (Category) | 387,696 (52.5%) | 350,794 (47.5%) |
| Total (Overall) | 657,678 (53.5%) | 572,269 (46.5%) |
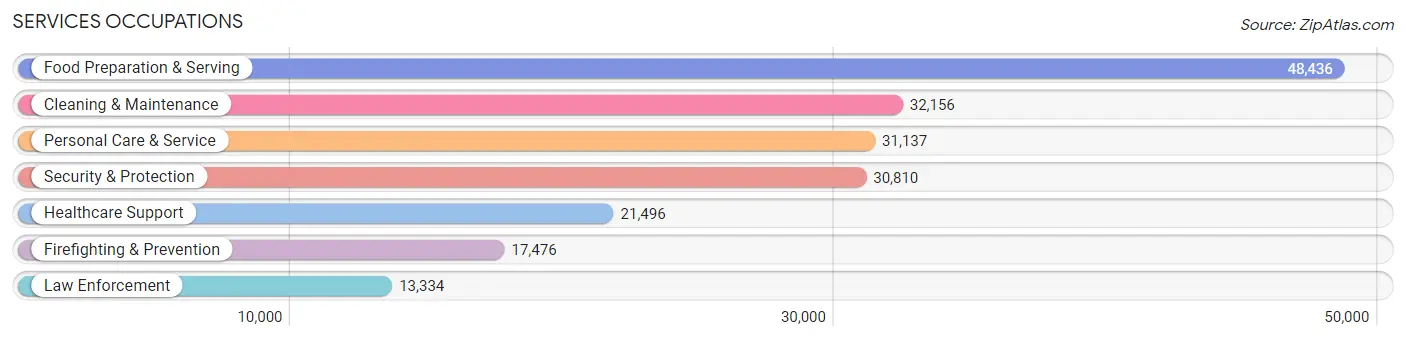
Services Occupations
The most common Services occupations in Area Code 703 are Food Preparation & Serving (48,436 | 3.9%), Cleaning & Maintenance (32,156 | 2.6%), Personal Care & Service (31,137 | 2.5%), Security & Protection (30,810 | 2.5%), and Healthcare Support (21,496 | 1.8%).
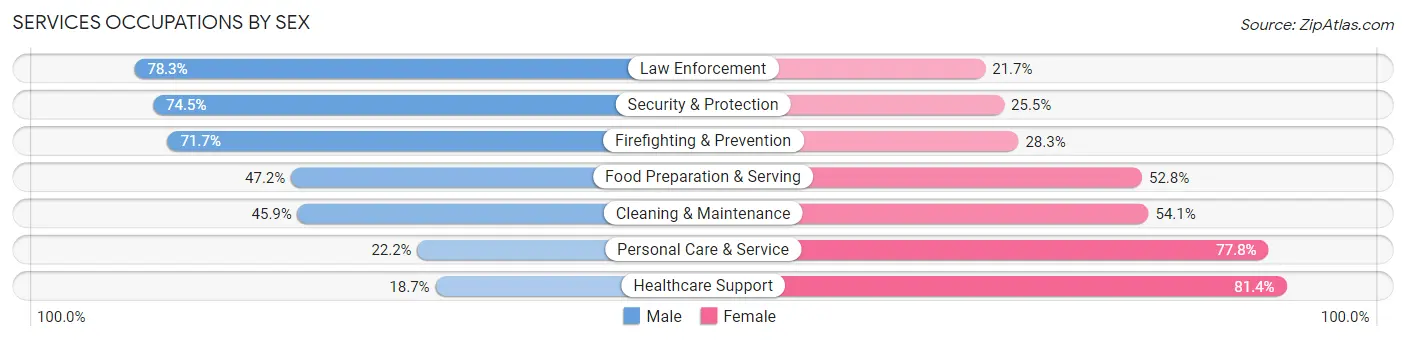
Services Occupations by Sex
Within the Services occupations in Area Code 703, the most male-oriented occupations are Law Enforcement (78.3%), Security & Protection (74.5%), and Firefighting & Prevention (71.7%), while the most female-oriented occupations are Healthcare Support (81.4%), Personal Care & Service (77.8%), and Cleaning & Maintenance (54.1%).
| Occupation | Male | Female |
| Healthcare Support | 4,009 (18.6%) | 17,487 (81.4%) |
| Security & Protection | 22,967 (74.5%) | 7,843 (25.5%) |
| Firefighting & Prevention | 12,530 (71.7%) | 4,946 (28.3%) |
| Law Enforcement | 10,437 (78.3%) | 2,897 (21.7%) |
| Food Preparation & Serving | 22,874 (47.2%) | 25,562 (52.8%) |
| Cleaning & Maintenance | 14,774 (45.9%) | 17,382 (54.1%) |
| Personal Care & Service | 6,916 (22.2%) | 24,221 (77.8%) |
| Total (Category) | 71,540 (43.6%) | 92,495 (56.4%) |
| Total (Overall) | 657,678 (53.5%) | 572,269 (46.5%) |
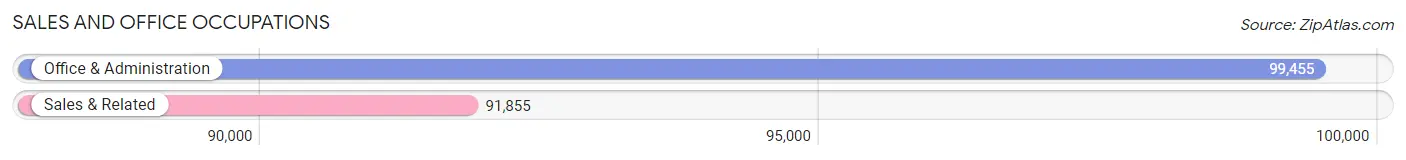
Sales and Office Occupations
The most common Sales and Office occupations in Area Code 703 are Office & Administration (99,455 | 8.1%), and Sales & Related (91,855 | 7.5%).
Sales and Office Occupations by Sex
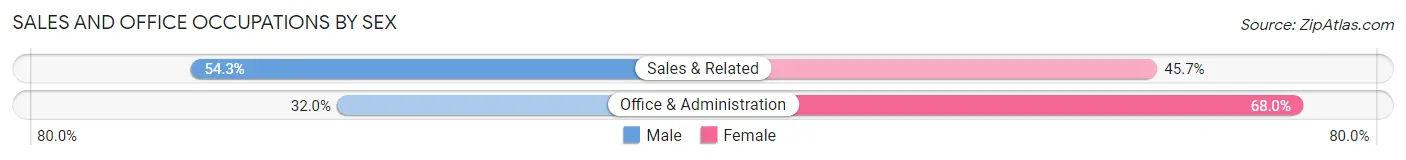
| Occupation | Male | Female |
| Sales & Related | 49,902 (54.3%) | 41,953 (45.7%) |
| Office & Administration | 31,789 (32.0%) | 67,666 (68.0%) |
| Total (Category) | 81,691 (42.7%) | 109,619 (57.3%) |
| Total (Overall) | 657,678 (53.5%) | 572,269 (46.5%) |
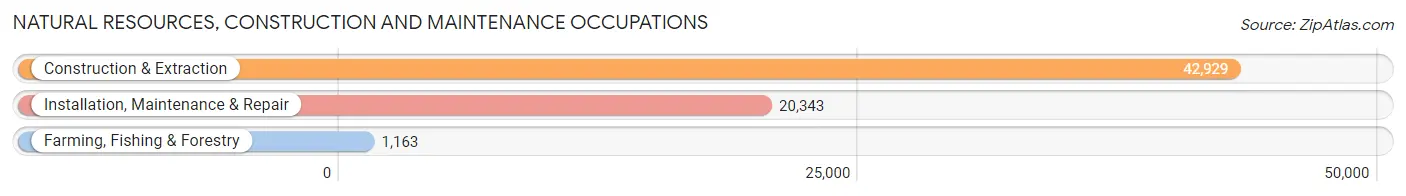
Natural Resources, Construction and Maintenance Occupations
The most common Natural Resources, Construction and Maintenance occupations in Area Code 703 are Construction & Extraction (42,929 | 3.5%), Installation, Maintenance & Repair (20,343 | 1.7%), and Farming, Fishing & Forestry (1,163 | 0.1%).
Natural Resources, Construction and Maintenance Occupations by Sex
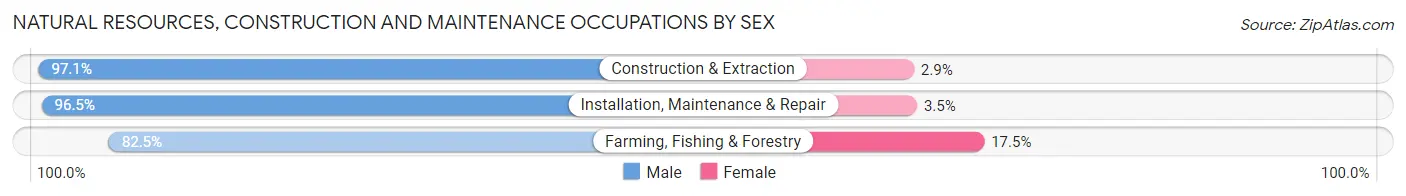
| Occupation | Male | Female |
| Farming, Fishing & Forestry | 959 (82.5%) | 204 (17.5%) |
| Construction & Extraction | 41,680 (97.1%) | 1,249 (2.9%) |
| Installation, Maintenance & Repair | 19,623 (96.5%) | 720 (3.5%) |
| Total (Category) | 62,262 (96.6%) | 2,173 (3.4%) |
| Total (Overall) | 657,678 (53.5%) | 572,269 (46.5%) |
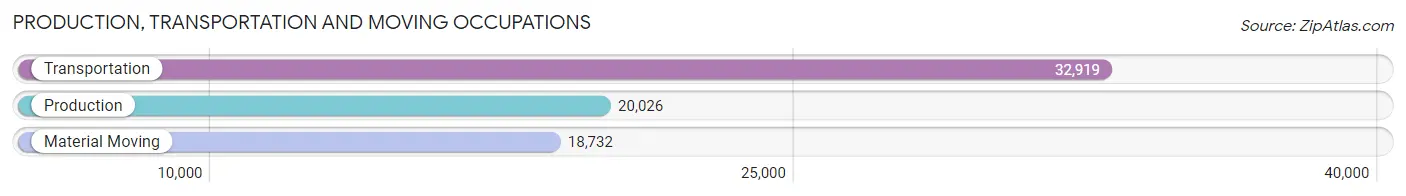
Production, Transportation and Moving Occupations
The most common Production, Transportation and Moving occupations in Area Code 703 are Transportation (32,919 | 2.7%), Production (20,026 | 1.6%), and Material Moving (18,732 | 1.5%).
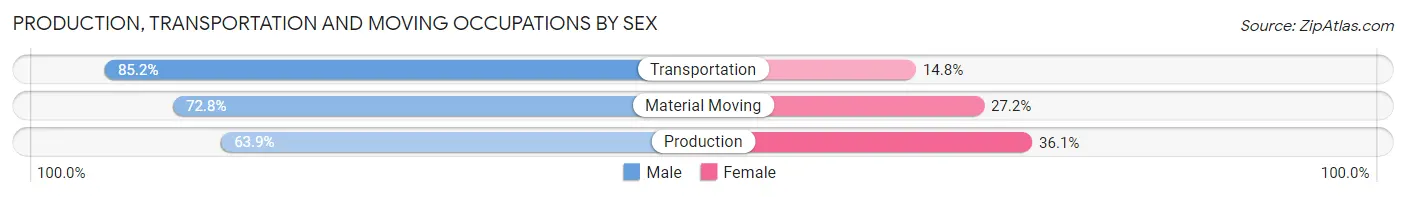
Production, Transportation and Moving Occupations by Sex
| Occupation | Male | Female |
| Production | 12,800 (63.9%) | 7,226 (36.1%) |
| Transportation | 28,059 (85.2%) | 4,860 (14.8%) |
| Material Moving | 13,630 (72.8%) | 5,102 (27.2%) |
| Total (Category) | 54,489 (76.0%) | 17,188 (24.0%) |
| Total (Overall) | 657,678 (53.5%) | 572,269 (46.5%) |
Employment Industries by Sex in Area Code 703
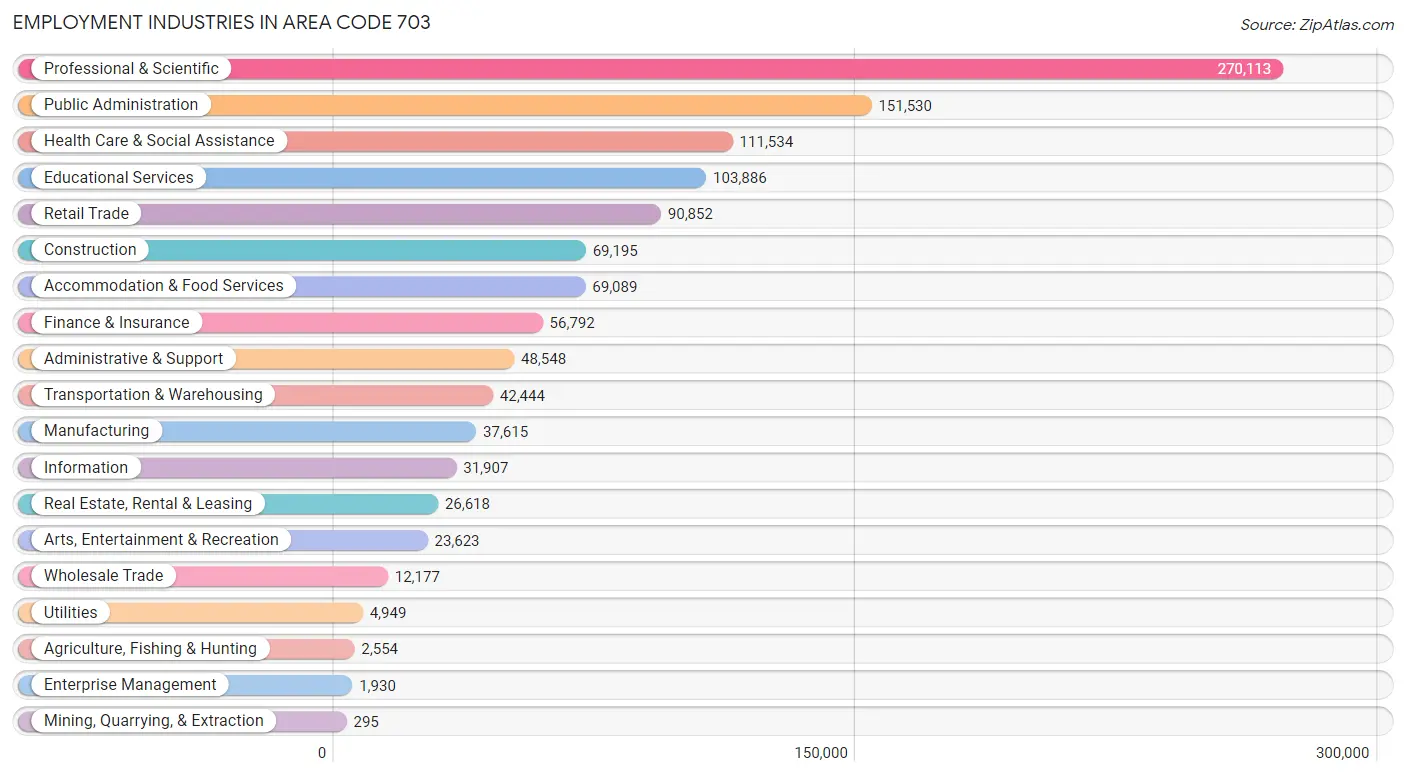
Employment Industries in Area Code 703
The major employment industries in Area Code 703 include Professional & Scientific (270,113 | 22.0%), Public Administration (151,530 | 12.3%), Health Care & Social Assistance (111,534 | 9.1%), Educational Services (103,886 | 8.5%), and Retail Trade (90,852 | 7.4%).
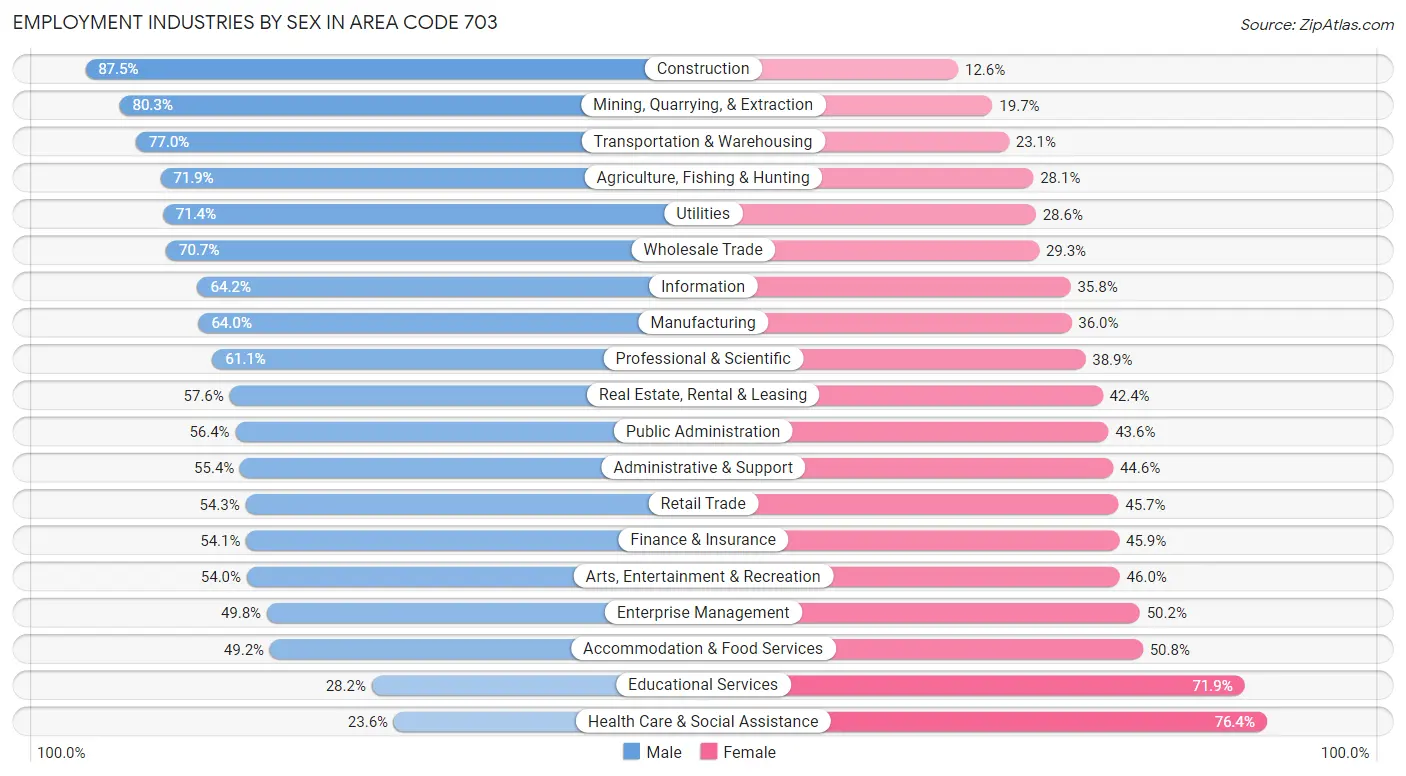
Employment Industries by Sex in Area Code 703
The Area Code 703 industries that see more men than women are Construction (87.5%), Mining, Quarrying, & Extraction (80.3%), and Transportation & Warehousing (76.9%), whereas the industries that tend to have a higher number of women are Health Care & Social Assistance (76.4%), Educational Services (71.9%), and Accommodation & Food Services (50.8%).
| Industry | Male | Female |
| Agriculture, Fishing & Hunting | 1,836 (71.9%) | 718 (28.1%) |
| Mining, Quarrying, & Extraction | 237 (80.3%) | 58 (19.7%) |
| Construction | 60,513 (87.5%) | 8,682 (12.6%) |
| Manufacturing | 24,074 (64.0%) | 13,541 (36.0%) |
| Wholesale Trade | 8,610 (70.7%) | 3,567 (29.3%) |
| Retail Trade | 49,304 (54.3%) | 41,548 (45.7%) |
| Transportation & Warehousing | 32,659 (76.9%) | 9,785 (23.1%) |
| Utilities | 3,532 (71.4%) | 1,417 (28.6%) |
| Information | 20,479 (64.2%) | 11,428 (35.8%) |
| Finance & Insurance | 30,728 (54.1%) | 26,064 (45.9%) |
| Real Estate, Rental & Leasing | 15,321 (57.6%) | 11,297 (42.4%) |
| Professional & Scientific | 165,081 (61.1%) | 105,032 (38.9%) |
| Enterprise Management | 962 (49.8%) | 968 (50.2%) |
| Administrative & Support | 26,884 (55.4%) | 21,664 (44.6%) |
| Educational Services | 29,241 (28.1%) | 74,645 (71.9%) |
| Health Care & Social Assistance | 26,281 (23.6%) | 85,253 (76.4%) |
| Arts, Entertainment & Recreation | 12,756 (54.0%) | 10,867 (46.0%) |
| Accommodation & Food Services | 34,005 (49.2%) | 35,084 (50.8%) |
| Public Administration | 85,399 (56.4%) | 66,131 (43.6%) |
| Total | 657,678 (53.5%) | 572,269 (46.5%) |
Education in Area Code 703
School Enrollment in Area Code 703
The most common levels of schooling among the 578,305 students in Area Code 703 are high school (124,556 | 21.5%), middle school (121,797 | 21.1%), and elementary school (115,604 | 20.0%).
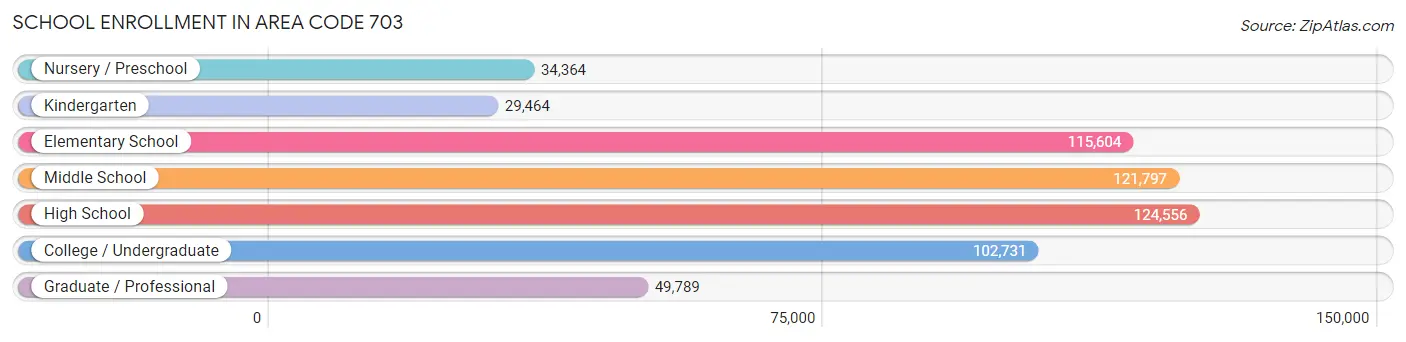
| School Level | # Students | % Students |
| Nursery / Preschool | 34,364 | 5.9% |
| Kindergarten | 29,464 | 5.1% |
| Elementary School | 115,604 | 20.0% |
| Middle School | 121,797 | 21.1% |
| High School | 124,556 | 21.5% |
| College / Undergraduate | 102,731 | 17.8% |
| Graduate / Professional | 49,789 | 8.6% |
| Total | 578,305 | 100.0% |
School Enrollment by Age by Funding Source in Area Code 703
Out of a total of 578,305 students who are enrolled in schools in Area Code 703, 111,521 (19.3%) attend a private institution, while the remaining 466,784 (80.7%) are enrolled in public schools. The age group of 3 to 4 year olds has the highest likelihood of being enrolled in private schools, with 19,024 (67.6% in the age bracket) enrolled. Conversely, the age group of 15 to 17 year olds has the lowest likelihood of being enrolled in a private school, with 78,729 (90.2% in the age bracket) attending a public institution.
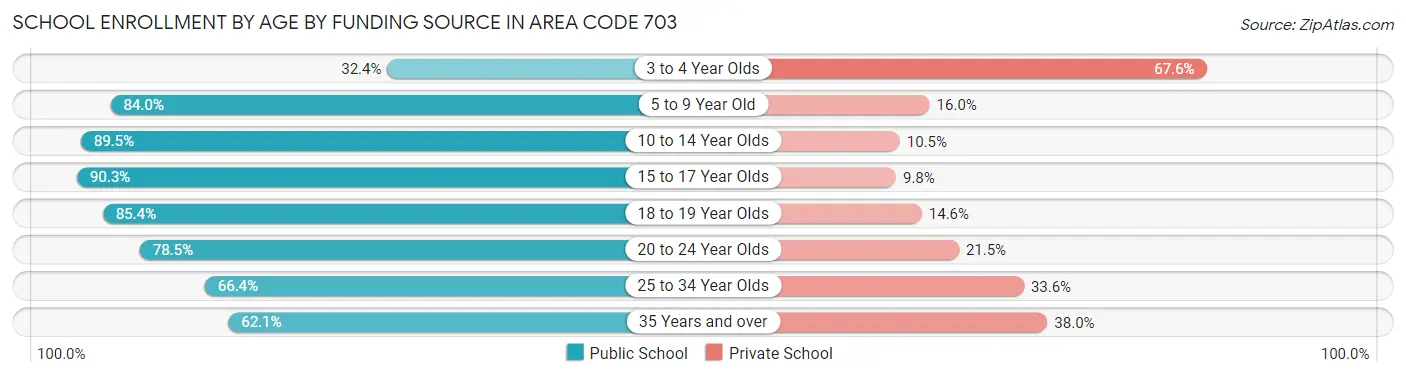
| Age Bracket | Public School | Private School |
| 3 to 4 Year Olds | 9,133 (32.4%) | 19,024 (67.6%) |
| 5 to 9 Year Old | 115,427 (84.0%) | 22,025 (16.0%) |
| 10 to 14 Year Olds | 135,116 (89.5%) | 15,793 (10.5%) |
| 15 to 17 Year Olds | 78,729 (90.2%) | 8,510 (9.8%) |
| 18 to 19 Year Olds | 33,962 (85.4%) | 5,789 (14.6%) |
| 20 to 24 Year Olds | 42,821 (78.5%) | 11,710 (21.5%) |
| 25 to 34 Year Olds | 27,561 (66.4%) | 13,932 (33.6%) |
| 35 Years and over | 24,059 (62.1%) | 14,714 (38.0%) |
| Total | 466,784 (80.7%) | 111,521 (19.3%) |
Educational Attainment by Field of Study in Area Code 703
Business (186,073 | 18.2%), social sciences (146,541 | 14.3%), engineering (100,920 | 9.9%), computers & mathematics (87,208 | 8.5%), and science & technology (61,518 | 6.0%) are the most common fields of study among 1,024,204 individuals in Area Code 703 who have obtained a bachelor's degree or higher.
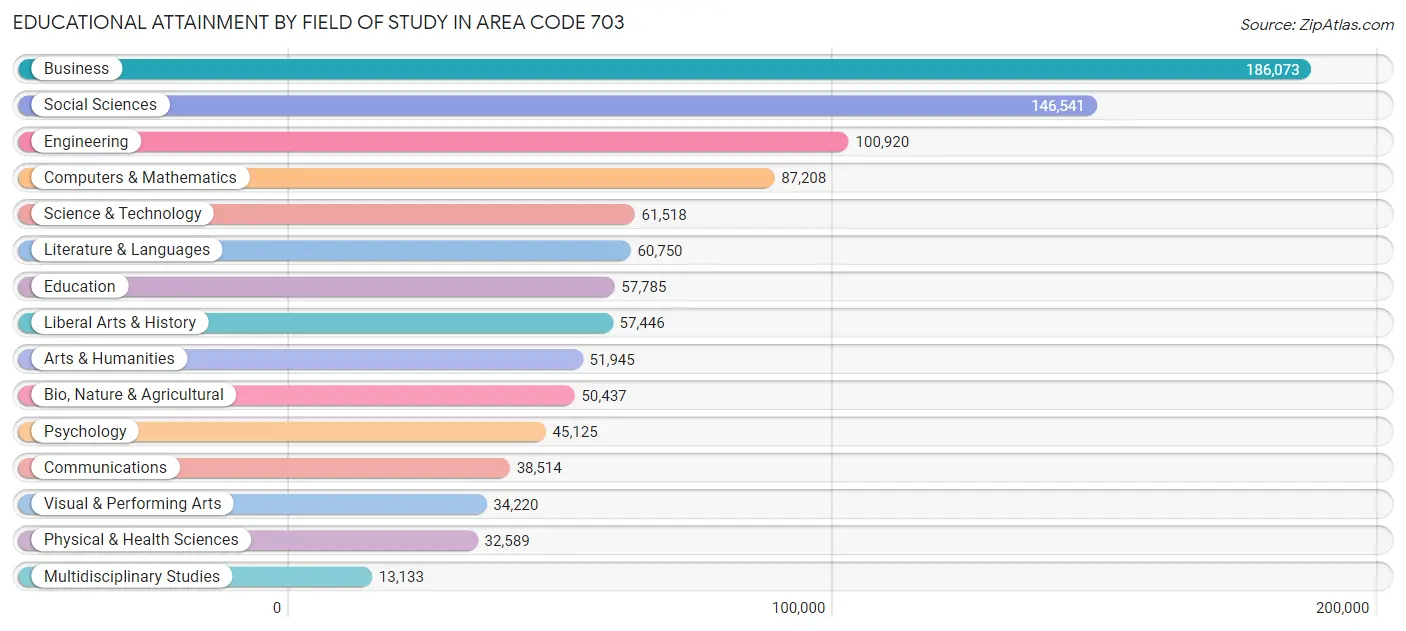
| Field of Study | # Graduates | % Graduates |
| Computers & Mathematics | 87,208 | 8.5% |
| Bio, Nature & Agricultural | 50,437 | 4.9% |
| Physical & Health Sciences | 32,589 | 3.2% |
| Psychology | 45,125 | 4.4% |
| Social Sciences | 146,541 | 14.3% |
| Engineering | 100,920 | 9.9% |
| Multidisciplinary Studies | 13,133 | 1.3% |
| Science & Technology | 61,518 | 6.0% |
| Business | 186,073 | 18.2% |
| Education | 57,785 | 5.6% |
| Literature & Languages | 60,750 | 5.9% |
| Liberal Arts & History | 57,446 | 5.6% |
| Visual & Performing Arts | 34,220 | 3.3% |
| Communications | 38,514 | 3.8% |
| Arts & Humanities | 51,945 | 5.1% |
| Total | 1,024,204 | 100.0% |
Transportation & Commute in Area Code 703
Vehicle Availability by Sex in Area Code 703
The most prevalent vehicle ownership categories in Area Code 703 are males with 2 vehicles (289,713, accounting for 43.5%) and females with 2 vehicles (234,615, making up 51.4%).
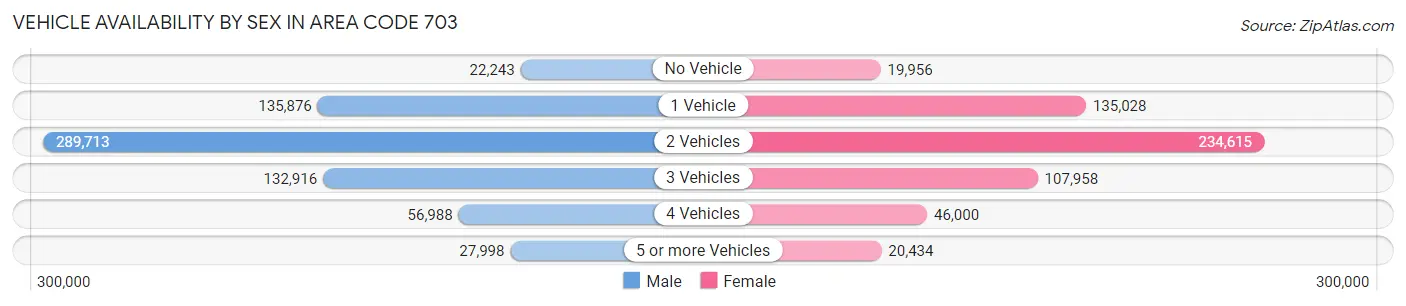
| Vehicles Available | Male | Female |
| No Vehicle | 22,243 (3.3%) | 19,956 (3.5%) |
| 1 Vehicle | 135,876 (20.4%) | 135,028 (23.9%) |
| 2 Vehicles | 289,713 (43.5%) | 234,615 (41.6%) |
| 3 Vehicles | 132,916 (20.0%) | 107,958 (19.1%) |
| 4 Vehicles | 56,988 (8.6%) | 46,000 (8.2%) |
| 5 or more Vehicles | 27,998 (4.2%) | 20,434 (3.6%) |
| Total | 665,734 (100.0%) | 563,991 (100.0%) |
Commute Time in Area Code 703
The most frequently occuring commute durations in Area Code 703 are 30 to 34 minutes (157,114 commuters, 16.2%), 45 to 59 minutes (127,408 commuters, 13.1%), and 20 to 24 minutes (122,409 commuters, 12.6%).
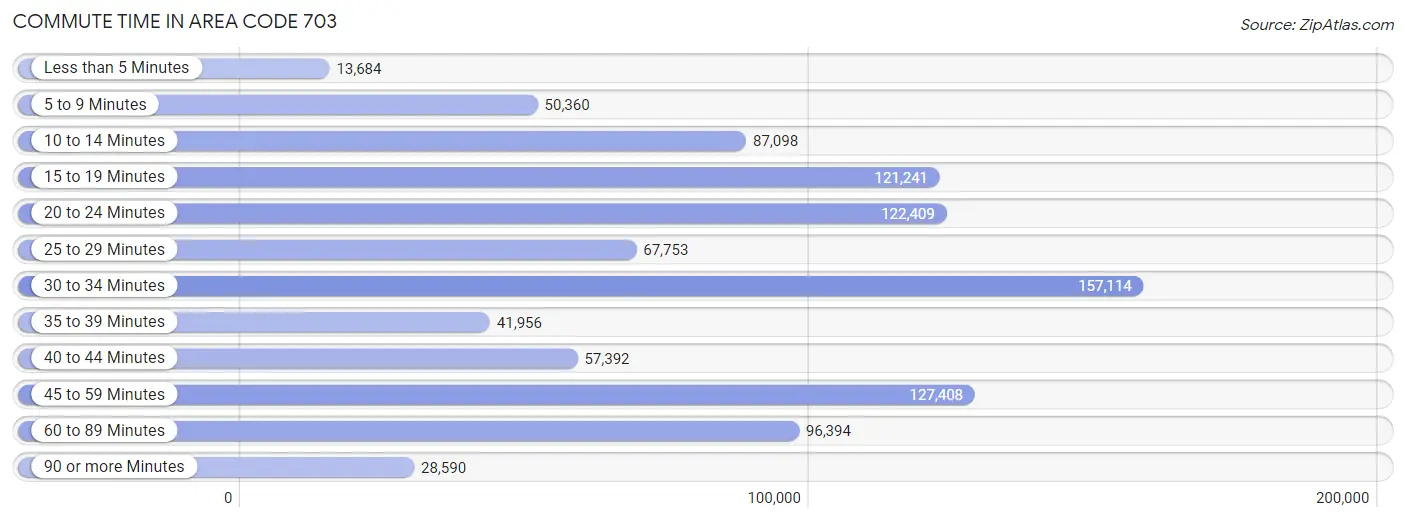
| Commute Time | # Commuters | % Commuters |
| Less than 5 Minutes | 13,684 | 1.4% |
| 5 to 9 Minutes | 50,360 | 5.2% |
| 10 to 14 Minutes | 87,098 | 9.0% |
| 15 to 19 Minutes | 121,241 | 12.5% |
| 20 to 24 Minutes | 122,409 | 12.6% |
| 25 to 29 Minutes | 67,753 | 7.0% |
| 30 to 34 Minutes | 157,114 | 16.2% |
| 35 to 39 Minutes | 41,956 | 4.3% |
| 40 to 44 Minutes | 57,392 | 5.9% |
| 45 to 59 Minutes | 127,408 | 13.1% |
| 60 to 89 Minutes | 96,394 | 9.9% |
| 90 or more Minutes | 28,590 | 2.9% |
Commute Time by Sex in Area Code 703
The most common commute times in Area Code 703 are 30 to 34 minutes (88,660 commuters, 16.7%) for males and 30 to 34 minutes (68,454 commuters, 15.6%) for females.
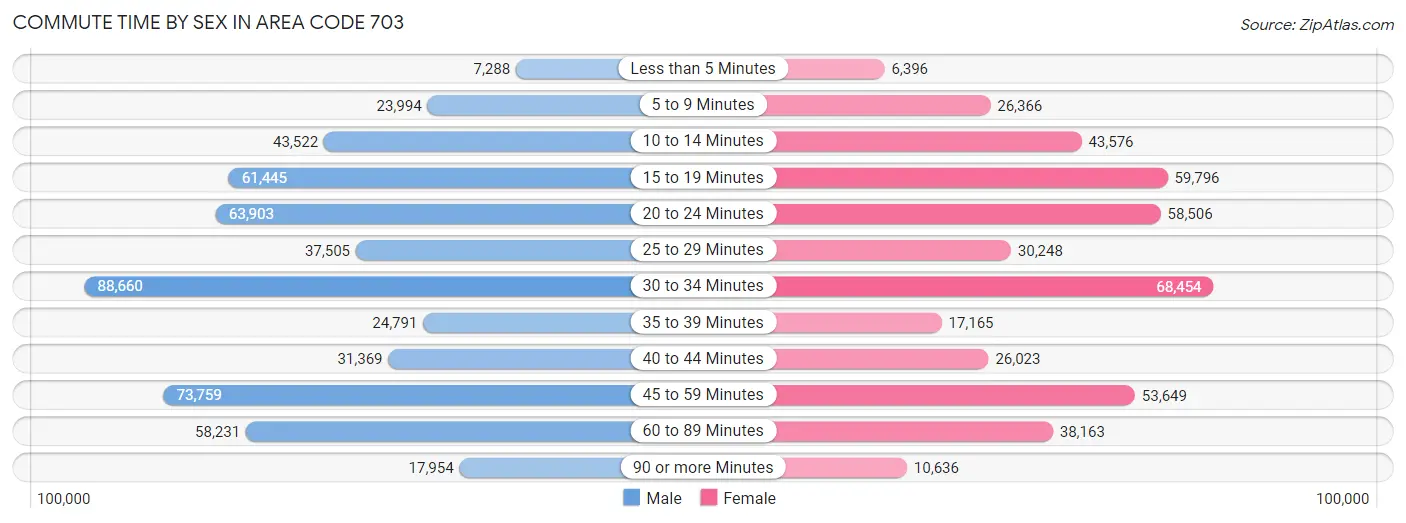
| Commute Time | Male | Female |
| Less than 5 Minutes | 7,288 (1.4%) | 6,396 (1.5%) |
| 5 to 9 Minutes | 23,994 (4.5%) | 26,366 (6.0%) |
| 10 to 14 Minutes | 43,522 (8.2%) | 43,576 (9.9%) |
| 15 to 19 Minutes | 61,445 (11.5%) | 59,796 (13.6%) |
| 20 to 24 Minutes | 63,903 (12.0%) | 58,506 (13.3%) |
| 25 to 29 Minutes | 37,505 (7.0%) | 30,248 (6.9%) |
| 30 to 34 Minutes | 88,660 (16.7%) | 68,454 (15.6%) |
| 35 to 39 Minutes | 24,791 (4.7%) | 17,165 (3.9%) |
| 40 to 44 Minutes | 31,369 (5.9%) | 26,023 (5.9%) |
| 45 to 59 Minutes | 73,759 (13.9%) | 53,649 (12.2%) |
| 60 to 89 Minutes | 58,231 (10.9%) | 38,163 (8.7%) |
| 90 or more Minutes | 17,954 (3.4%) | 10,636 (2.4%) |
Time of Departure to Work by Sex in Area Code 703
The most frequent times of departure to work in Area Code 703 are 7:00 AM to 7:29 AM (73,284, 13.8%) for males and 8:00 AM to 8:29 AM (67,720, 15.4%) for females.
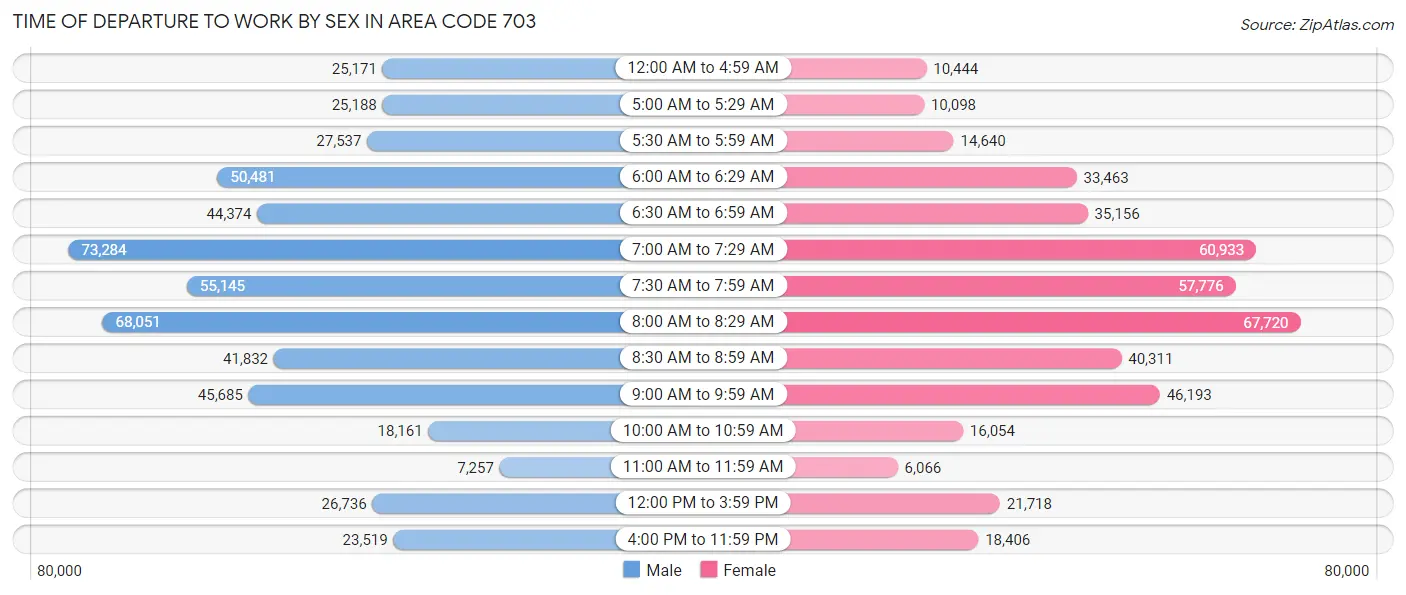
| Time of Departure | Male | Female |
| 12:00 AM to 4:59 AM | 25,171 (4.7%) | 10,444 (2.4%) |
| 5:00 AM to 5:29 AM | 25,188 (4.7%) | 10,098 (2.3%) |
| 5:30 AM to 5:59 AM | 27,537 (5.2%) | 14,640 (3.3%) |
| 6:00 AM to 6:29 AM | 50,481 (9.5%) | 33,463 (7.6%) |
| 6:30 AM to 6:59 AM | 44,374 (8.3%) | 35,156 (8.0%) |
| 7:00 AM to 7:29 AM | 73,284 (13.8%) | 60,933 (13.9%) |
| 7:30 AM to 7:59 AM | 55,145 (10.4%) | 57,776 (13.2%) |
| 8:00 AM to 8:29 AM | 68,051 (12.8%) | 67,720 (15.4%) |
| 8:30 AM to 8:59 AM | 41,832 (7.9%) | 40,311 (9.2%) |
| 9:00 AM to 9:59 AM | 45,685 (8.6%) | 46,193 (10.5%) |
| 10:00 AM to 10:59 AM | 18,161 (3.4%) | 16,054 (3.7%) |
| 11:00 AM to 11:59 AM | 7,257 (1.4%) | 6,066 (1.4%) |
| 12:00 PM to 3:59 PM | 26,736 (5.0%) | 21,718 (5.0%) |
| 4:00 PM to 11:59 PM | 23,519 (4.4%) | 18,406 (4.2%) |
| Total | 532,421 (100.0%) | 438,978 (100.0%) |
Housing Occupancy in Area Code 703
Occupancy by Ownership in Area Code 703
Of the total 823,735 dwellings in Area Code 703, owner-occupied units account for 531,239 (64.5%), while renter-occupied units make up 292,496 (35.5%).
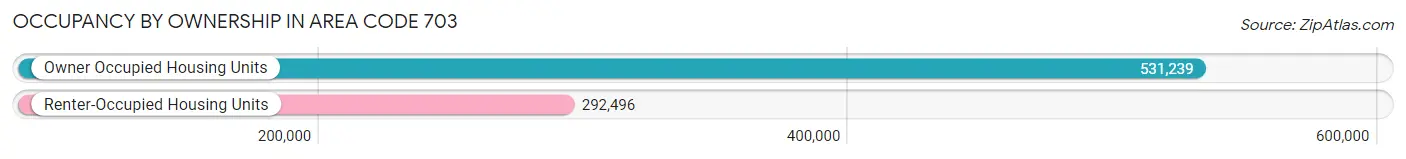
| Occupancy | # Housing Units | % Housing Units |
| Owner Occupied Housing Units | 531,239 | 64.5% |
| Renter-Occupied Housing Units | 292,496 | 35.5% |
| Total Occupied Housing Units | 823,735 | 100.0% |
Occupancy by Household Size in Area Code 703
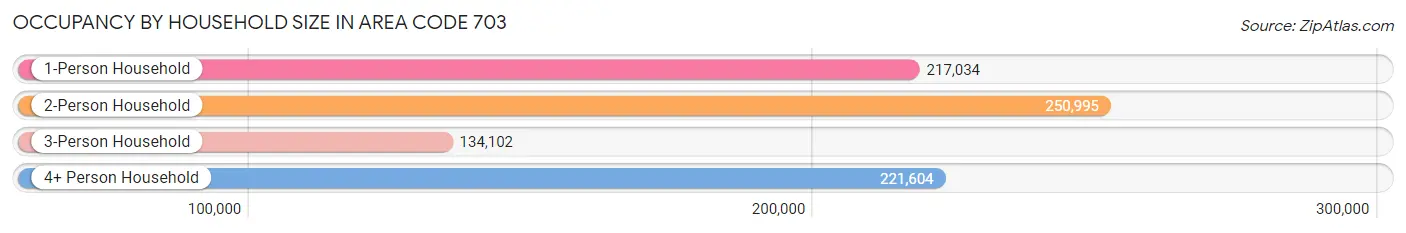
| Household Size | # Housing Units | % Housing Units |
| 1-Person Household | 217,034 | 26.4% |
| 2-Person Household | 250,995 | 30.5% |
| 3-Person Household | 134,102 | 16.3% |
| 4+ Person Household | 221,604 | 26.9% |
| Total Housing Units | 823,735 | 100.0% |
Occupancy by Ownership by Household Size in Area Code 703
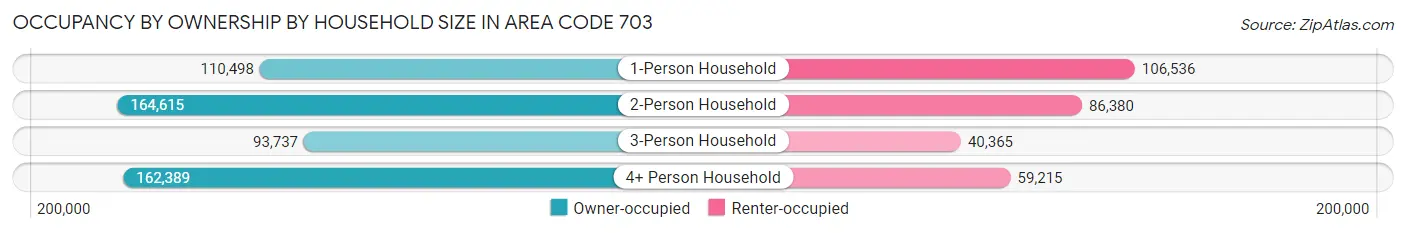
| Household Size | Owner-occupied | Renter-occupied |
| 1-Person Household | 110,498 (50.9%) | 106,536 (49.1%) |
| 2-Person Household | 164,615 (65.6%) | 86,380 (34.4%) |
| 3-Person Household | 93,737 (69.9%) | 40,365 (30.1%) |
| 4+ Person Household | 162,389 (73.3%) | 59,215 (26.7%) |
| Total Housing Units | 531,239 (64.5%) | 292,496 (35.5%) |
Occupancy by Educational Attainment in Area Code 703
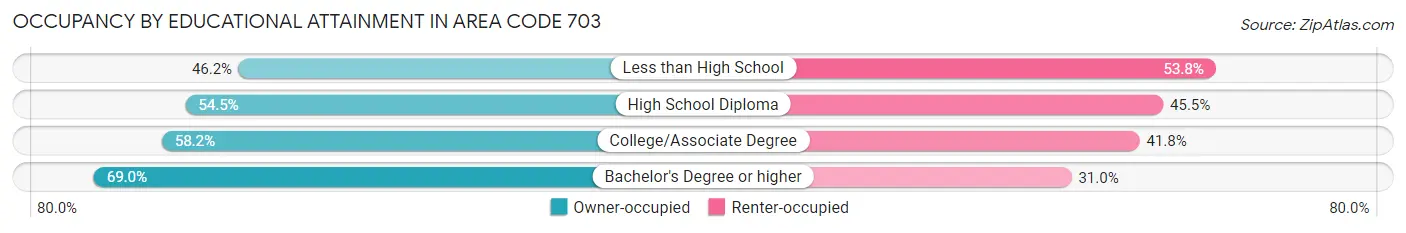
| Household Size | Owner-occupied | Renter-occupied |
| Less than High School | 19,333 (46.2%) | 22,547 (53.8%) |
| High School Diploma | 45,026 (54.5%) | 37,601 (45.5%) |
| College/Associate Degree | 84,927 (58.2%) | 60,913 (41.8%) |
| Bachelor's Degree or higher | 381,953 (69.0%) | 171,435 (31.0%) |
Occupancy by Age of Householder in Area Code 703
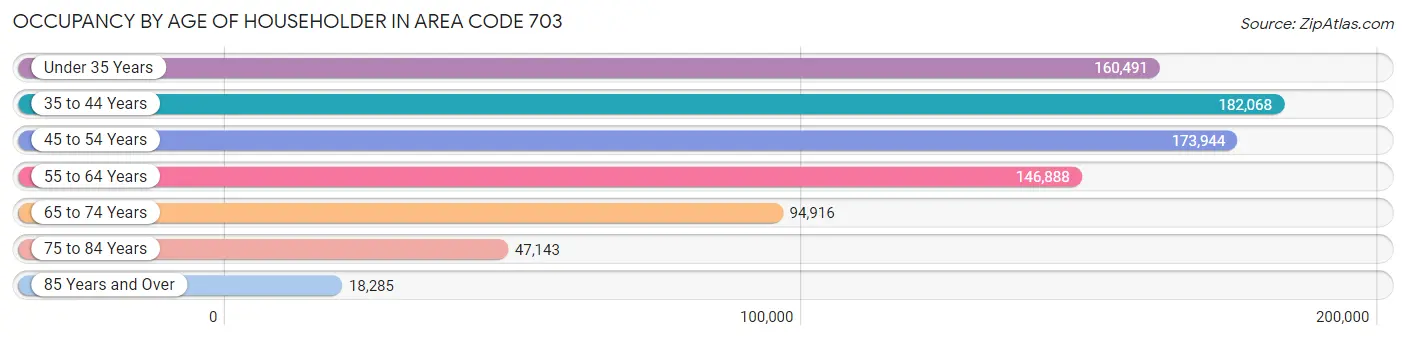
| Age Bracket | # Households | % Households |
| Under 35 Years | 160,491 | 19.5% |
| 35 to 44 Years | 182,068 | 22.1% |
| 45 to 54 Years | 173,944 | 21.1% |
| 55 to 64 Years | 146,888 | 17.8% |
| 65 to 74 Years | 94,916 | 11.5% |
| 75 to 84 Years | 47,143 | 5.7% |
| 85 Years and Over | 18,285 | 2.2% |
| Total | 823,735 | 100.0% |
Housing Finances in Area Code 703
Median Income by Occupancy in Area Code 703
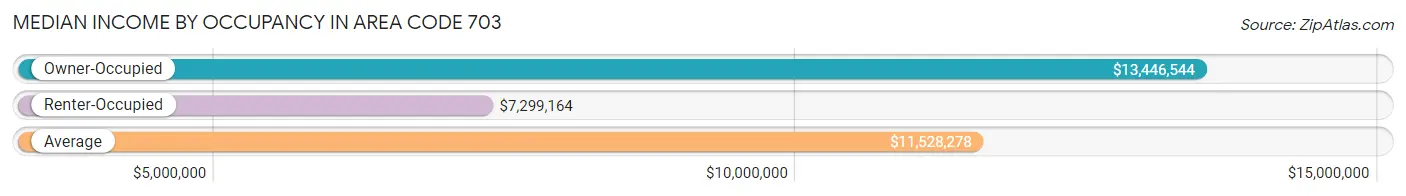
| Occupancy Type | # Households | Median Income |
| Owner-Occupied | 531,239 (64.5%) | $13,446,544 |
| Renter-Occupied | 292,496 (35.5%) | $7,299,164 |
| Average | 823,735 (100.0%) | $11,528,278 |
Occupancy by Householder Income Bracket in Area Code 703
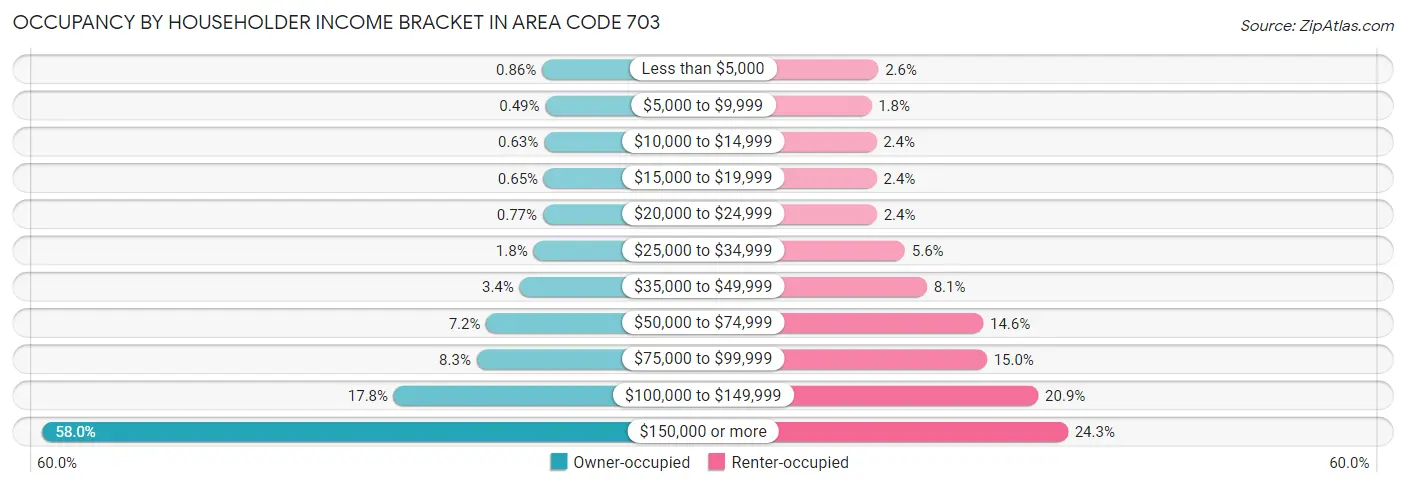
| Income Bracket | Owner-occupied | Renter-occupied |
| Less than $5,000 | 4,544 (0.9%) | 7,570 (2.6%) |
| $5,000 to $9,999 | 2,607 (0.5%) | 5,225 (1.8%) |
| $10,000 to $14,999 | 3,324 (0.6%) | 6,905 (2.4%) |
| $15,000 to $19,999 | 3,468 (0.6%) | 7,052 (2.4%) |
| $20,000 to $24,999 | 4,117 (0.8%) | 7,068 (2.4%) |
| $25,000 to $34,999 | 9,786 (1.8%) | 16,480 (5.6%) |
| $35,000 to $49,999 | 18,204 (3.4%) | 23,775 (8.1%) |
| $50,000 to $74,999 | 38,424 (7.2%) | 42,626 (14.6%) |
| $75,000 to $99,999 | 44,259 (8.3%) | 43,831 (15.0%) |
| $100,000 to $149,999 | 94,584 (17.8%) | 61,046 (20.9%) |
| $150,000 or more | 307,922 (58.0%) | 70,918 (24.2%) |
| Total | 531,239 (100.0%) | 292,496 (100.0%) |
Monthly Housing Cost Tiers in Area Code 703
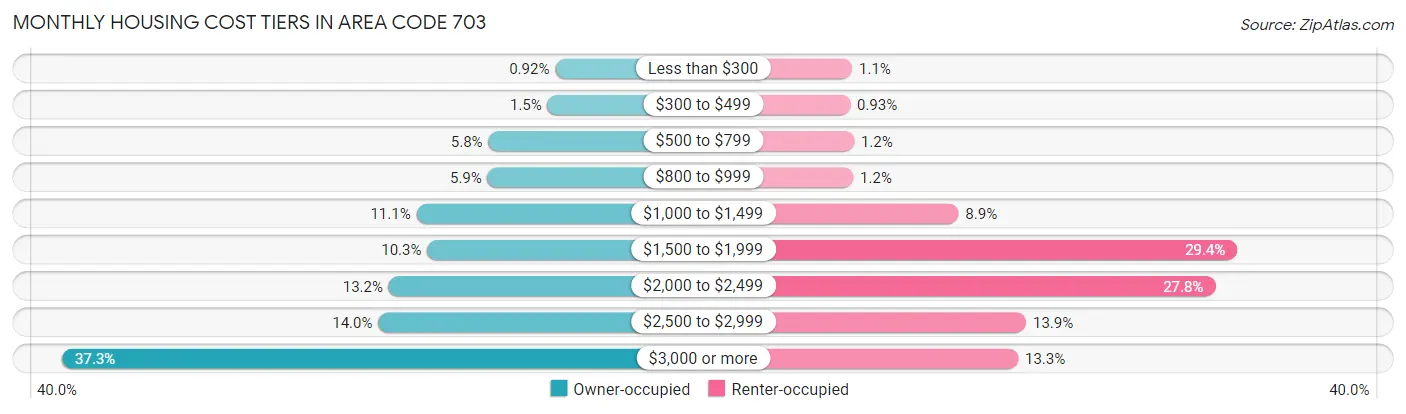
| Monthly Cost | Owner-occupied | Renter-occupied |
| Less than $300 | 4,894 (0.9%) | 3,165 (1.1%) |
| $300 to $499 | 7,855 (1.5%) | 2,714 (0.9%) |
| $500 to $799 | 31,025 (5.8%) | 3,577 (1.2%) |
| $800 to $999 | 31,369 (5.9%) | 3,388 (1.2%) |
| $1,000 to $1,499 | 59,199 (11.1%) | 26,054 (8.9%) |
| $1,500 to $1,999 | 54,906 (10.3%) | 86,106 (29.4%) |
| $2,000 to $2,499 | 70,012 (13.2%) | 81,374 (27.8%) |
| $2,500 to $2,999 | 74,103 (14.0%) | 40,622 (13.9%) |
| $3,000 or more | 197,876 (37.2%) | 38,899 (13.3%) |
| Total | 531,239 (100.0%) | 292,496 (100.0%) |
Physical Housing Characteristics in Area Code 703
Housing Structures in Area Code 703
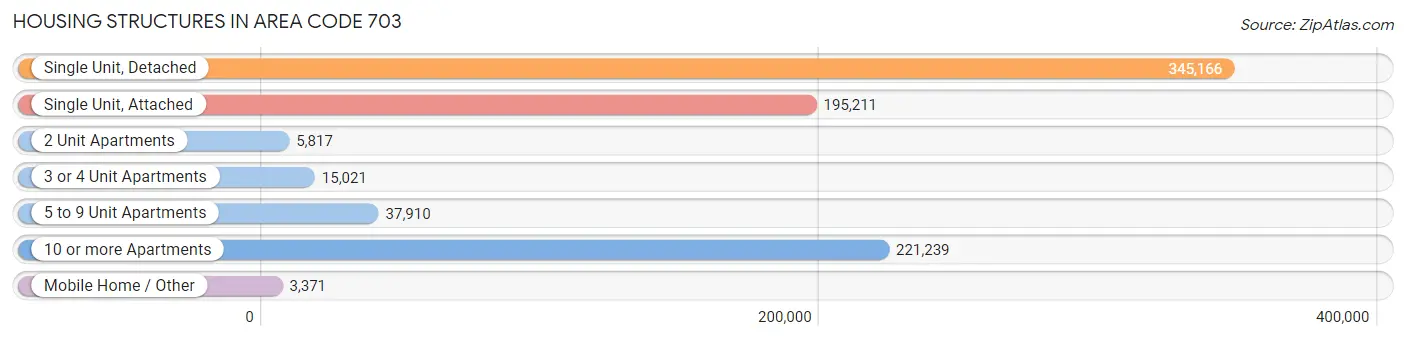
| Structure Type | # Housing Units | % Housing Units |
| Single Unit, Detached | 345,166 | 41.9% |
| Single Unit, Attached | 195,211 | 23.7% |
| 2 Unit Apartments | 5,817 | 0.7% |
| 3 or 4 Unit Apartments | 15,021 | 1.8% |
| 5 to 9 Unit Apartments | 37,910 | 4.6% |
| 10 or more Apartments | 221,239 | 26.9% |
| Mobile Home / Other | 3,371 | 0.4% |
| Total | 823,735 | 100.0% |
Housing Structures by Occupancy in Area Code 703
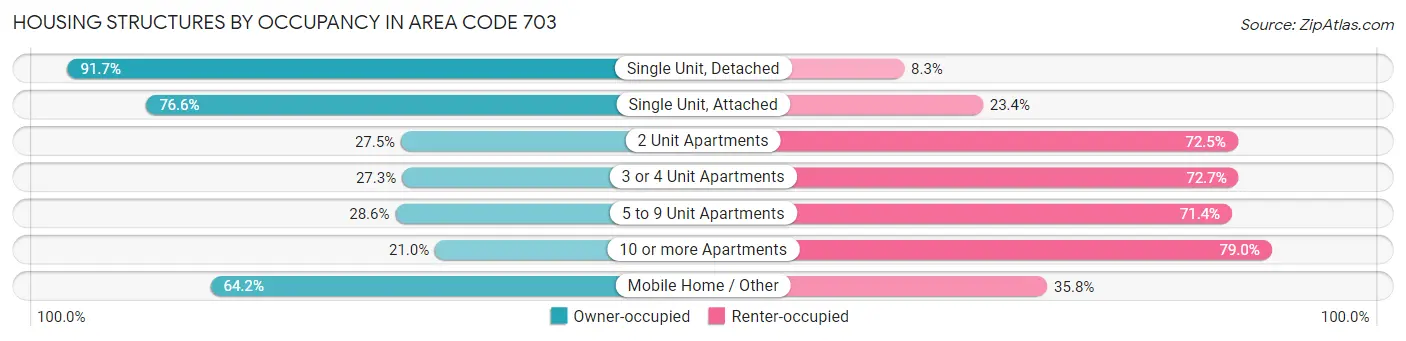
| Structure Type | Owner-occupied | Renter-occupied |
| Single Unit, Detached | 316,622 (91.7%) | 28,544 (8.3%) |
| Single Unit, Attached | 149,501 (76.6%) | 45,710 (23.4%) |
| 2 Unit Apartments | 1,602 (27.5%) | 4,215 (72.5%) |
| 3 or 4 Unit Apartments | 4,106 (27.3%) | 10,915 (72.7%) |
| 5 to 9 Unit Apartments | 10,848 (28.6%) | 27,062 (71.4%) |
| 10 or more Apartments | 46,396 (21.0%) | 174,843 (79.0%) |
| Mobile Home / Other | 2,164 (64.2%) | 1,207 (35.8%) |
| Total | 531,239 (64.5%) | 292,496 (35.5%) |
Housing Structures by Number of Rooms in Area Code 703
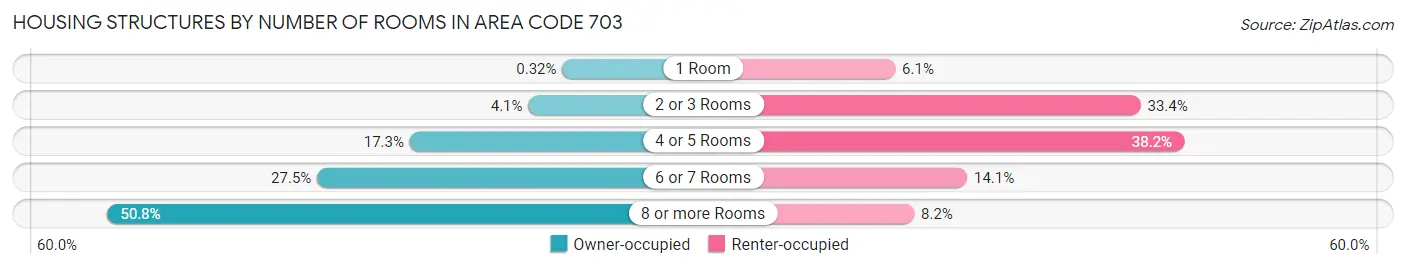
| Number of Rooms | Owner-occupied | Renter-occupied |
| 1 Room | 1,674 (0.3%) | 17,916 (6.1%) |
| 2 or 3 Rooms | 21,744 (4.1%) | 97,572 (33.4%) |
| 4 or 5 Rooms | 91,659 (17.2%) | 111,659 (38.2%) |
| 6 or 7 Rooms | 146,265 (27.5%) | 41,278 (14.1%) |
| 8 or more Rooms | 269,897 (50.8%) | 24,071 (8.2%) |
| Total | 531,239 (100.0%) | 292,496 (100.0%) |
Housing Structure by Heating Type in Area Code 703
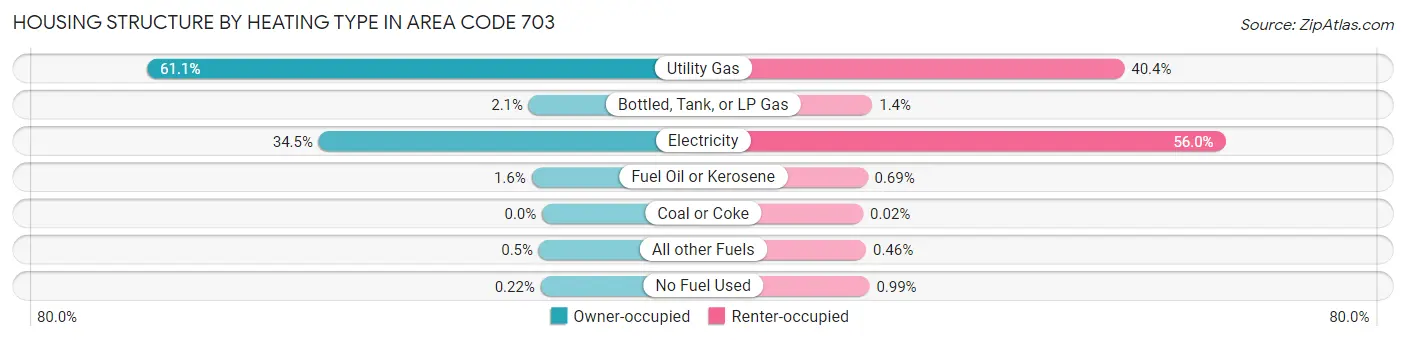
| Heating Type | Owner-occupied | Renter-occupied |
| Utility Gas | 324,423 (61.1%) | 118,127 (40.4%) |
| Bottled, Tank, or LP Gas | 10,895 (2.1%) | 4,184 (1.4%) |
| Electricity | 183,398 (34.5%) | 163,860 (56.0%) |
| Fuel Oil or Kerosene | 8,663 (1.6%) | 2,032 (0.7%) |
| Coal or Coke | 12 (0.0%) | 58 (0.0%) |
| All other Fuels | 2,653 (0.5%) | 1,337 (0.5%) |
| No Fuel Used | 1,195 (0.2%) | 2,898 (1.0%) |
| Total | 531,239 (100.0%) | 292,496 (100.0%) |
Household Vehicle Usage in Area Code 703
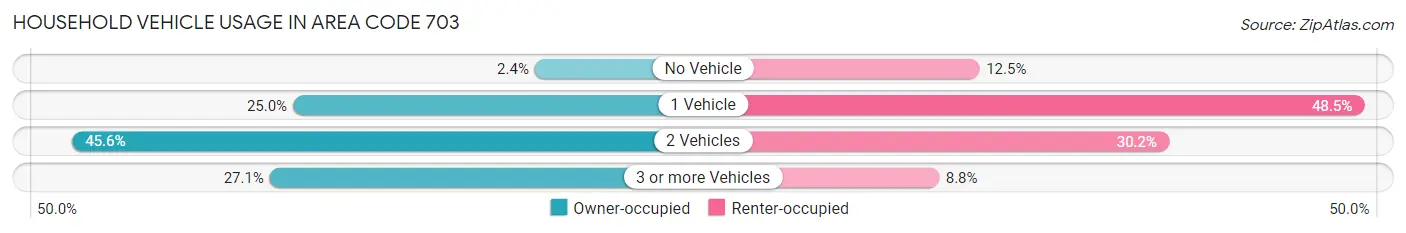
| Vehicles per Household | Owner-occupied | Renter-occupied |
| No Vehicle | 12,623 (2.4%) | 36,668 (12.5%) |
| 1 Vehicle | 132,530 (24.9%) | 141,770 (48.5%) |
| 2 Vehicles | 242,001 (45.6%) | 88,430 (30.2%) |
| 3 or more Vehicles | 144,085 (27.1%) | 25,628 (8.8%) |
| Total | 531,239 (100.0%) | 292,496 (100.0%) |
Real Estate & Mortgages in Area Code 703
Real Estate and Mortgage Overview in Area Code 703
| Characteristic | Without Mortgage | With Mortgage |
| Housing Units | 124,601 | 406,638 |
| Median Property Value | $49,441,200 | $52,061,500 |
| Median Household Income | $10,111,287 | $253,770 |
| Monthly Housing Costs | $74,596 | $196,346 |
| Real Estate Taxes | $489,147 | $9,094 |
Property Value by Mortgage Status in Area Code 703
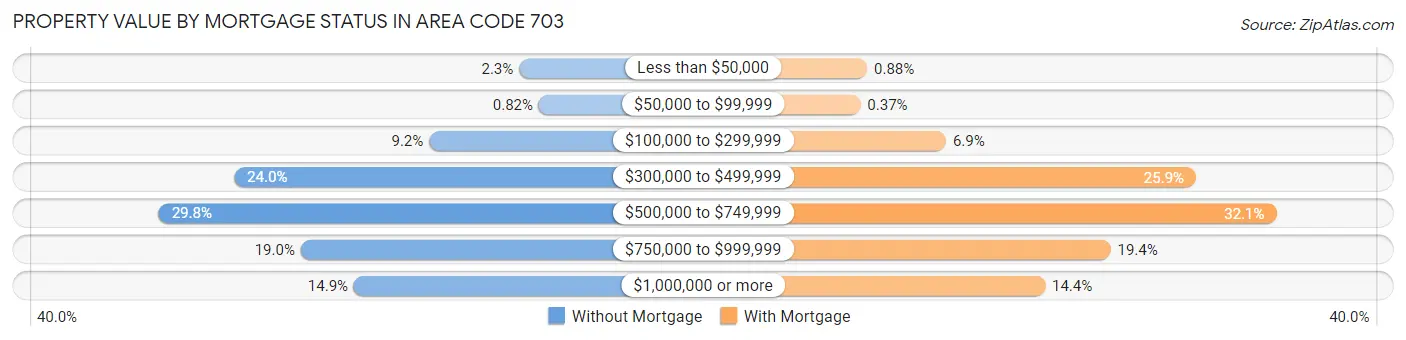
| Property Value | Without Mortgage | With Mortgage |
| Less than $50,000 | 2,895 (2.3%) | 3,574 (0.9%) |
| $50,000 to $99,999 | 1,016 (0.8%) | 1,514 (0.4%) |
| $100,000 to $299,999 | 11,433 (9.2%) | 28,035 (6.9%) |
| $300,000 to $499,999 | 29,947 (24.0%) | 105,452 (25.9%) |
| $500,000 to $749,999 | 37,108 (29.8%) | 130,361 (32.1%) |
| $750,000 to $999,999 | 23,625 (19.0%) | 78,994 (19.4%) |
| $1,000,000 or more | 18,577 (14.9%) | 58,708 (14.4%) |
| Total | 124,601 (100.0%) | 406,638 (100.0%) |
Household Income by Mortgage Status in Area Code 703
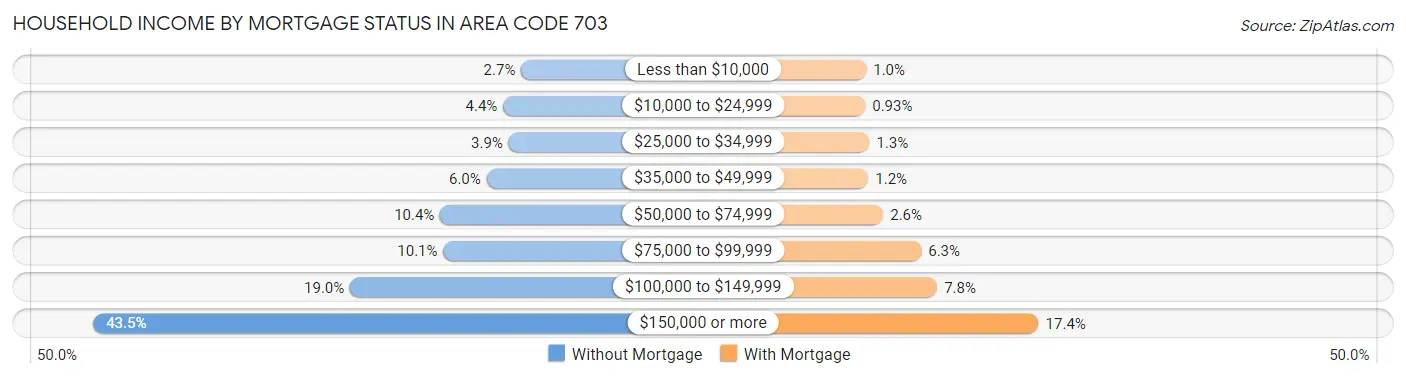
| Household Income | Without Mortgage | With Mortgage |
| Less than $10,000 | 3,368 (2.7%) | 4,132 (1.0%) |
| $10,000 to $24,999 | 5,504 (4.4%) | 3,783 (0.9%) |
| $25,000 to $34,999 | 4,842 (3.9%) | 5,405 (1.3%) |
| $35,000 to $49,999 | 7,470 (6.0%) | 4,944 (1.2%) |
| $50,000 to $74,999 | 12,981 (10.4%) | 10,734 (2.6%) |
| $75,000 to $99,999 | 12,608 (10.1%) | 25,443 (6.3%) |
| $100,000 to $149,999 | 23,676 (19.0%) | 31,651 (7.8%) |
| $150,000 or more | 54,152 (43.5%) | 70,908 (17.4%) |
| Total | 124,601 (100.0%) | 406,638 (100.0%) |
Property Value to Household Income Ratio in Area Code 703
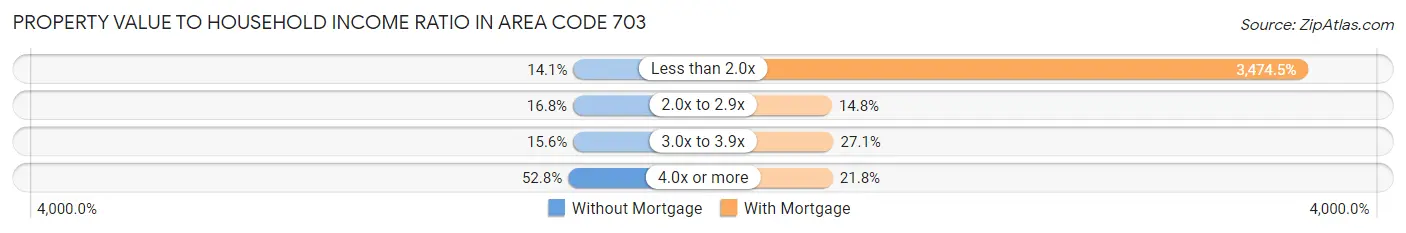
| Value-to-Income Ratio | Without Mortgage | With Mortgage |
| Less than 2.0x | 17,547 (14.1%) | 14,128,787 (3,474.5%) |
| 2.0x to 2.9x | 20,931 (16.8%) | 60,121 (14.8%) |
| 3.0x to 3.9x | 19,404 (15.6%) | 109,981 (27.1%) |
| 4.0x or more | 65,742 (52.8%) | 88,780 (21.8%) |
| Total | 124,601 (100.0%) | 406,638 (100.0%) |
Real Estate Taxes by Mortgage Status in Area Code 703
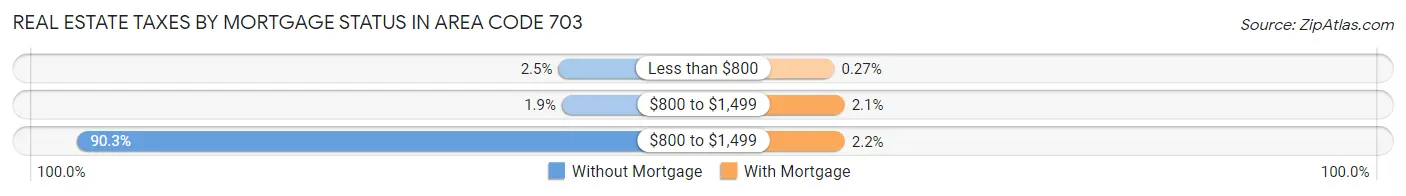
| Property Taxes | Without Mortgage | With Mortgage |
| Less than $800 | 3,144 (2.5%) | 1,096 (0.3%) |
| $800 to $1,499 | 2,342 (1.9%) | 8,646 (2.1%) |
| $800 to $1,499 | 112,546 (90.3%) | 8,729 (2.1%) |
| Total | 124,601 (100.0%) | 406,638 (100.0%) |
Health & Disability in Area Code 703
Health Insurance Coverage by Age in Area Code 703
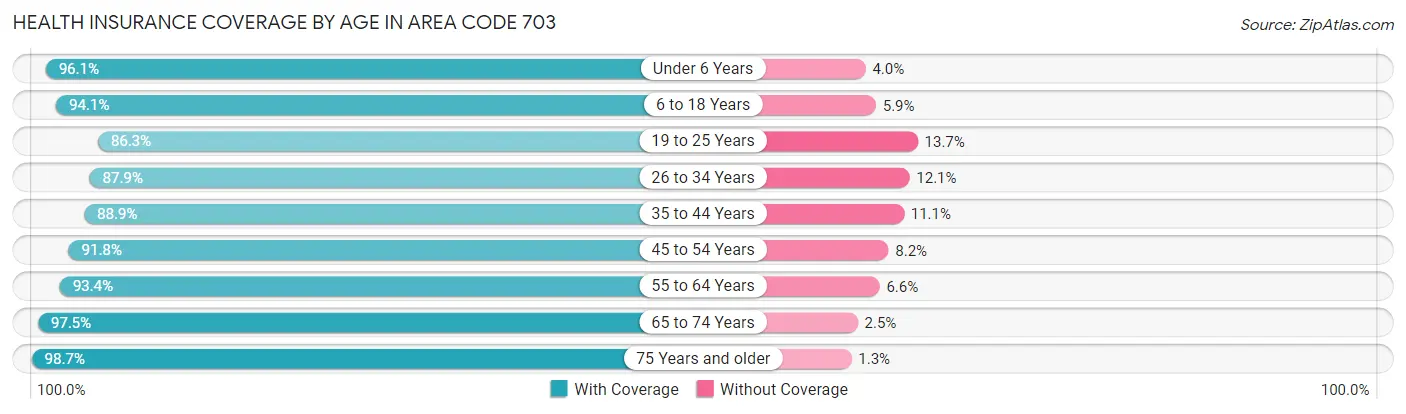
| Age Bracket | With Coverage | Without Coverage |
| Under 6 Years | 161,231 (96.1%) | 6,630 (4.0%) |
| 6 to 18 Years | 365,720 (94.1%) | 22,790 (5.9%) |
| 19 to 25 Years | 157,181 (86.3%) | 24,896 (13.7%) |
| 26 to 34 Years | 250,690 (87.9%) | 34,592 (12.1%) |
| 35 to 44 Years | 303,695 (88.9%) | 37,923 (11.1%) |
| 45 to 54 Years | 285,808 (91.8%) | 25,564 (8.2%) |
| 55 to 64 Years | 243,899 (93.4%) | 17,133 (6.6%) |
| 65 to 74 Years | 161,145 (97.5%) | 4,090 (2.5%) |
| 75 Years and older | 104,829 (98.7%) | 1,392 (1.3%) |
| Total | 2,034,198 (92.1%) | 175,010 (7.9%) |
Health Insurance Coverage by Citizenship Status in Area Code 703
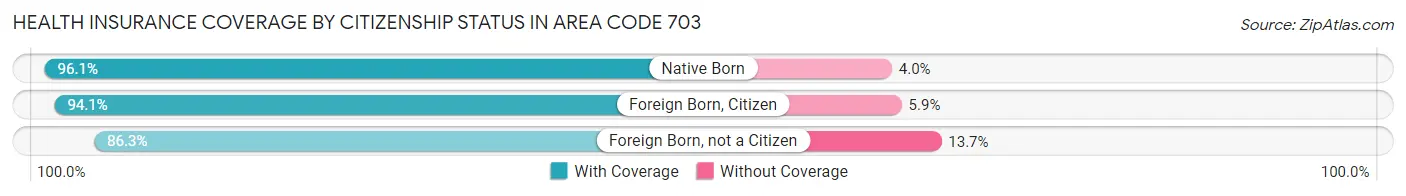
| Citizenship Status | With Coverage | Without Coverage |
| Native Born | 161,231 (96.1%) | 6,630 (4.0%) |
| Foreign Born, Citizen | 365,720 (94.1%) | 22,790 (5.9%) |
| Foreign Born, not a Citizen | 157,181 (86.3%) | 24,896 (13.7%) |
Health Insurance Coverage by Household Income in Area Code 703
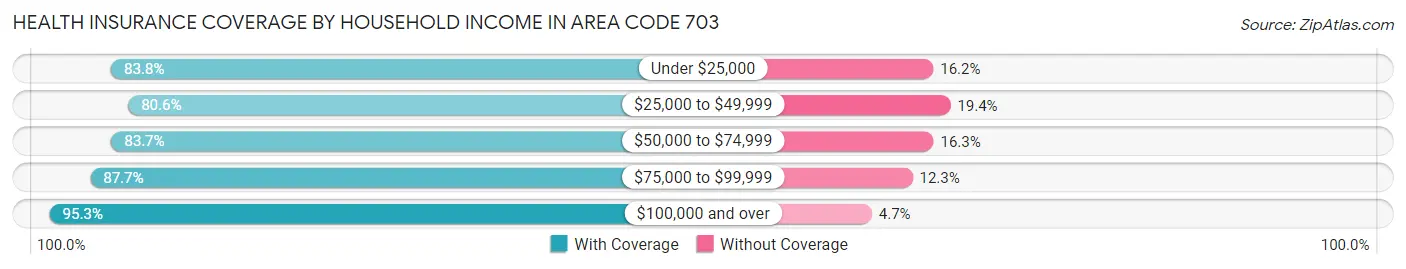
| Household Income | With Coverage | Without Coverage |
| Under $25,000 | 81,244 (83.8%) | 15,705 (16.2%) |
| $25,000 to $49,999 | 123,792 (80.6%) | 29,833 (19.4%) |
| $50,000 to $74,999 | 154,998 (83.7%) | 30,106 (16.3%) |
| $75,000 to $99,999 | 181,370 (87.7%) | 25,461 (12.3%) |
| $100,000 and over | 1,489,609 (95.3%) | 73,219 (4.7%) |
Public vs Private Health Insurance Coverage by Age in Area Code 703
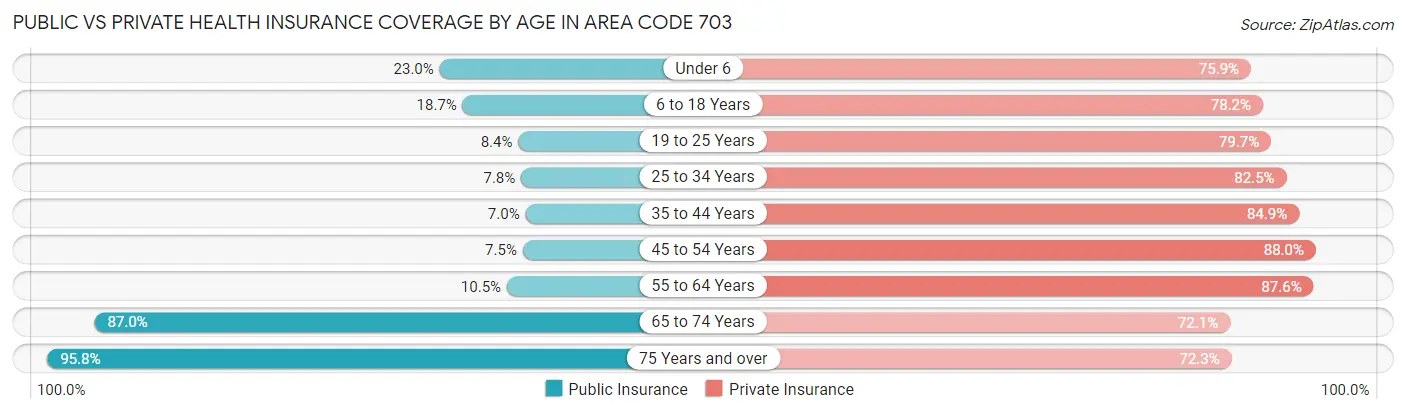
| Age Bracket | Public Insurance | Private Insurance |
| Under 6 | 38,556 (23.0%) | 127,453 (75.9%) |
| 6 to 18 Years | 72,610 (18.7%) | 303,613 (78.1%) |
| 19 to 25 Years | 15,223 (8.4%) | 145,074 (79.7%) |
| 25 to 34 Years | 22,359 (7.8%) | 235,414 (82.5%) |
| 35 to 44 Years | 24,019 (7.0%) | 289,899 (84.9%) |
| 45 to 54 Years | 23,486 (7.5%) | 273,930 (88.0%) |
| 55 to 64 Years | 27,362 (10.5%) | 228,538 (87.5%) |
| 65 to 74 Years | 143,806 (87.0%) | 119,050 (72.1%) |
| 75 Years and over | 101,745 (95.8%) | 76,833 (72.3%) |
| Total | 469,166 (21.2%) | 1,799,804 (81.5%) |
Disability Status by Sex by Age in Area Code 703
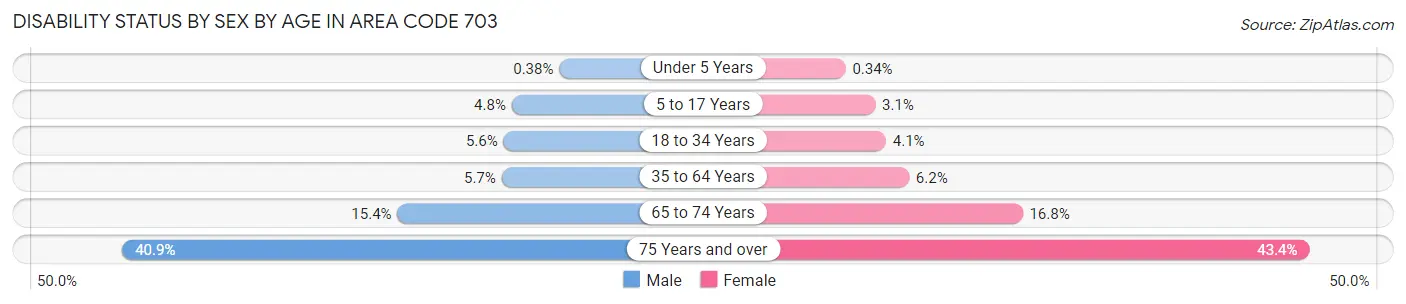
| Age Bracket | Male | Female |
| Under 5 Years | 275 (0.4%) | 234 (0.3%) |
| 5 to 17 Years | 9,601 (4.8%) | 5,823 (3.1%) |
| 18 to 34 Years | 13,677 (5.6%) | 10,166 (4.1%) |
| 35 to 64 Years | 26,166 (5.7%) | 28,497 (6.2%) |
| 65 to 74 Years | 12,101 (15.4%) | 14,534 (16.8%) |
| 75 Years and over | 18,378 (40.9%) | 26,610 (43.4%) |
Disability Class by Sex by Age in Area Code 703
Disability Class: Hearing Difficulty
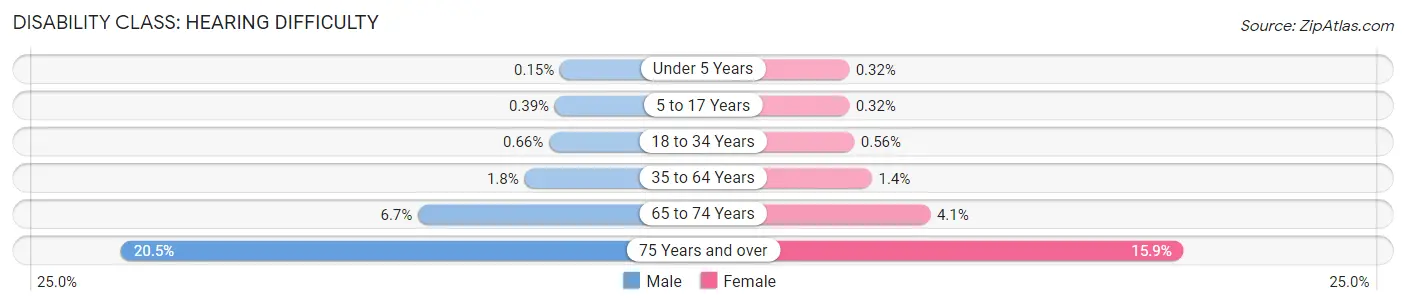
| Age Bracket | Male | Female |
| Under 5 Years | 108 (0.2%) | 218 (0.3%) |
| 5 to 17 Years | 772 (0.4%) | 595 (0.3%) |
| 18 to 34 Years | 1,636 (0.7%) | 1,392 (0.6%) |
| 35 to 64 Years | 8,218 (1.8%) | 6,297 (1.4%) |
| 65 to 74 Years | 5,291 (6.7%) | 3,542 (4.1%) |
| 75 Years and over | 9,217 (20.5%) | 9,725 (15.9%) |
Disability Class: Vision Difficulty
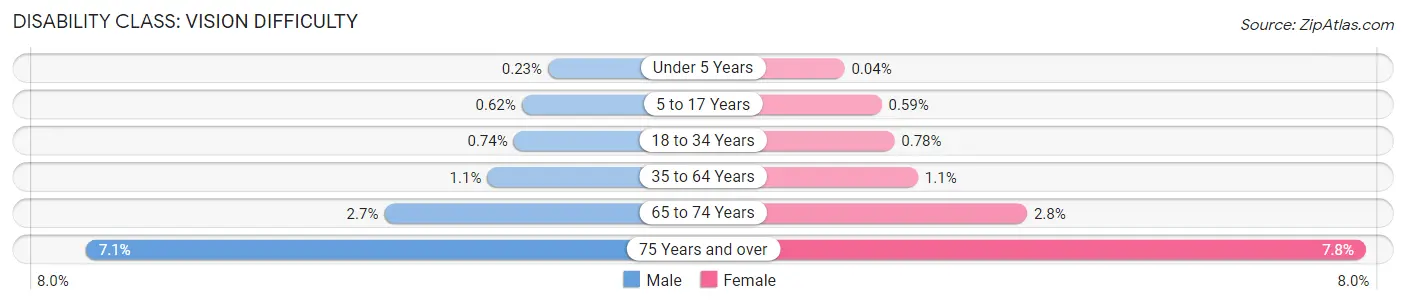
| Age Bracket | Male | Female |
| Under 5 Years | 167 (0.2%) | 30 (0.0%) |
| 5 to 17 Years | 1,245 (0.6%) | 1,101 (0.6%) |
| 18 to 34 Years | 1,827 (0.7%) | 1,951 (0.8%) |
| 35 to 64 Years | 5,175 (1.1%) | 5,185 (1.1%) |
| 65 to 74 Years | 2,090 (2.7%) | 2,382 (2.8%) |
| 75 Years and over | 3,183 (7.1%) | 4,771 (7.8%) |
Disability Class: Cognitive Difficulty
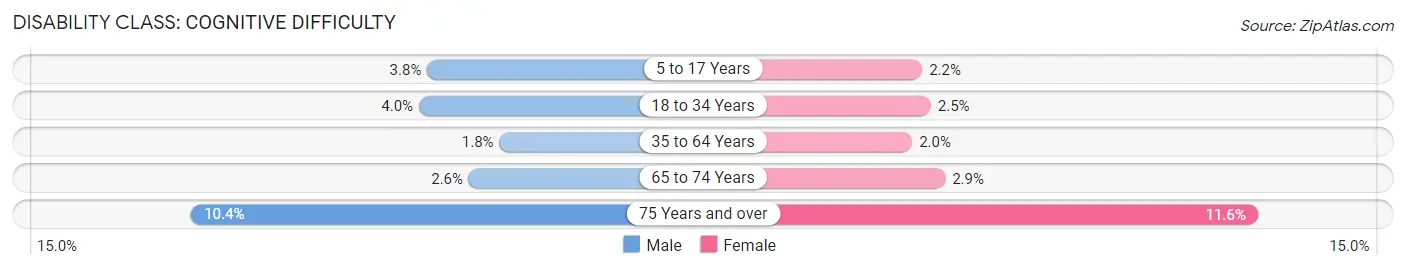
| Age Bracket | Male | Female |
| 5 to 17 Years | 7,595 (3.8%) | 4,218 (2.2%) |
| 18 to 34 Years | 9,904 (4.0%) | 6,170 (2.5%) |
| 35 to 64 Years | 8,112 (1.8%) | 8,975 (2.0%) |
| 65 to 74 Years | 2,063 (2.6%) | 2,496 (2.9%) |
| 75 Years and over | 4,652 (10.4%) | 7,105 (11.6%) |
Disability Class: Ambulatory Difficulty
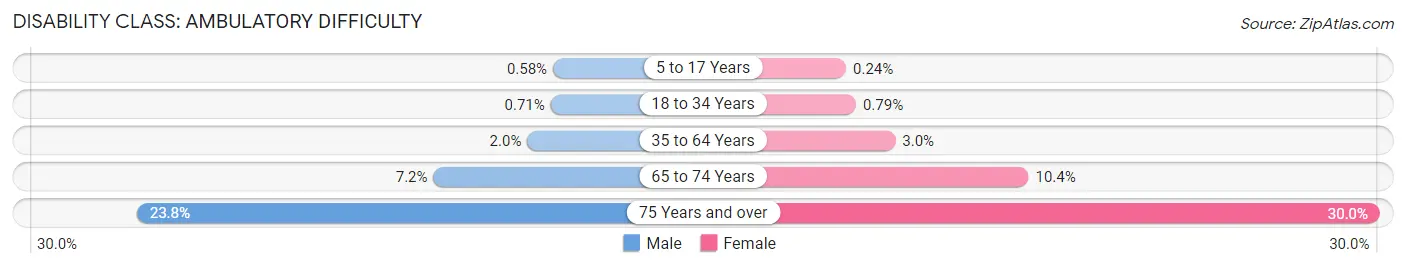
| Age Bracket | Male | Female |
| 5 to 17 Years | 1,169 (0.6%) | 450 (0.2%) |
| 18 to 34 Years | 1,750 (0.7%) | 1,966 (0.8%) |
| 35 to 64 Years | 9,187 (2.0%) | 13,649 (3.0%) |
| 65 to 74 Years | 5,688 (7.2%) | 9,015 (10.4%) |
| 75 Years and over | 10,660 (23.7%) | 18,374 (30.0%) |
Disability Class: Self-Care Difficulty
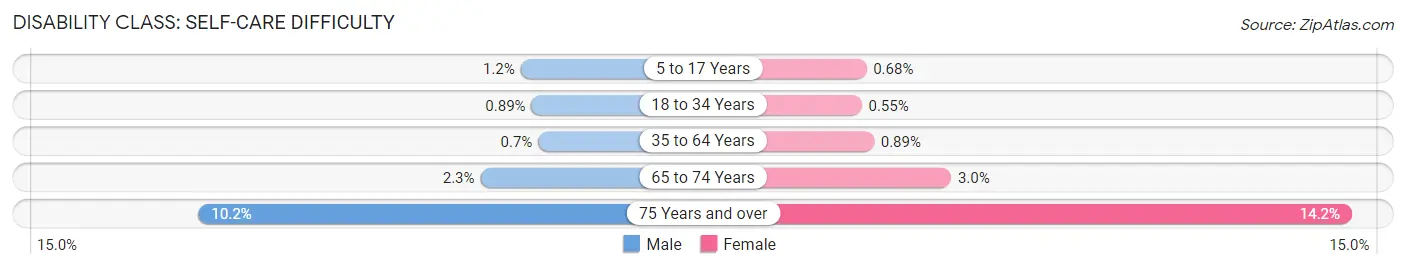
| Age Bracket | Male | Female |
| 5 to 17 Years | 2,393 (1.2%) | 1,276 (0.7%) |
| 18 to 34 Years | 2,184 (0.9%) | 1,369 (0.5%) |
| 35 to 64 Years | 3,215 (0.7%) | 4,085 (0.9%) |
| 65 to 74 Years | 1,811 (2.3%) | 2,631 (3.0%) |
| 75 Years and over | 4,562 (10.2%) | 8,708 (14.2%) |
Technology Access in Area Code 703
Computing Device Access in Area Code 703
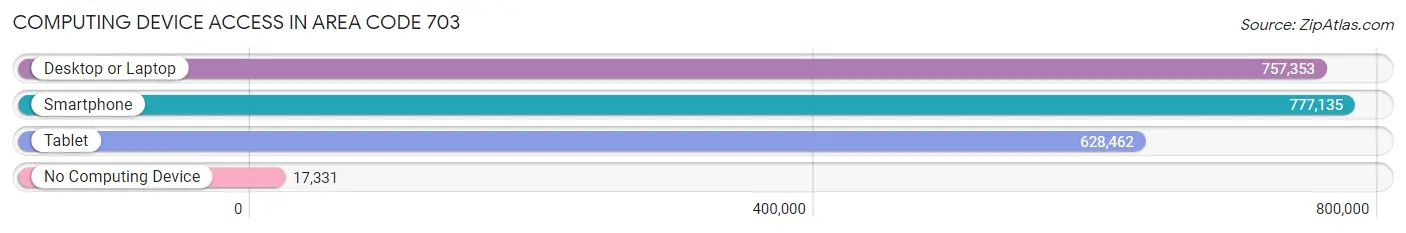
| Device Type | # Households | % Households |
| Desktop or Laptop | 757,353 | 91.9% |
| Smartphone | 777,135 | 94.3% |
| Tablet | 628,462 | 76.3% |
| No Computing Device | 17,331 | 2.1% |
| Total | 823,735 | 100.0% |
Internet Access in Area Code 703
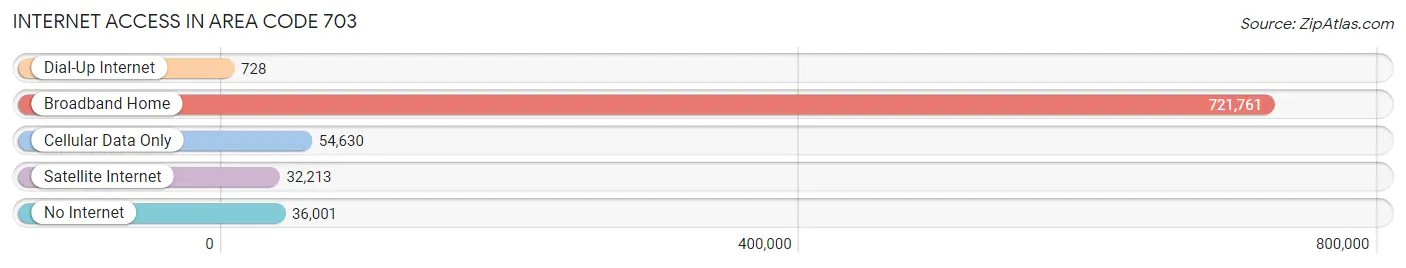
| Internet Type | # Households | % Households |
| Dial-Up Internet | 728 | 0.1% |
| Broadband Home | 721,761 | 87.6% |
| Cellular Data Only | 54,630 | 6.6% |
| Satellite Internet | 32,213 | 3.9% |
| No Internet | 36,001 | 4.4% |
| Total | 823,735 | 100.0% |
Area Code 703 Summary
Geography
Area code 703 is located in the state of Virginia and covers the northern and eastern parts of the state. It includes the cities of Arlington, Alexandria, Fairfax, and Falls Church. It also covers parts of Loudoun, Prince William, and Fauquier counties.
Social
Area code 703 is home to a diverse population of people from all walks of life. The area is known for its vibrant culture, with a variety of restaurants, bars, and entertainment venues. It is also home to many universities and colleges, including George Mason University, Virginia Commonwealth University, and the University of Virginia.
Economics
Area code 703 is a major economic hub in Virginia. It is home to many large corporations, including Northrop Grumman, General Dynamics, and Booz Allen Hamilton. It is also home to many government agencies, such as the Department of Defense, the Department of Homeland Security, and the National Security Agency.
Demographics
Area code 703 is home to a diverse population of people from all backgrounds. According to the U.S. Census Bureau, the population of the area is approximately 1.8 million people. The median household income is $90,000, and the median age is 37. The area is also home to a large number of immigrants, with approximately 20% of the population being foreign-born.
Common Questions
What is Per Capita Income in Area Code 703?
Per Capita income in Area Code 703 is $70,757.
What is the Median Family Income in Area Code 703?
Median Family Income in Area Code 703 is $172,927.
What is the Median Household income in Area Code 703?
Median Household Income in Area Code 703 is $149,718.
What is Income or Wage Gap in Area Code 703?
Income or Wage Gap in Area Code 703 is 30.6%.
Women in Area Code 703 earn 69.4 cents for every dollar earned by a man.
What is Family Income Deficit in Area Code 703?
Family Income Deficit in Area Code 703 is $11,326.
Families that are below poverty line in Area Code 703 earn $11,326 less on average than the poverty threshold level.
What is Inequality or Gini Index in Area Code 703?
Inequality or Gini Index in Area Code 703 is 30.74.
What is the Total Population of Area Code 703?
Total Population of Area Code 703 is 2,238,535.
What is the Total Male Population of Area Code 703?
Total Male Population of Area Code 703 is 1,120,675.
What is the Total Female Population of Area Code 703?
Total Female Population of Area Code 703 is 1,117,860.
What is the Ratio of Males per 100 Females in Area Code 703?
There are 100.25 Males per 100 Females in Area Code 703.
What is the Ratio of Females per 100 Males in Area Code 703?
There are 99.75 Females per 100 Males in Area Code 703.
What is the Median Population Age in Area Code 703?
Median Population Age in Area Code 703 is 38.4 Years.
What is the Average Family Size in Area Code 703
Average Family Size in Area Code 703 is 3.2 People.
What is the Average Household Size in Area Code 703
Average Household Size in Area Code 703 is 2.7 People.
How Large is the Labor Force in Area Code 703?
There are 1,291,115 People in the Labor Forcein in Area Code 703.
What is the Percentage of People in the Labor Force in Area Code 703?
72.9% of People are in the Labor Force in Area Code 703.
What is the Unemployment Rate in Area Code 703?
Unemployment Rate in Area Code 703 is 4.1%.