Spotsylvania County, VA Map & Demographics
Spotsylvania County Overview
$44,881
PER CAPITA INCOME
$114,779
AVG FAMILY INCOME
$105,068
AVG HOUSEHOLD INCOME
37.8%
WAGE / INCOME GAP [ % ]
62.2¢/ $1
WAGE / INCOME GAP [ $ ]
$11,201
FAMILY INCOME DEFICIT
0.40
INEQUALITY / GINI INDEX
141,097
TOTAL POPULATION
70,013
MALE POPULATION
71,084
FEMALE POPULATION
98.49
MALES / 100 FEMALES
101.53
FEMALES / 100 MALES
38.1
MEDIAN AGE
3.2
AVG FAMILY SIZE
2.9
AVG HOUSEHOLD SIZE
75,267
LABOR FORCE [ PEOPLE ]
68.1%
PERCENT IN LABOR FORCE
5.6%
UNEMPLOYMENT RATE
Income in Spotsylvania County
Income Overview in Spotsylvania County
Per Capita Income in Spotsylvania County is $44,881, while median incomes of families and households are $114,779 and $105,068 respectively.
| Characteristic | Number | Measure |
| Per Capita Income | 141,097 | $44,881 |
| Median Family Income | 37,388 | $114,779 |
| Mean Family Income | 37,388 | $135,510 |
| Median Household Income | 49,449 | $105,068 |
| Mean Household Income | 49,449 | $125,123 |
| Income Deficit | 37,388 | $11,201 |
| Wage / Income Gap (%) | 141,097 | 37.80% |
| Wage / Income Gap ($) | 141,097 | 62.20¢ per $1 |
| Gini / Inequality Index | 141,097 | 0.40 |
Earnings by Sex in Spotsylvania County
Average Earnings in Spotsylvania County are $47,737, $59,590 for men and $37,065 for women, a difference of 37.8%.
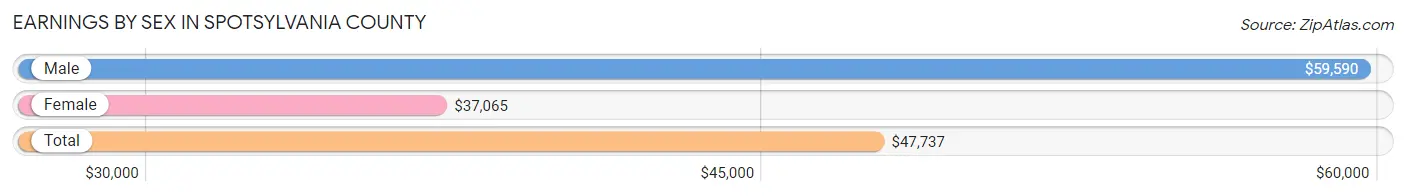
| Sex | Number | Average Earnings |
| Male | 41,644 (53.5%) | $59,590 |
| Female | 36,128 (46.5%) | $37,065 |
| Total | 77,772 (100.0%) | $47,737 |
Earnings by Sex by Income Bracket in Spotsylvania County
The most common earnings brackets in Spotsylvania County are $100,000+ for men (11,737 | 28.2%) and $100,000+ for women (4,165 | 11.5%).
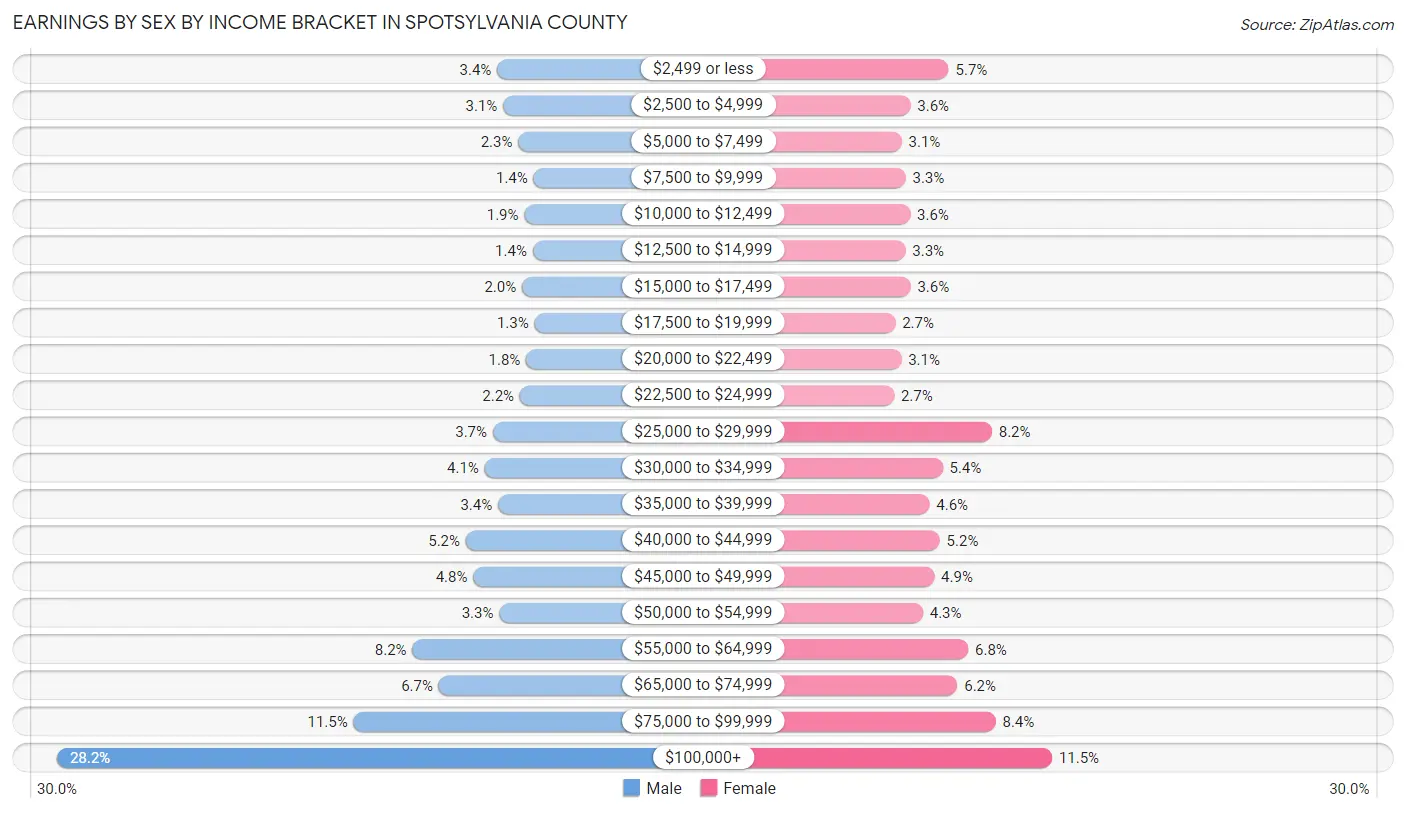
| Income | Male | Female |
| $2,499 or less | 1,433 (3.4%) | 2,066 (5.7%) |
| $2,500 to $4,999 | 1,293 (3.1%) | 1,291 (3.6%) |
| $5,000 to $7,499 | 938 (2.2%) | 1,111 (3.1%) |
| $7,500 to $9,999 | 579 (1.4%) | 1,191 (3.3%) |
| $10,000 to $12,499 | 795 (1.9%) | 1,286 (3.6%) |
| $12,500 to $14,999 | 598 (1.4%) | 1,190 (3.3%) |
| $15,000 to $17,499 | 848 (2.0%) | 1,292 (3.6%) |
| $17,500 to $19,999 | 557 (1.3%) | 981 (2.7%) |
| $20,000 to $22,499 | 752 (1.8%) | 1,106 (3.1%) |
| $22,500 to $24,999 | 901 (2.2%) | 956 (2.6%) |
| $25,000 to $29,999 | 1,533 (3.7%) | 2,945 (8.2%) |
| $30,000 to $34,999 | 1,724 (4.1%) | 1,942 (5.4%) |
| $35,000 to $39,999 | 1,411 (3.4%) | 1,675 (4.6%) |
| $40,000 to $44,999 | 2,167 (5.2%) | 1,886 (5.2%) |
| $45,000 to $49,999 | 1,991 (4.8%) | 1,775 (4.9%) |
| $50,000 to $54,999 | 1,381 (3.3%) | 1,541 (4.3%) |
| $55,000 to $64,999 | 3,413 (8.2%) | 2,463 (6.8%) |
| $65,000 to $74,999 | 2,800 (6.7%) | 2,245 (6.2%) |
| $75,000 to $99,999 | 4,793 (11.5%) | 3,021 (8.4%) |
| $100,000+ | 11,737 (28.2%) | 4,165 (11.5%) |
| Total | 41,644 (100.0%) | 36,128 (100.0%) |
Earnings by Sex by Educational Attainment in Spotsylvania County
Average earnings in Spotsylvania County are $68,946 for men and $43,092 for women, a difference of 37.5%. Men with an educational attainment of graduate degree enjoy the highest average annual earnings of $123,533, while those with less than high school education earn the least with $41,666. Women with an educational attainment of graduate degree earn the most with the average annual earnings of $67,872, while those with less than high school education have the smallest earnings of $19,643.
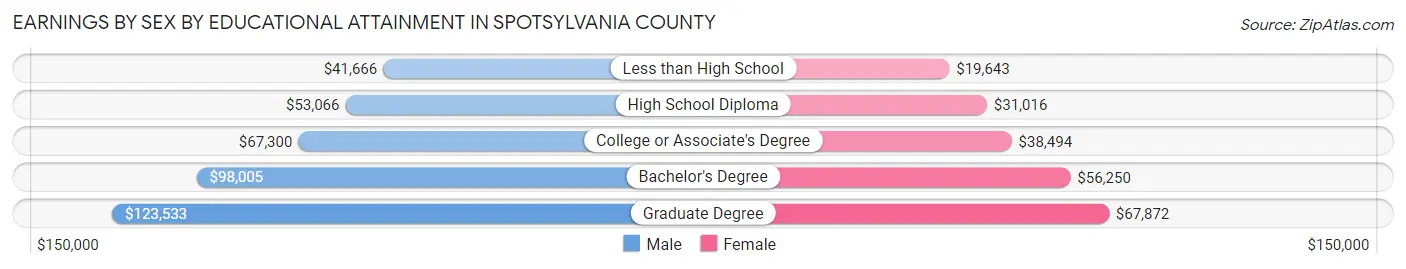
| Educational Attainment | Male Income | Female Income |
| Less than High School | $41,666 | $19,643 |
| High School Diploma | $53,066 | $31,016 |
| College or Associate's Degree | $67,300 | $38,494 |
| Bachelor's Degree | $98,005 | $56,250 |
| Graduate Degree | $123,533 | $67,872 |
| Total | $68,946 | $43,092 |
Family Income in Spotsylvania County
Family Income Brackets in Spotsylvania County
According to the Spotsylvania County family income data, there are 9,085 families falling into the $100,000 to $149,999 income range, which is the most common income bracket and makes up 24.3% of all families. Conversely, the less than $10,000 income bracket is the least frequent group with only 486 families (1.3%) belonging to this category.
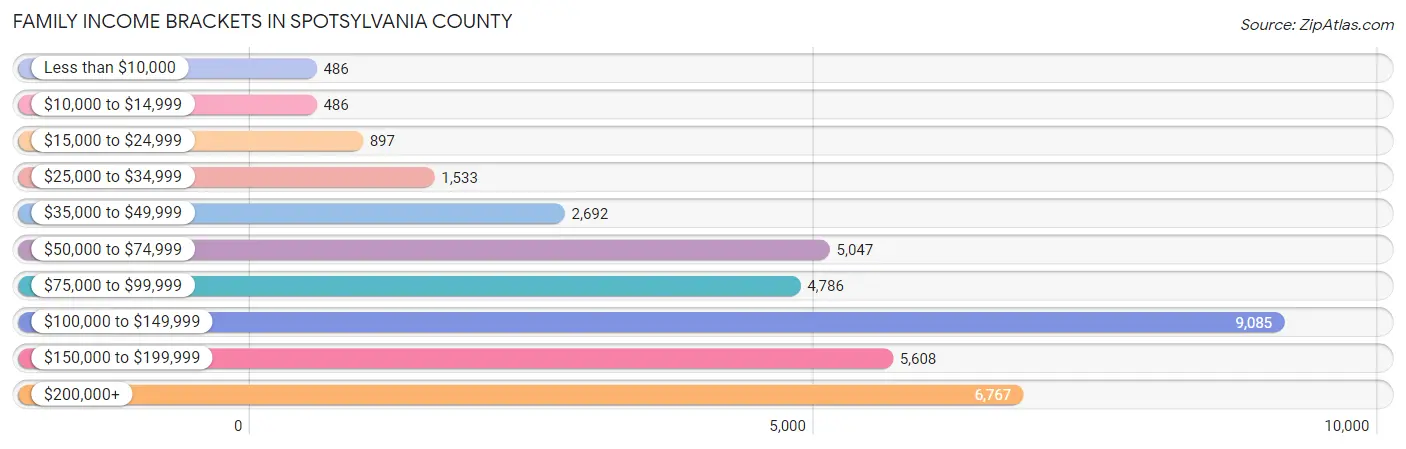
| Income Bracket | # Families | % Families |
| Less than $10,000 | 486 | 1.3% |
| $10,000 to $14,999 | 486 | 1.3% |
| $15,000 to $24,999 | 897 | 2.4% |
| $25,000 to $34,999 | 1,533 | 4.1% |
| $35,000 to $49,999 | 2,692 | 7.2% |
| $50,000 to $74,999 | 5,047 | 13.5% |
| $75,000 to $99,999 | 4,786 | 12.8% |
| $100,000 to $149,999 | 9,085 | 24.3% |
| $150,000 to $199,999 | 5,608 | 15.0% |
| $200,000+ | 6,767 | 18.1% |
Family Income by Famaliy Size in Spotsylvania County
5-person families (3,454 | 9.2%) account for the highest median family income in Spotsylvania County with $129,904 per family, while 2-person families (16,045 | 42.9%) have the highest median income of $49,877 per family member.
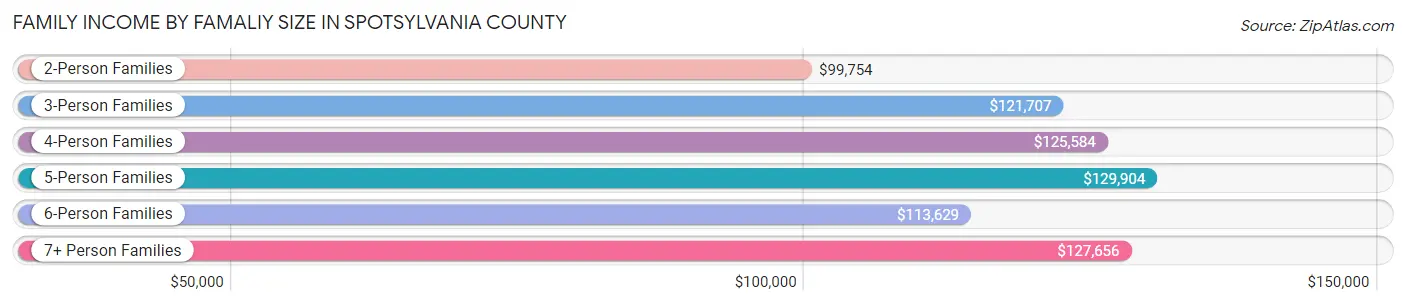
| Income Bracket | # Families | Median Income |
| 2-Person Families | 16,045 (42.9%) | $99,754 |
| 3-Person Families | 8,534 (22.8%) | $121,707 |
| 4-Person Families | 6,908 (18.5%) | $125,584 |
| 5-Person Families | 3,454 (9.2%) | $129,904 |
| 6-Person Families | 1,406 (3.8%) | $113,629 |
| 7+ Person Families | 1,041 (2.8%) | $127,656 |
| Total | 37,388 (100.0%) | $114,779 |
Family Income by Number of Earners in Spotsylvania County
The median family income in Spotsylvania County is $114,779, with families comprising 3+ earners (5,581) having the highest median family income of $175,008, while families with no earners (4,411) have the lowest median family income of $70,136, accounting for 14.9% and 11.8% of families, respectively.
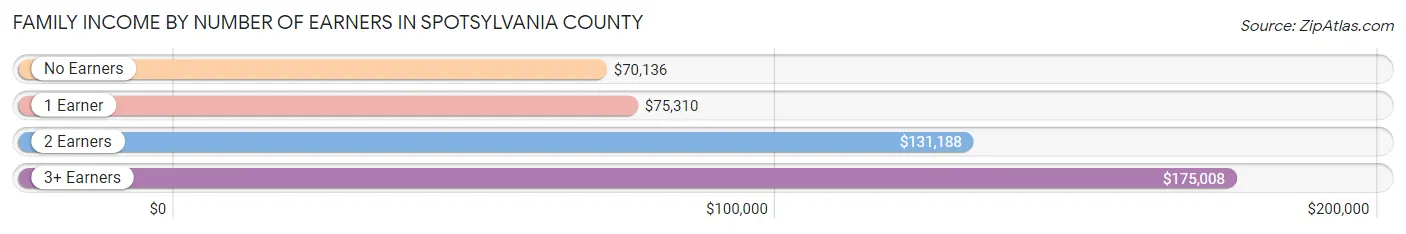
| Number of Earners | # Families | Median Income |
| No Earners | 4,411 (11.8%) | $70,136 |
| 1 Earner | 11,069 (29.6%) | $75,310 |
| 2 Earners | 16,327 (43.7%) | $131,188 |
| 3+ Earners | 5,581 (14.9%) | $175,008 |
| Total | 37,388 (100.0%) | $114,779 |
Household Income in Spotsylvania County
Household Income Brackets in Spotsylvania County
With 11,077 households falling in the category, the $100,000 to $149,999 income range is the most frequent in Spotsylvania County, accounting for 22.4% of all households. In contrast, only 890 households (1.8%) fall into the $10,000 to $14,999 income bracket, making it the least populous group.
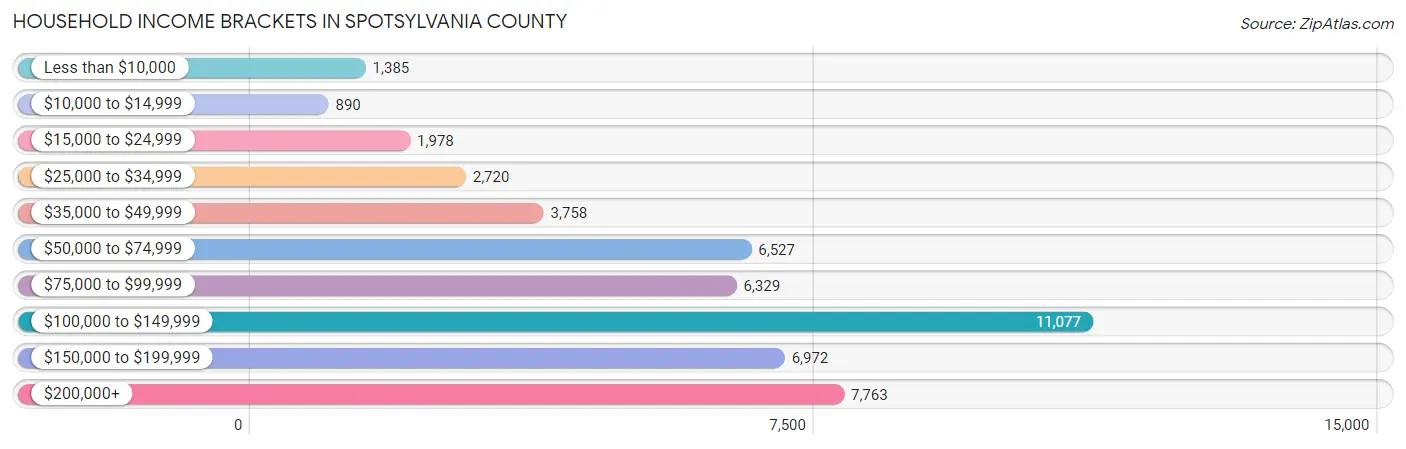
| Income Bracket | # Households | % Households |
| Less than $10,000 | 1,385 | 2.8% |
| $10,000 to $14,999 | 890 | 1.8% |
| $15,000 to $24,999 | 1,978 | 4.0% |
| $25,000 to $34,999 | 2,720 | 5.5% |
| $35,000 to $49,999 | 3,758 | 7.6% |
| $50,000 to $74,999 | 6,527 | 13.2% |
| $75,000 to $99,999 | 6,329 | 12.8% |
| $100,000 to $149,999 | 11,077 | 22.4% |
| $150,000 to $199,999 | 6,972 | 14.1% |
| $200,000+ | 7,763 | 15.7% |
Household Income by Householder Age in Spotsylvania County
The median household income in Spotsylvania County is $105,068, with the highest median household income of $131,064 found in the 45 to 64 years age bracket for the primary householder. A total of 20,277 households (41.0%) fall into this category. Meanwhile, the 15 to 24 years age bracket for the primary householder has the lowest median household income of $41,970, with 1,284 households (2.6%) in this group.
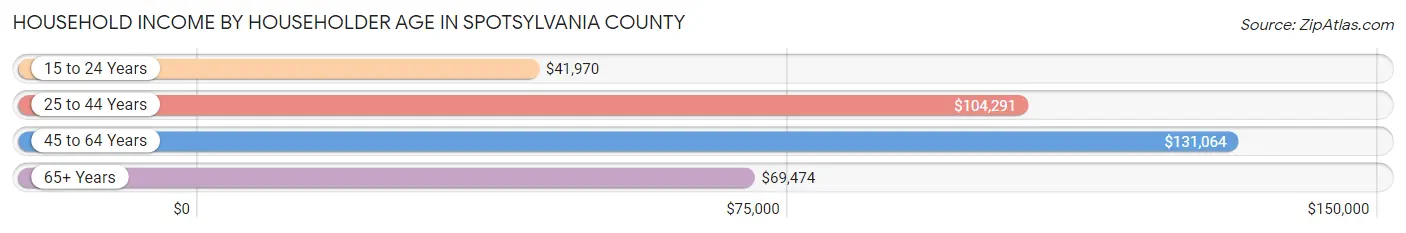
| Income Bracket | # Households | Median Income |
| 15 to 24 Years | 1,284 (2.6%) | $41,970 |
| 25 to 44 Years | 16,164 (32.7%) | $104,291 |
| 45 to 64 Years | 20,277 (41.0%) | $131,064 |
| 65+ Years | 11,724 (23.7%) | $69,474 |
| Total | 49,449 (100.0%) | $105,068 |
Poverty in Spotsylvania County
Income Below Poverty by Sex and Age in Spotsylvania County
With 6.3% poverty level for males and 8.4% for females among the residents of Spotsylvania County, 5 year old males and 15 year old females are the most vulnerable to poverty, with 100 males (11.1%) and 276 females (20.8%) in their respective age groups living below the poverty level.
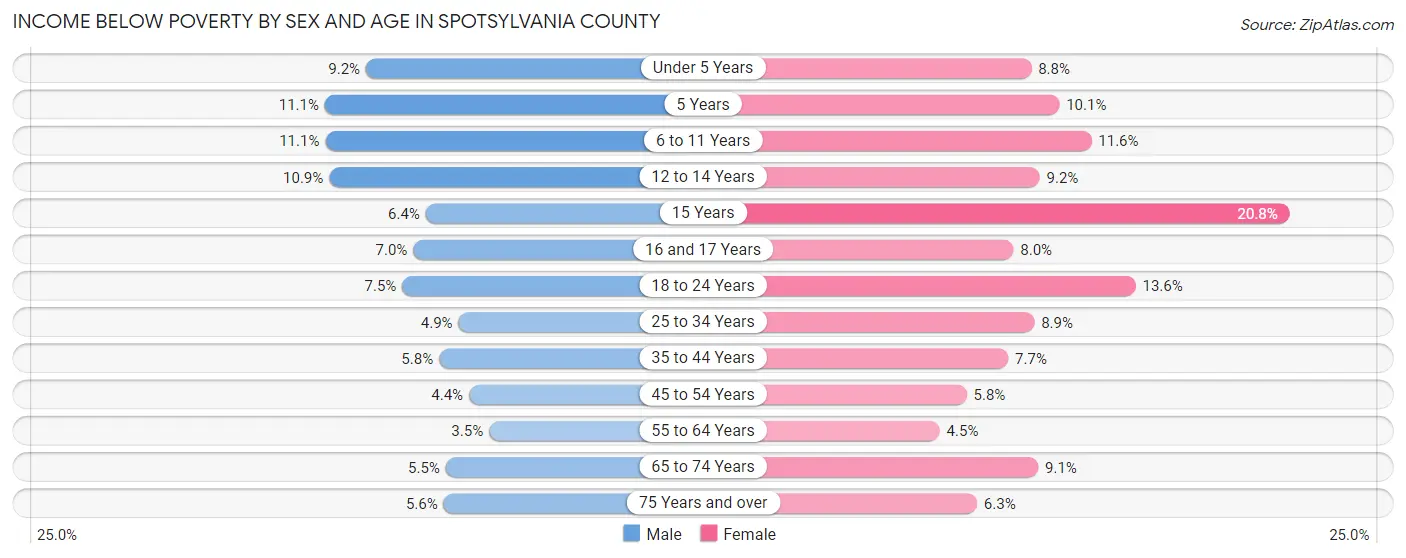
| Age Bracket | Male | Female |
| Under 5 Years | 389 (9.2%) | 356 (8.8%) |
| 5 Years | 100 (11.1%) | 91 (10.1%) |
| 6 to 11 Years | 614 (11.1%) | 626 (11.6%) |
| 12 to 14 Years | 369 (10.9%) | 280 (9.2%) |
| 15 Years | 72 (6.4%) | 276 (20.8%) |
| 16 and 17 Years | 150 (7.0%) | 144 (8.0%) |
| 18 to 24 Years | 467 (7.5%) | 793 (13.6%) |
| 25 to 34 Years | 436 (4.9%) | 795 (8.9%) |
| 35 to 44 Years | 534 (5.8%) | 711 (7.7%) |
| 45 to 54 Years | 411 (4.4%) | 556 (5.8%) |
| 55 to 64 Years | 318 (3.5%) | 425 (4.5%) |
| 65 to 74 Years | 322 (5.5%) | 612 (9.1%) |
| 75 Years and over | 185 (5.6%) | 276 (6.3%) |
| Total | 4,367 (6.3%) | 5,941 (8.4%) |
Income Above Poverty by Sex and Age in Spotsylvania County
According to the poverty statistics in Spotsylvania County, males aged 55 to 64 years and females aged 55 to 64 years are the age groups that are most secure financially, with 96.6% of males and 95.5% of females in these age groups living above the poverty line.
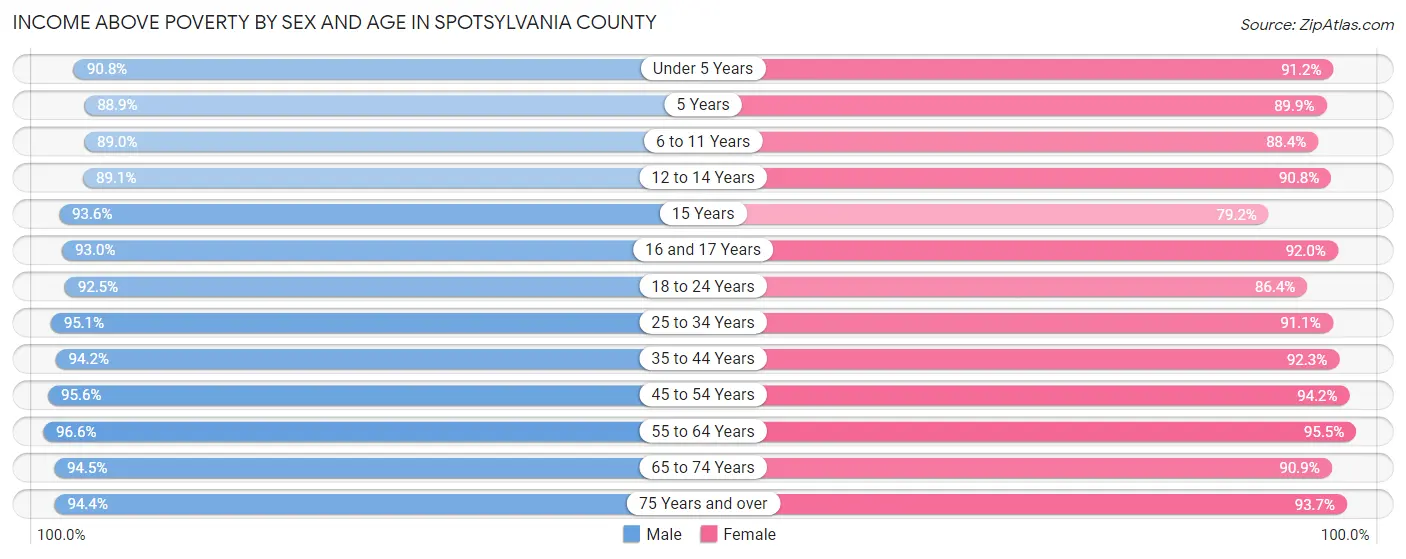
| Age Bracket | Male | Female |
| Under 5 Years | 3,856 (90.8%) | 3,693 (91.2%) |
| 5 Years | 803 (88.9%) | 811 (89.9%) |
| 6 to 11 Years | 4,944 (88.9%) | 4,782 (88.4%) |
| 12 to 14 Years | 3,027 (89.1%) | 2,770 (90.8%) |
| 15 Years | 1,054 (93.6%) | 1,052 (79.2%) |
| 16 and 17 Years | 2,003 (93.0%) | 1,665 (92.0%) |
| 18 to 24 Years | 5,773 (92.5%) | 5,027 (86.4%) |
| 25 to 34 Years | 8,511 (95.1%) | 8,105 (91.1%) |
| 35 to 44 Years | 8,721 (94.2%) | 8,493 (92.3%) |
| 45 to 54 Years | 8,971 (95.6%) | 9,046 (94.2%) |
| 55 to 64 Years | 8,910 (96.6%) | 8,942 (95.5%) |
| 65 to 74 Years | 5,575 (94.5%) | 6,105 (90.9%) |
| 75 Years and over | 3,140 (94.4%) | 4,124 (93.7%) |
| Total | 65,288 (93.7%) | 64,615 (91.6%) |
Income Below Poverty Among Married-Couple Families in Spotsylvania County
The poverty statistics for married-couple families in Spotsylvania County show that 2.7% or 805 of the total 29,511 families live below the poverty line. Families with 5 or more children have the highest poverty rate of 5.2%, comprising of 14 families. On the other hand, families with no children have the lowest poverty rate of 1.9%, which includes 312 families.
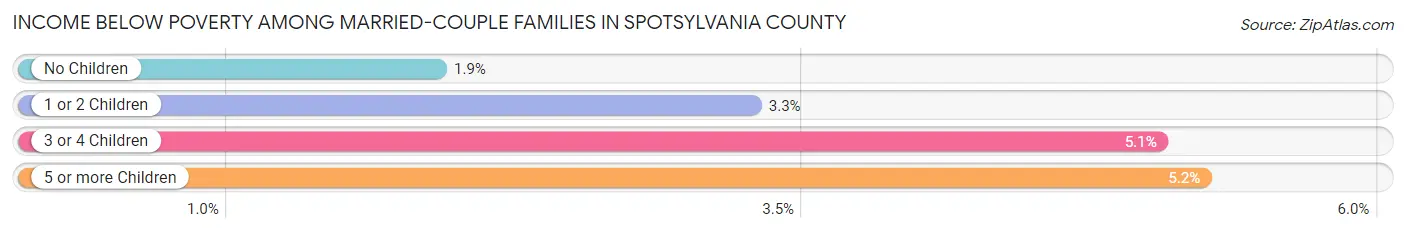
| Children | Above Poverty | Below Poverty |
| No Children | 16,003 (98.1%) | 312 (1.9%) |
| 1 or 2 Children | 9,515 (96.7%) | 323 (3.3%) |
| 3 or 4 Children | 2,935 (95.0%) | 156 (5.1%) |
| 5 or more Children | 253 (94.8%) | 14 (5.2%) |
| Total | 28,706 (97.3%) | 805 (2.7%) |
Income Below Poverty Among Single-Parent Households in Spotsylvania County
According to the poverty data in Spotsylvania County, 7.3% or 178 single-father households and 17.0% or 927 single-mother households are living below the poverty line. Among single-father households, those with 3 or 4 children have the highest poverty rate, with 52 households (25.5%) experiencing poverty. Likewise, among single-mother households, those with 5 or more children have the highest poverty rate, with 171 households (84.7%) falling below the poverty line.
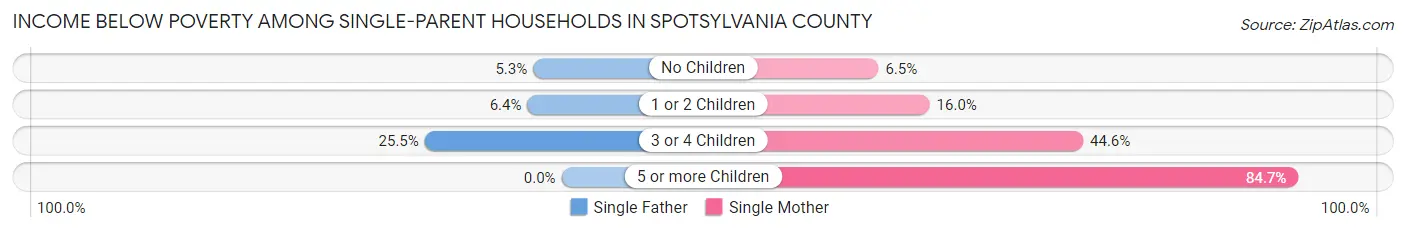
| Children | Single Father | Single Mother |
| No Children | 63 (5.3%) | 140 (6.5%) |
| 1 or 2 Children | 63 (6.4%) | 426 (16.0%) |
| 3 or 4 Children | 52 (25.5%) | 190 (44.6%) |
| 5 or more Children | 0 (0.0%) | 171 (84.7%) |
| Total | 178 (7.3%) | 927 (17.0%) |
Income Below Poverty Among Married-Couple vs Single-Parent Households in Spotsylvania County
The poverty data for Spotsylvania County shows that 805 of the married-couple family households (2.7%) and 1,105 of the single-parent households (14.0%) are living below the poverty level. Within the married-couple family households, those with 5 or more children have the highest poverty rate, with 14 households (5.2%) falling below the poverty line. Among the single-parent households, those with 5 or more children have the highest poverty rate, with 171 household (68.7%) living below poverty.
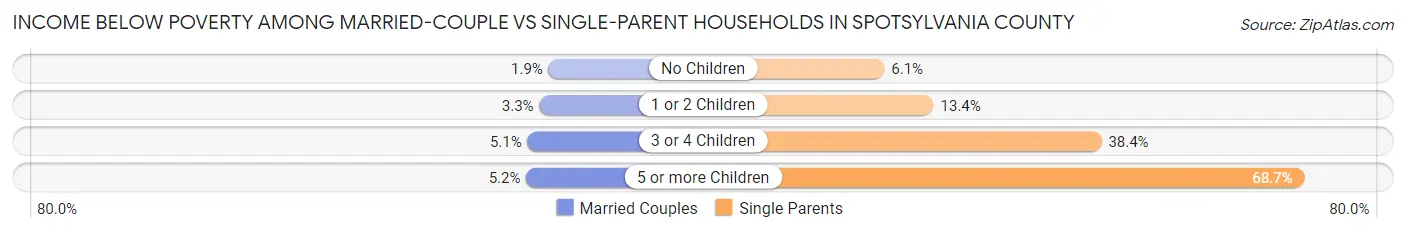
| Children | Married-Couple Families | Single-Parent Households |
| No Children | 312 (1.9%) | 203 (6.1%) |
| 1 or 2 Children | 323 (3.3%) | 489 (13.4%) |
| 3 or 4 Children | 156 (5.1%) | 242 (38.4%) |
| 5 or more Children | 14 (5.2%) | 171 (68.7%) |
| Total | 805 (2.7%) | 1,105 (14.0%) |
Race in Spotsylvania County
The most populous races in Spotsylvania County are White / Caucasian (96,233 | 68.2%), Black / African American (23,673 | 16.8%), and Hispanic or Latino (15,971 | 11.3%).
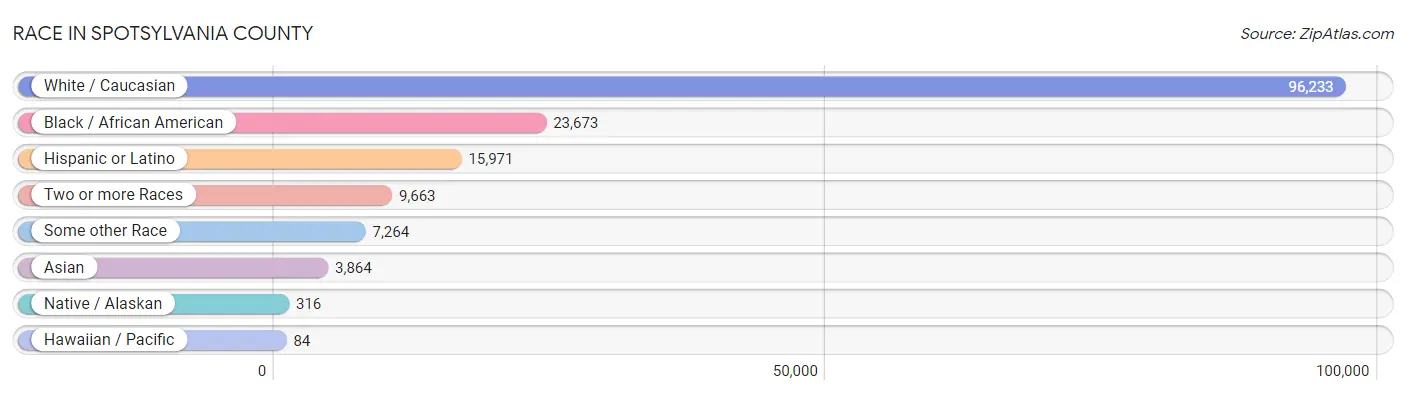
| Race | # Population | % Population |
| Asian | 3,864 | 2.7% |
| Black / African American | 23,673 | 16.8% |
| Hawaiian / Pacific | 84 | 0.1% |
| Hispanic or Latino | 15,971 | 11.3% |
| Native / Alaskan | 316 | 0.2% |
| White / Caucasian | 96,233 | 68.2% |
| Two or more Races | 9,663 | 6.9% |
| Some other Race | 7,264 | 5.1% |
| Total | 141,097 | 100.0% |
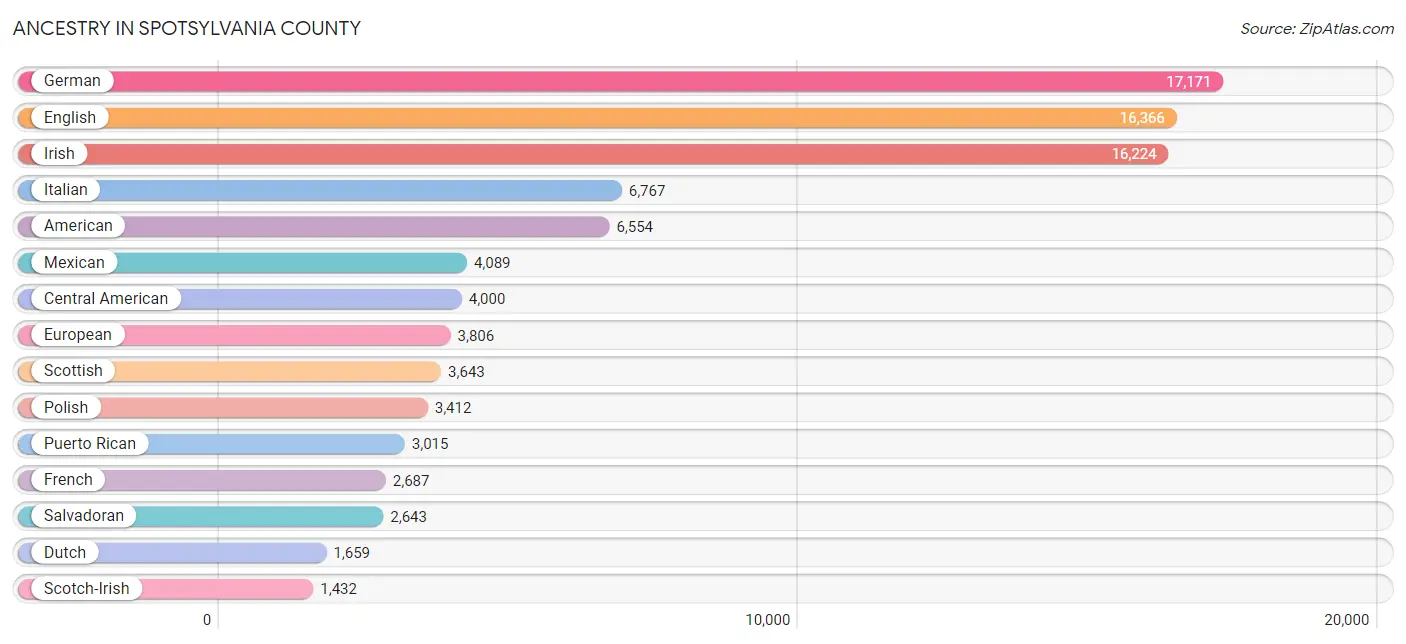
Ancestry in Spotsylvania County
The most populous ancestries reported in Spotsylvania County are German (17,171 | 12.2%), English (16,366 | 11.6%), Irish (16,224 | 11.5%), Italian (6,767 | 4.8%), and American (6,554 | 4.6%), together accounting for 44.7% of all Spotsylvania County residents.
| Ancestry | # Population | % Population |
| Afghan | 420 | 0.3% |
| African | 733 | 0.5% |
| Albanian | 15 | 0.0% |
| American | 6,554 | 4.6% |
| Apache | 6 | 0.0% |
| Arab | 740 | 0.5% |
| Argentinean | 161 | 0.1% |
| Armenian | 82 | 0.1% |
| Australian | 22 | 0.0% |
| Austrian | 185 | 0.1% |
| Barbadian | 41 | 0.0% |
| Basque | 5 | 0.0% |
| Belgian | 12 | 0.0% |
| Bhutanese | 332 | 0.2% |
| Blackfeet | 87 | 0.1% |
| Bolivian | 42 | 0.0% |
| Brazilian | 12 | 0.0% |
| British | 1,039 | 0.7% |
| British West Indian | 12 | 0.0% |
| Bulgarian | 57 | 0.0% |
| Burmese | 939 | 0.7% |
| Cambodian | 5 | 0.0% |
| Canadian | 126 | 0.1% |
| Cape Verdean | 114 | 0.1% |
| Carpatho Rusyn | 11 | 0.0% |
| Celtic | 27 | 0.0% |
| Central American | 4,000 | 2.8% |
| Central American Indian | 77 | 0.1% |
| Cherokee | 497 | 0.4% |
| Chilean | 223 | 0.2% |
| Chippewa | 50 | 0.0% |
| Choctaw | 22 | 0.0% |
| Colombian | 316 | 0.2% |
| Comanche | 1 | 0.0% |
| Costa Rican | 75 | 0.1% |
| Croatian | 168 | 0.1% |
| Cuban | 622 | 0.4% |
| Czech | 466 | 0.3% |
| Czechoslovakian | 193 | 0.1% |
| Danish | 202 | 0.1% |
| Dominican | 268 | 0.2% |
| Dutch | 1,659 | 1.2% |
| Eastern European | 334 | 0.2% |
| Ecuadorian | 9 | 0.0% |
| Egyptian | 27 | 0.0% |
| English | 16,366 | 11.6% |
| Estonian | 27 | 0.0% |
| Ethiopian | 25 | 0.0% |
| European | 3,806 | 2.7% |
| Filipino | 58 | 0.0% |
| Finnish | 122 | 0.1% |
| French | 2,687 | 1.9% |
| French Canadian | 633 | 0.4% |
| German | 17,171 | 12.2% |
| German Russian | 44 | 0.0% |
| Ghanaian | 132 | 0.1% |
| Greek | 761 | 0.5% |
| Guatemalan | 532 | 0.4% |
| Guyanese | 10 | 0.0% |
| Haitian | 131 | 0.1% |
| Honduran | 546 | 0.4% |
| Hungarian | 498 | 0.4% |
| Icelander | 51 | 0.0% |
| Indian (Asian) | 1,043 | 0.7% |
| Inupiat | 17 | 0.0% |
| Iranian | 231 | 0.2% |
| Iraqi | 200 | 0.1% |
| Irish | 16,224 | 11.5% |
| Iroquois | 46 | 0.0% |
| Italian | 6,767 | 4.8% |
| Jamaican | 578 | 0.4% |
| Japanese | 29 | 0.0% |
| Jordanian | 107 | 0.1% |
| Korean | 1,140 | 0.8% |
| Laotian | 37 | 0.0% |
| Latvian | 21 | 0.0% |
| Lebanese | 154 | 0.1% |
| Liberian | 19 | 0.0% |
| Lithuanian | 208 | 0.2% |
| Lumbee | 27 | 0.0% |
| Luxembourger | 13 | 0.0% |
| Macedonian | 5 | 0.0% |
| Malaysian | 77 | 0.1% |
| Maltese | 10 | 0.0% |
| Mexican | 4,089 | 2.9% |
| Mexican American Indian | 93 | 0.1% |
| Moroccan | 10 | 0.0% |
| Native Hawaiian | 189 | 0.1% |
| New Zealander | 45 | 0.0% |
| Nicaraguan | 61 | 0.0% |
| Nigerian | 106 | 0.1% |
| Northern European | 169 | 0.1% |
| Norwegian | 734 | 0.5% |
| Ottawa | 6 | 0.0% |
| Pakistani | 174 | 0.1% |
| Palestinian | 33 | 0.0% |
| Panamanian | 143 | 0.1% |
| Pennsylvania German | 8 | 0.0% |
| Peruvian | 290 | 0.2% |
| Polish | 3,412 | 2.4% |
| Portuguese | 459 | 0.3% |
| Potawatomi | 17 | 0.0% |
| Puerto Rican | 3,015 | 2.1% |
| Romanian | 143 | 0.1% |
| Russian | 665 | 0.5% |
| Salvadoran | 2,643 | 1.9% |
| Samoan | 52 | 0.0% |
| Scandinavian | 343 | 0.2% |
| Scotch-Irish | 1,432 | 1.0% |
| Scottish | 3,643 | 2.6% |
| Seminole | 15 | 0.0% |
| Senegalese | 22 | 0.0% |
| Serbian | 17 | 0.0% |
| Sioux | 39 | 0.0% |
| Slovak | 594 | 0.4% |
| Slovene | 52 | 0.0% |
| South African | 27 | 0.0% |
| South American | 1,137 | 0.8% |
| Spaniard | 200 | 0.1% |
| Spanish | 813 | 0.6% |
| Sri Lankan | 534 | 0.4% |
| Subsaharan African | 1,388 | 1.0% |
| Sudanese | 39 | 0.0% |
| Swedish | 1,035 | 0.7% |
| Swiss | 310 | 0.2% |
| Syrian | 68 | 0.1% |
| Thai | 542 | 0.4% |
| Tlingit-Haida | 2 | 0.0% |
| Tongan | 20 | 0.0% |
| Trinidadian and Tobagonian | 82 | 0.1% |
| Turkish | 133 | 0.1% |
| U.S. Virgin Islander | 19 | 0.0% |
| Ukrainian | 198 | 0.1% |
| Uruguayan | 26 | 0.0% |
| Venezuelan | 70 | 0.1% |
| Welsh | 1,224 | 0.9% |
| West Indian | 86 | 0.1% |
| Yugoslavian | 11 | 0.0% | View All 138 Rows |
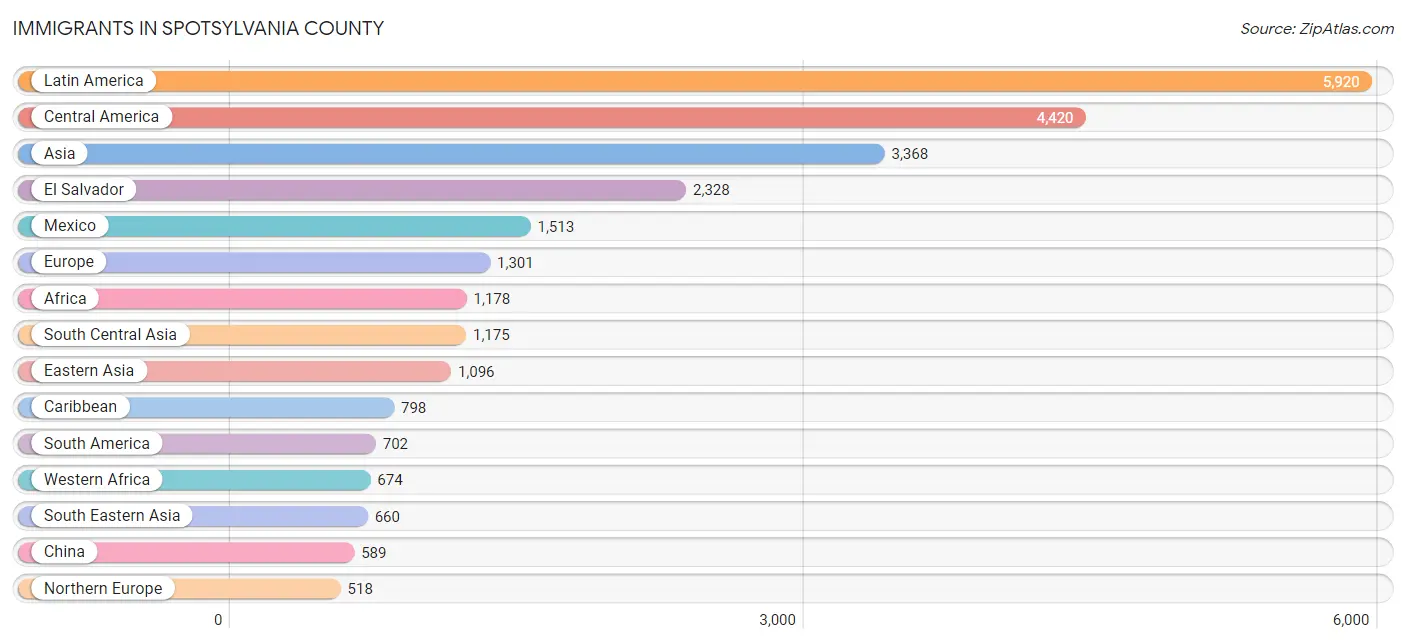
Immigrants in Spotsylvania County
The most numerous immigrant groups reported in Spotsylvania County came from Latin America (5,920 | 4.2%), Central America (4,420 | 3.1%), Asia (3,368 | 2.4%), El Salvador (2,328 | 1.7%), and Mexico (1,513 | 1.1%), together accounting for 12.4% of all Spotsylvania County residents.
| Immigration Origin | # Population | % Population |
| Afghanistan | 352 | 0.3% |
| Africa | 1,178 | 0.8% |
| Argentina | 136 | 0.1% |
| Armenia | 6 | 0.0% |
| Asia | 3,368 | 2.4% |
| Australia | 98 | 0.1% |
| Austria | 15 | 0.0% |
| Bolivia | 24 | 0.0% |
| Brazil | 41 | 0.0% |
| Cameroon | 99 | 0.1% |
| Canada | 157 | 0.1% |
| Caribbean | 798 | 0.6% |
| Central America | 4,420 | 3.1% |
| Chile | 45 | 0.0% |
| China | 589 | 0.4% |
| Colombia | 140 | 0.1% |
| Costa Rica | 30 | 0.0% |
| Cuba | 328 | 0.2% |
| Czechoslovakia | 9 | 0.0% |
| Denmark | 29 | 0.0% |
| Dominica | 6 | 0.0% |
| Dominican Republic | 18 | 0.0% |
| Eastern Africa | 99 | 0.1% |
| Eastern Asia | 1,096 | 0.8% |
| Eastern Europe | 249 | 0.2% |
| Egypt | 76 | 0.1% |
| El Salvador | 2,328 | 1.7% |
| England | 110 | 0.1% |
| Ethiopia | 34 | 0.0% |
| Europe | 1,301 | 0.9% |
| France | 79 | 0.1% |
| Germany | 408 | 0.3% |
| Ghana | 185 | 0.1% |
| Grenada | 35 | 0.0% |
| Guatemala | 189 | 0.1% |
| Guyana | 28 | 0.0% |
| Haiti | 32 | 0.0% |
| Honduras | 331 | 0.2% |
| Hong Kong | 40 | 0.0% |
| India | 295 | 0.2% |
| Indonesia | 49 | 0.0% |
| Iran | 124 | 0.1% |
| Iraq | 241 | 0.2% |
| Ireland | 18 | 0.0% |
| Italy | 15 | 0.0% |
| Jamaica | 358 | 0.3% |
| Japan | 82 | 0.1% |
| Kazakhstan | 42 | 0.0% |
| Kenya | 30 | 0.0% |
| Korea | 425 | 0.3% |
| Laos | 24 | 0.0% |
| Latin America | 5,920 | 4.2% |
| Latvia | 19 | 0.0% |
| Lebanon | 82 | 0.1% |
| Liberia | 13 | 0.0% |
| Malaysia | 8 | 0.0% |
| Mexico | 1,513 | 1.1% |
| Middle Africa | 230 | 0.2% |
| Morocco | 10 | 0.0% |
| Nigeria | 274 | 0.2% |
| North Macedonia | 9 | 0.0% |
| Northern Africa | 99 | 0.1% |
| Northern Europe | 518 | 0.4% |
| Oceania | 146 | 0.1% |
| Pakistan | 255 | 0.2% |
| Panama | 29 | 0.0% |
| Peru | 172 | 0.1% |
| Philippines | 324 | 0.2% |
| Poland | 48 | 0.0% |
| Portugal | 17 | 0.0% |
| Romania | 34 | 0.0% |
| Russia | 62 | 0.0% |
| Scotland | 64 | 0.1% |
| Senegal | 22 | 0.0% |
| Sierra Leone | 1 | 0.0% |
| South Africa | 19 | 0.0% |
| South America | 702 | 0.5% |
| South Central Asia | 1,175 | 0.8% |
| South Eastern Asia | 660 | 0.5% |
| Southern Europe | 32 | 0.0% |
| Sri Lanka | 81 | 0.1% |
| St. Vincent and the Grenadines | 8 | 0.0% |
| Sudan | 5 | 0.0% |
| Sweden | 34 | 0.0% |
| Syria | 6 | 0.0% |
| Taiwan | 55 | 0.0% |
| Thailand | 149 | 0.1% |
| Trinidad and Tobago | 13 | 0.0% |
| Turkey | 76 | 0.1% |
| Ukraine | 11 | 0.0% |
| Uruguay | 26 | 0.0% |
| Venezuela | 90 | 0.1% |
| Vietnam | 106 | 0.1% |
| Western Africa | 674 | 0.5% |
| Western Asia | 411 | 0.3% |
| Western Europe | 502 | 0.4% |
| Zimbabwe | 8 | 0.0% | View All 97 Rows |
Sex and Age in Spotsylvania County
Sex and Age in Spotsylvania County
The most populous age groups in Spotsylvania County are 10 to 14 Years (5,468 | 7.8%) for men and 10 to 14 Years (5,108 | 7.2%) for women.
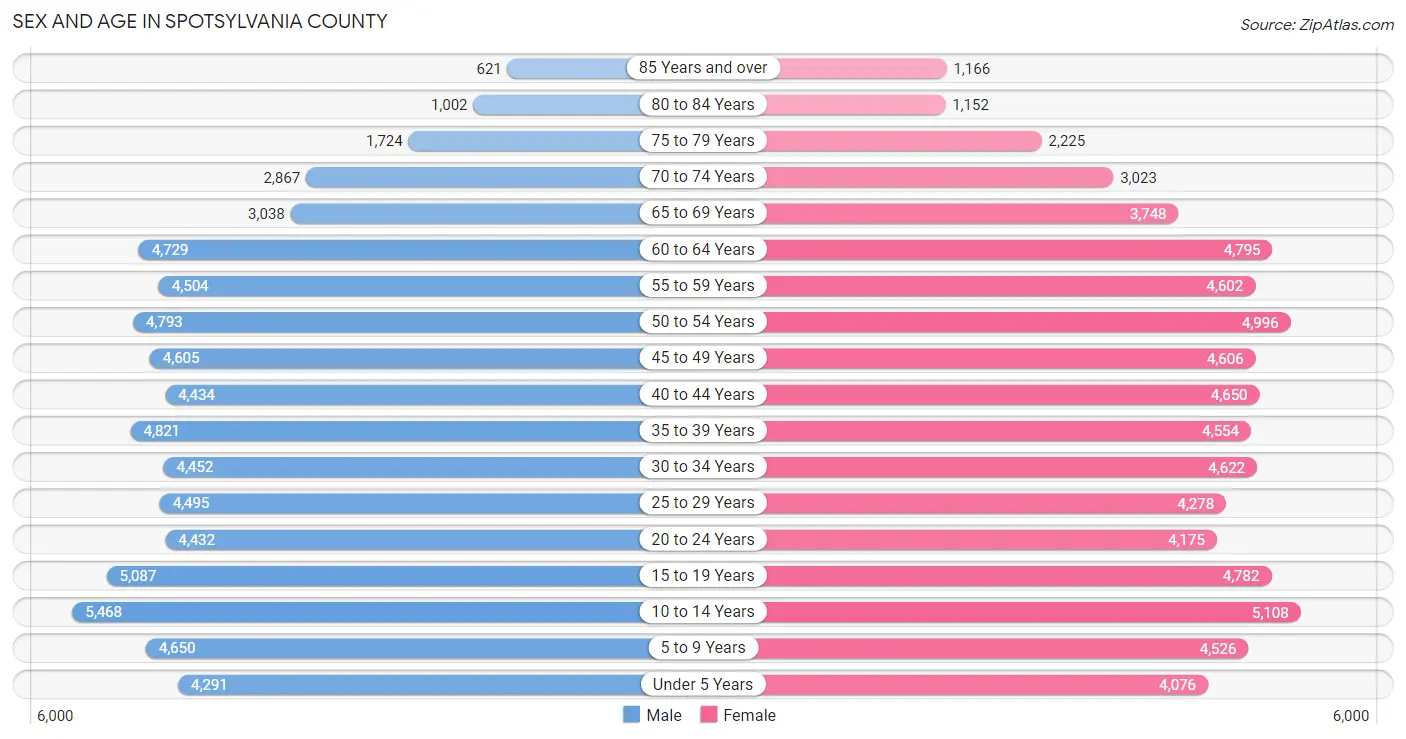
| Age Bracket | Male | Female |
| Under 5 Years | 4,291 (6.1%) | 4,076 (5.7%) |
| 5 to 9 Years | 4,650 (6.6%) | 4,526 (6.4%) |
| 10 to 14 Years | 5,468 (7.8%) | 5,108 (7.2%) |
| 15 to 19 Years | 5,087 (7.3%) | 4,782 (6.7%) |
| 20 to 24 Years | 4,432 (6.3%) | 4,175 (5.9%) |
| 25 to 29 Years | 4,495 (6.4%) | 4,278 (6.0%) |
| 30 to 34 Years | 4,452 (6.4%) | 4,622 (6.5%) |
| 35 to 39 Years | 4,821 (6.9%) | 4,554 (6.4%) |
| 40 to 44 Years | 4,434 (6.3%) | 4,650 (6.5%) |
| 45 to 49 Years | 4,605 (6.6%) | 4,606 (6.5%) |
| 50 to 54 Years | 4,793 (6.9%) | 4,996 (7.0%) |
| 55 to 59 Years | 4,504 (6.4%) | 4,602 (6.5%) |
| 60 to 64 Years | 4,729 (6.8%) | 4,795 (6.8%) |
| 65 to 69 Years | 3,038 (4.3%) | 3,748 (5.3%) |
| 70 to 74 Years | 2,867 (4.1%) | 3,023 (4.3%) |
| 75 to 79 Years | 1,724 (2.5%) | 2,225 (3.1%) |
| 80 to 84 Years | 1,002 (1.4%) | 1,152 (1.6%) |
| 85 Years and over | 621 (0.9%) | 1,166 (1.6%) |
| Total | 70,013 (100.0%) | 71,084 (100.0%) |
Families and Households in Spotsylvania County
Median Family Size in Spotsylvania County
The median family size in Spotsylvania County is 3.24 persons per family, with married-couple families (29,511 | 78.9%) accounting for the largest median family size of 3.3 persons per family. On the other hand, single male/father families (2,429 | 6.5%) represent the smallest median family size with 2.76 persons per family.
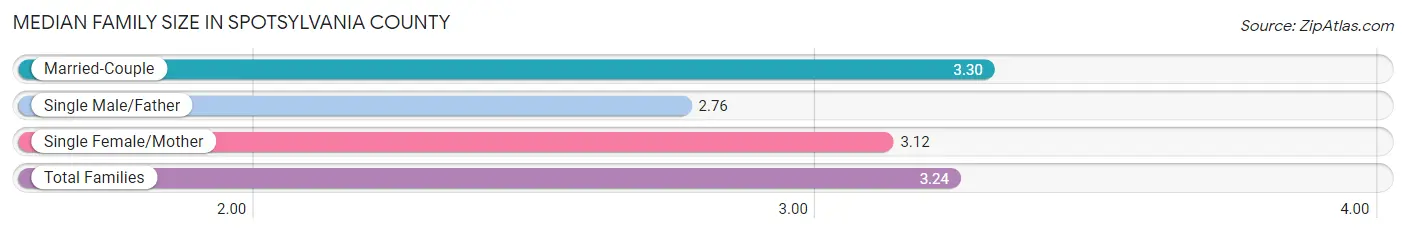
| Family Type | # Families | Family Size |
| Married-Couple | 29,511 (78.9%) | 3.30 |
| Single Male/Father | 2,429 (6.5%) | 2.76 |
| Single Female/Mother | 5,448 (14.6%) | 3.12 |
| Total Families | 37,388 (100.0%) | 3.24 |
Median Household Size in Spotsylvania County
The median household size in Spotsylvania County is 2.85 persons per household, with single female/mother households (5,448 | 11.0%) accounting for the largest median household size of 3.46 persons per household. non-family households (12,061 | 24.4%) represent the smallest median household size with 1.29 persons per household.
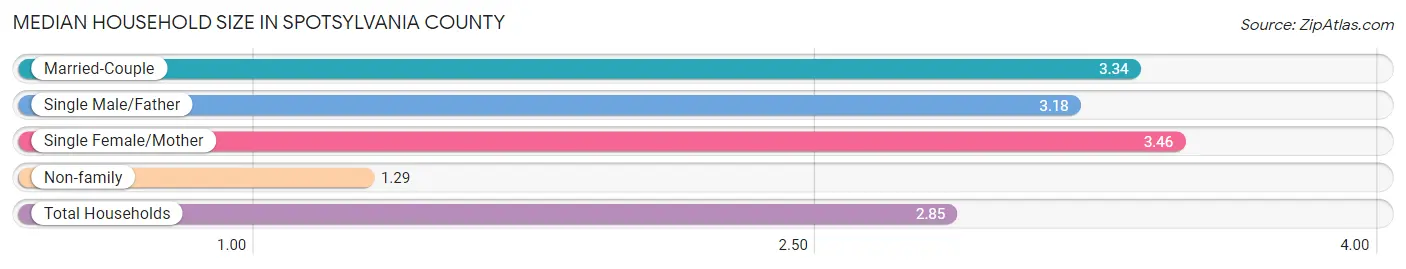
| Household Type | # Households | Household Size |
| Married-Couple | 29,511 (59.7%) | 3.34 |
| Single Male/Father | 2,429 (4.9%) | 3.18 |
| Single Female/Mother | 5,448 (11.0%) | 3.46 |
| Non-family | 12,061 (24.4%) | 1.29 |
| Total Households | 49,449 (100.0%) | 2.85 |
Household Size by Marriage Status in Spotsylvania County
Out of a total of 49,449 households in Spotsylvania County, 37,388 (75.6%) are family households, while 12,061 (24.4%) are nonfamily households. The most numerous type of family households are 2-person households, comprising 14,653, and the most common type of nonfamily households are 1-person households, comprising 9,495.
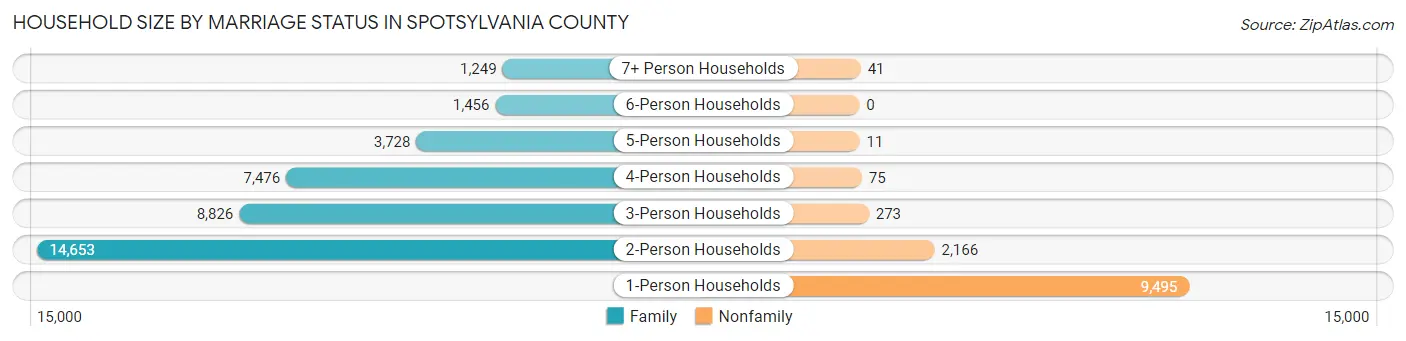
| Household Size | Family Households | Nonfamily Households |
| 1-Person Households | - | 9,495 (19.2%) |
| 2-Person Households | 14,653 (29.6%) | 2,166 (4.4%) |
| 3-Person Households | 8,826 (17.8%) | 273 (0.5%) |
| 4-Person Households | 7,476 (15.1%) | 75 (0.2%) |
| 5-Person Households | 3,728 (7.5%) | 11 (0.0%) |
| 6-Person Households | 1,456 (2.9%) | 0 (0.0%) |
| 7+ Person Households | 1,249 (2.5%) | 41 (0.1%) |
| Total | 37,388 (75.6%) | 12,061 (24.4%) |
Female Fertility in Spotsylvania County
Fertility by Age in Spotsylvania County
Average fertility rate in Spotsylvania County is 51.0 births per 1,000 women. Women in the age bracket of 20 to 34 years have the highest fertility rate with 92.0 births per 1,000 women. Women in the age bracket of 20 to 34 years acount for 71.6% of all women with births.
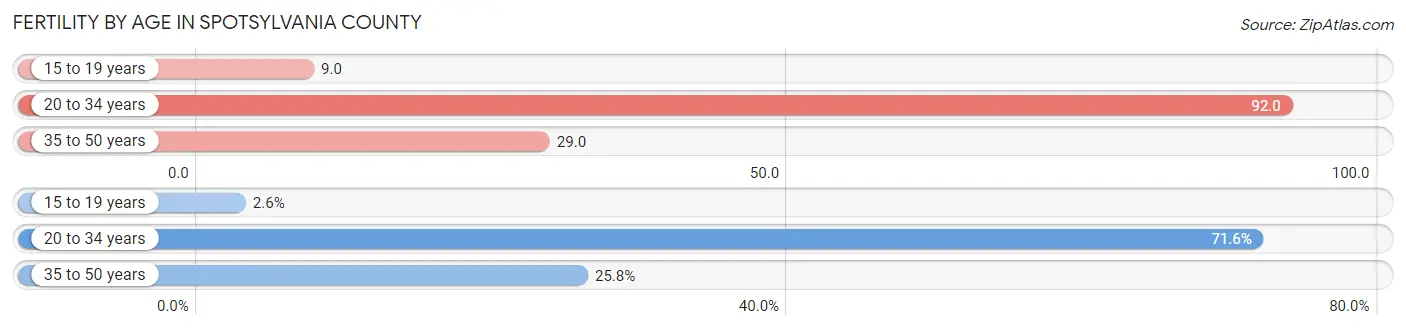
| Age Bracket | Women with Births | Births / 1,000 Women |
| 15 to 19 years | 43 (2.6%) | 9.0 |
| 20 to 34 years | 1,197 (71.6%) | 92.0 |
| 35 to 50 years | 431 (25.8%) | 29.0 |
| Total | 1,671 (100.0%) | 51.0 |
Fertility by Age by Marriage Status in Spotsylvania County
78.2% of women with births (1,671) in Spotsylvania County are married. The highest percentage of unmarried women with births falls into 15 to 19 years age bracket with 100.0% of them unmarried at the time of birth, while the lowest percentage of unmarried women with births belong to 35 to 50 years age bracket with 7.9% of them unmarried.
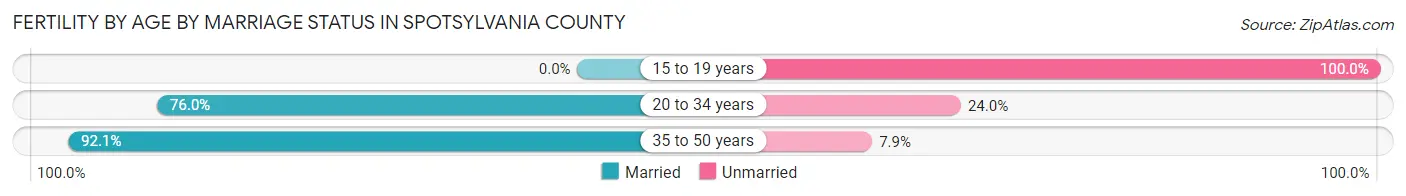
| Age Bracket | Married | Unmarried |
| 15 to 19 years | 0 (0.0%) | 43 (100.0%) |
| 20 to 34 years | 910 (76.0%) | 287 (24.0%) |
| 35 to 50 years | 397 (92.1%) | 34 (7.9%) |
| Total | 1,307 (78.2%) | 364 (21.8%) |
Fertility by Education in Spotsylvania County
Average fertility rate in Spotsylvania County is 51.0 births per 1,000 women. Women with the education attainment of bachelor's degree have the highest fertility rate of 79.0 births per 1,000 women, while women with the education attainment of less than high school have the lowest fertility at 13.0 births per 1,000 women. Women with the education attainment of bachelor's degree represent 28.8% of all women with births.
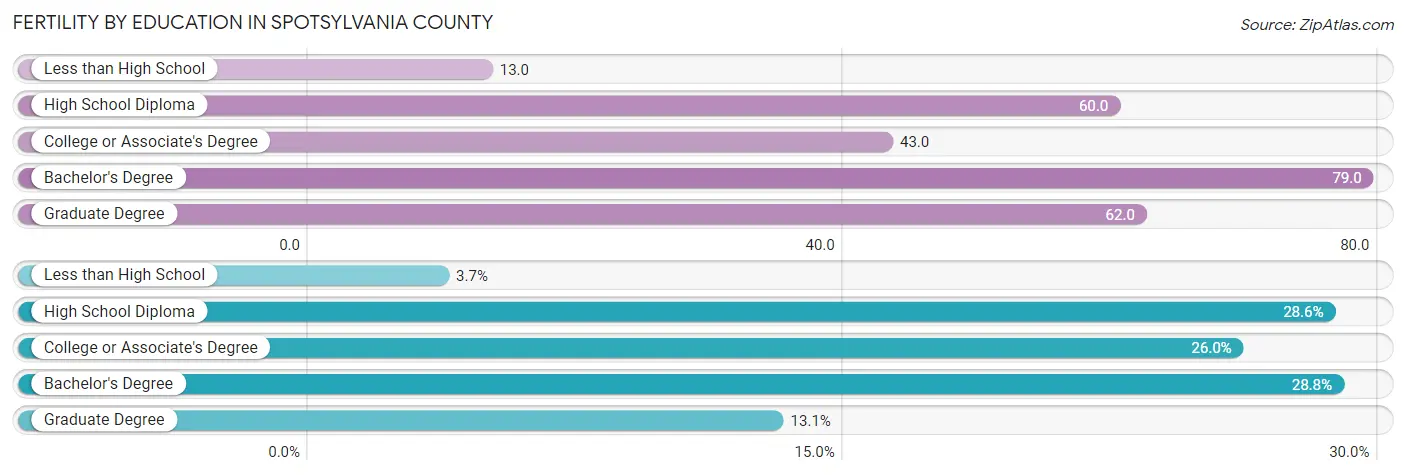
| Educational Attainment | Women with Births | Births / 1,000 Women |
| Less than High School | 61 (3.6%) | 13.0 |
| High School Diploma | 477 (28.5%) | 60.0 |
| College or Associate's Degree | 434 (26.0%) | 43.0 |
| Bachelor's Degree | 481 (28.8%) | 79.0 |
| Graduate Degree | 218 (13.1%) | 62.0 |
| Total | 1,671 (100.0%) | 51.0 |
Fertility by Education by Marriage Status in Spotsylvania County
21.8% of women with births in Spotsylvania County are unmarried. Women with the educational attainment of bachelor's degree are most likely to be married with 95.8% of them married at childbirth, while women with the educational attainment of less than high school are least likely to be married with 82.0% of them unmarried at childbirth.
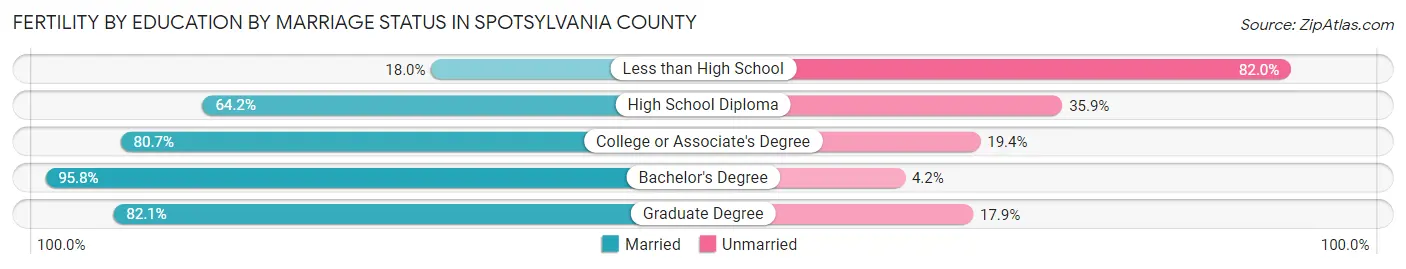
| Educational Attainment | Married | Unmarried |
| Less than High School | 11 (18.0%) | 50 (82.0%) |
| High School Diploma | 306 (64.1%) | 171 (35.8%) |
| College or Associate's Degree | 350 (80.6%) | 84 (19.4%) |
| Bachelor's Degree | 461 (95.8%) | 20 (4.2%) |
| Graduate Degree | 179 (82.1%) | 39 (17.9%) |
| Total | 1,307 (78.2%) | 364 (21.8%) |
Employment Characteristics in Spotsylvania County
Employment by Class of Employer in Spotsylvania County
Among the 69,708 employed individuals in Spotsylvania County, private company employees (42,455 | 60.9%), federal government employees (8,957 | 12.9%), and local government employees (5,702 | 8.2%) make up the most common classes of employment.
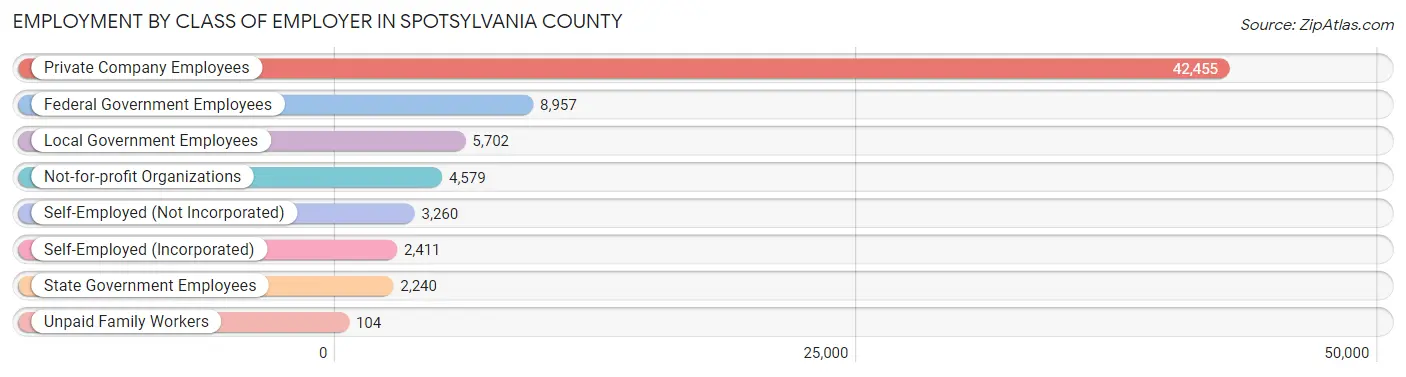
| Employer Class | # Employees | % Employees |
| Private Company Employees | 42,455 | 60.9% |
| Self-Employed (Incorporated) | 2,411 | 3.5% |
| Self-Employed (Not Incorporated) | 3,260 | 4.7% |
| Not-for-profit Organizations | 4,579 | 6.6% |
| Local Government Employees | 5,702 | 8.2% |
| State Government Employees | 2,240 | 3.2% |
| Federal Government Employees | 8,957 | 12.9% |
| Unpaid Family Workers | 104 | 0.2% |
| Total | 69,708 | 100.0% |
Employment Status by Age in Spotsylvania County
According to the labor force statistics for Spotsylvania County, out of the total population over 16 years of age (110,524), 68.1% or 75,267 individuals are in the labor force, with 5.6% or 4,215 of them unemployed. The age group with the highest labor force participation rate is 35 to 44 years, with 86.5% or 15,967 individuals in the labor force. Within the labor force, the 16 to 19 years age range has the highest percentage of unemployed individuals, with 19.0% or 748 of them being unemployed.
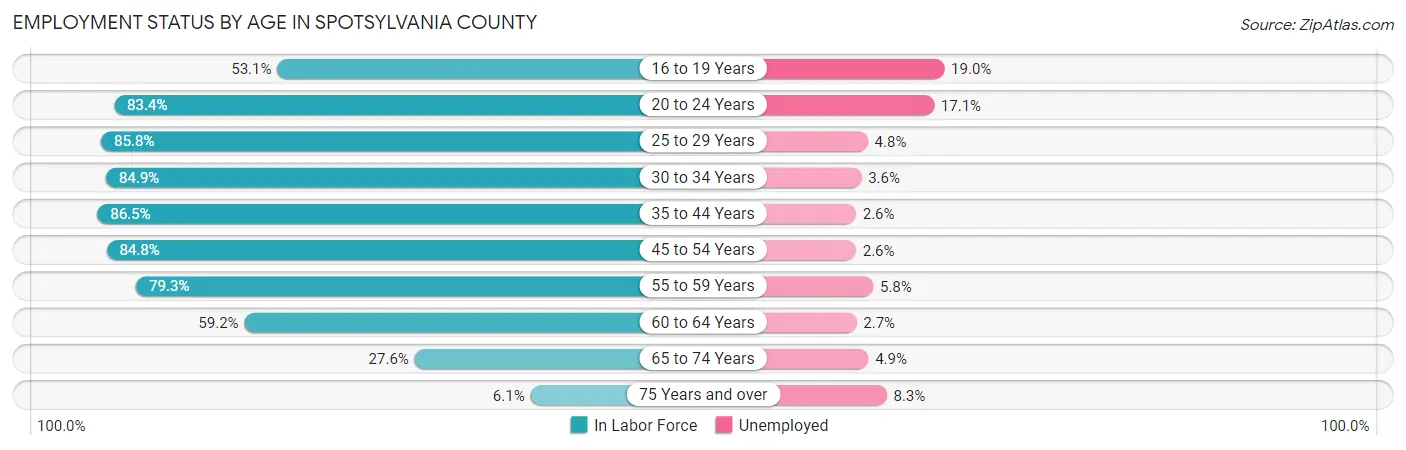
| Age Bracket | In Labor Force | Unemployed |
| 16 to 19 Years | 3,937 (53.1%) | 748 (19.0%) |
| 20 to 24 Years | 7,178 (83.4%) | 1,227 (17.1%) |
| 25 to 29 Years | 7,527 (85.8%) | 361 (4.8%) |
| 30 to 34 Years | 7,704 (84.9%) | 277 (3.6%) |
| 35 to 44 Years | 15,967 (86.5%) | 415 (2.6%) |
| 45 to 54 Years | 16,112 (84.8%) | 419 (2.6%) |
| 55 to 59 Years | 7,221 (79.3%) | 419 (5.8%) |
| 60 to 64 Years | 5,638 (59.2%) | 152 (2.7%) |
| 65 to 74 Years | 3,499 (27.6%) | 171 (4.9%) |
| 75 Years and over | 481 (6.1%) | 40 (8.3%) |
| Total | 75,267 (68.1%) | 4,215 (5.6%) |
Employment Status by Educational Attainment in Spotsylvania County
According to labor force statistics for Spotsylvania County, 81.4% of individuals (60,184) out of the total population between 25 and 64 years of age (73,936) are in the labor force, with 3.4% or 2,046 of them being unemployed. The group with the highest labor force participation rate are those with the educational attainment of bachelor's degree or higher, with 87.0% or 21,958 individuals in the labor force. Within the labor force, individuals with less than high school education have the highest percentage of unemployment, with 6.0% or 244 of them being unemployed.
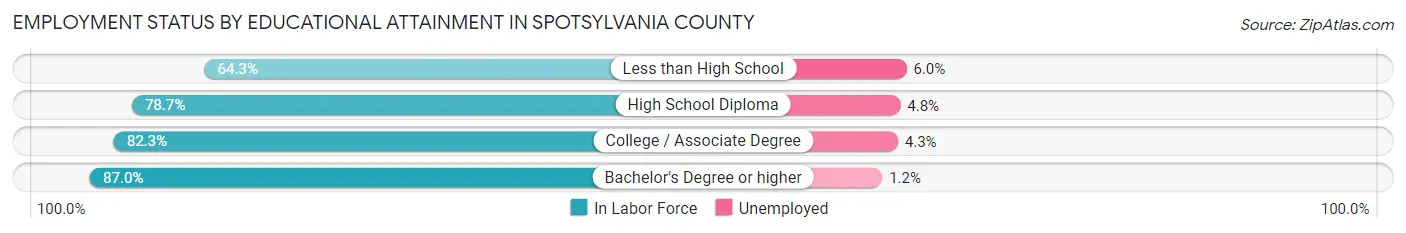
| Educational Attainment | In Labor Force | Unemployed |
| Less than High School | 4,071 (64.3%) | 380 (6.0%) |
| High School Diploma | 15,294 (78.7%) | 933 (4.8%) |
| College / Associate Degree | 18,874 (82.3%) | 986 (4.3%) |
| Bachelor's Degree or higher | 21,958 (87.0%) | 303 (1.2%) |
| Total | 60,184 (81.4%) | 2,514 (3.4%) |
Employment Occupations by Sex in Spotsylvania County
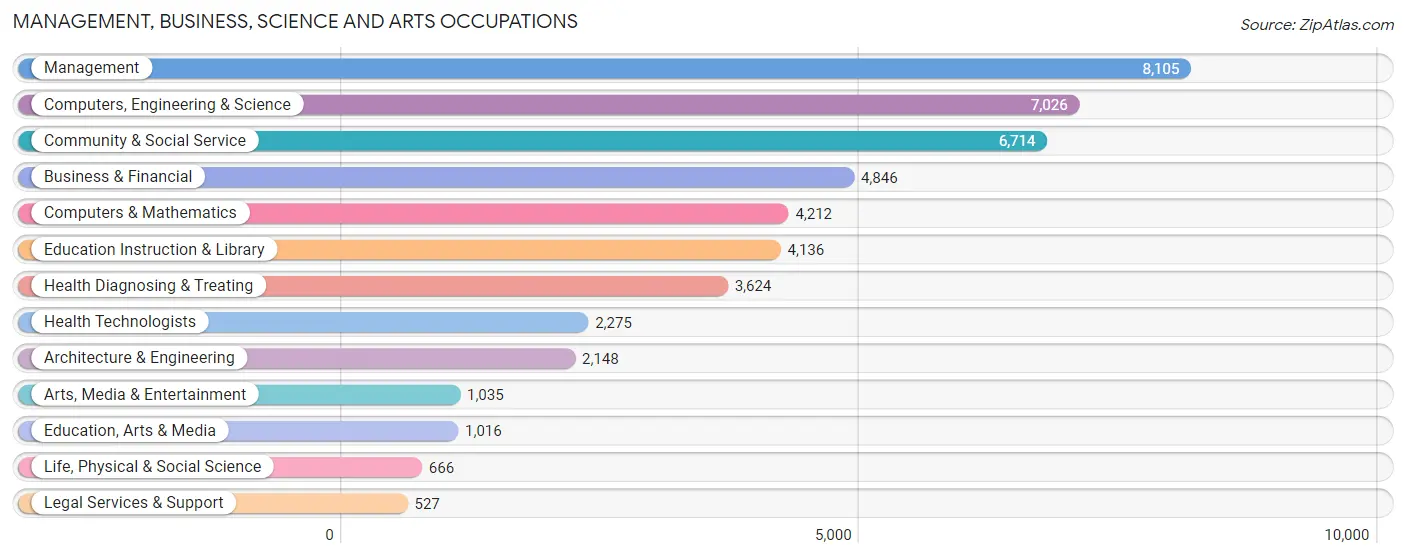
Management, Business, Science and Arts Occupations
The most common Management, Business, Science and Arts occupations in Spotsylvania County are Management (8,105 | 11.5%), Computers, Engineering & Science (7,026 | 10.0%), Community & Social Service (6,714 | 9.6%), Business & Financial (4,846 | 6.9%), and Computers & Mathematics (4,212 | 6.0%).
Management, Business, Science and Arts Occupations by Sex
Within the Management, Business, Science and Arts occupations in Spotsylvania County, the most male-oriented occupations are Architecture & Engineering (88.3%), Computers, Engineering & Science (75.1%), and Computers & Mathematics (70.5%), while the most female-oriented occupations are Health Technologists (83.5%), Health Diagnosing & Treating (82.0%), and Education Instruction & Library (78.6%).
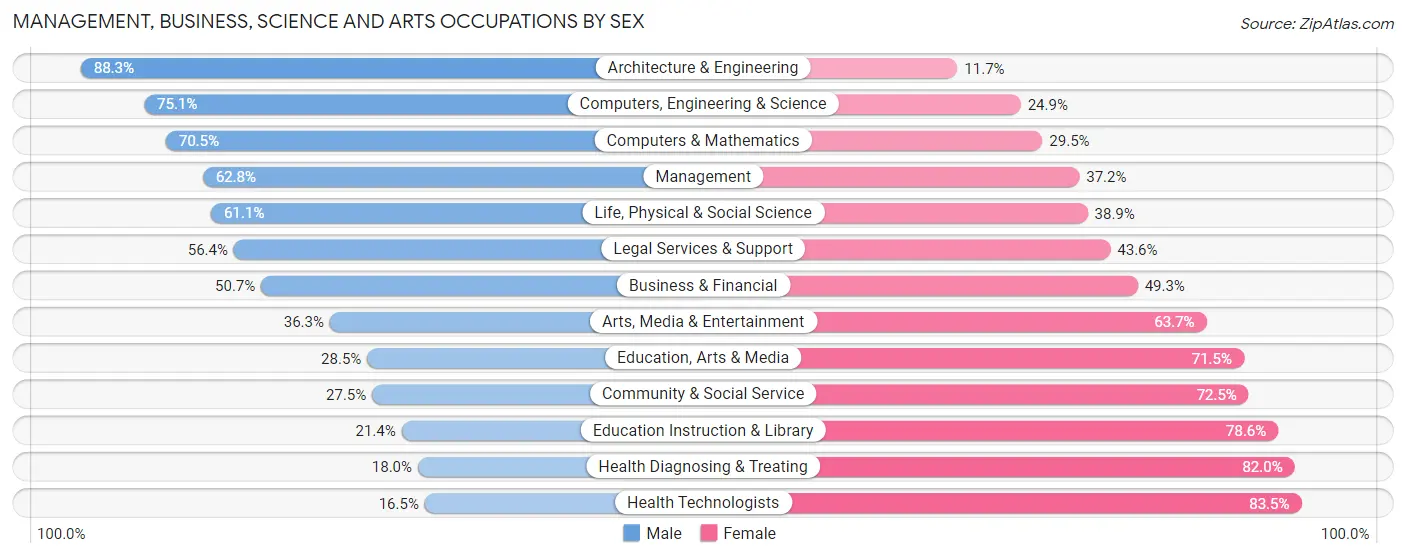
| Occupation | Male | Female |
| Management | 5,093 (62.8%) | 3,012 (37.2%) |
| Business & Financial | 2,455 (50.7%) | 2,391 (49.3%) |
| Computers, Engineering & Science | 5,274 (75.1%) | 1,752 (24.9%) |
| Computers & Mathematics | 2,971 (70.5%) | 1,241 (29.5%) |
| Architecture & Engineering | 1,896 (88.3%) | 252 (11.7%) |
| Life, Physical & Social Science | 407 (61.1%) | 259 (38.9%) |
| Community & Social Service | 1,847 (27.5%) | 4,867 (72.5%) |
| Education, Arts & Media | 290 (28.5%) | 726 (71.5%) |
| Legal Services & Support | 297 (56.4%) | 230 (43.6%) |
| Education Instruction & Library | 884 (21.4%) | 3,252 (78.6%) |
| Arts, Media & Entertainment | 376 (36.3%) | 659 (63.7%) |
| Health Diagnosing & Treating | 651 (18.0%) | 2,973 (82.0%) |
| Health Technologists | 376 (16.5%) | 1,899 (83.5%) |
| Total (Category) | 15,320 (50.5%) | 14,995 (49.5%) |
| Total (Overall) | 38,179 (54.3%) | 32,148 (45.7%) |
Services Occupations
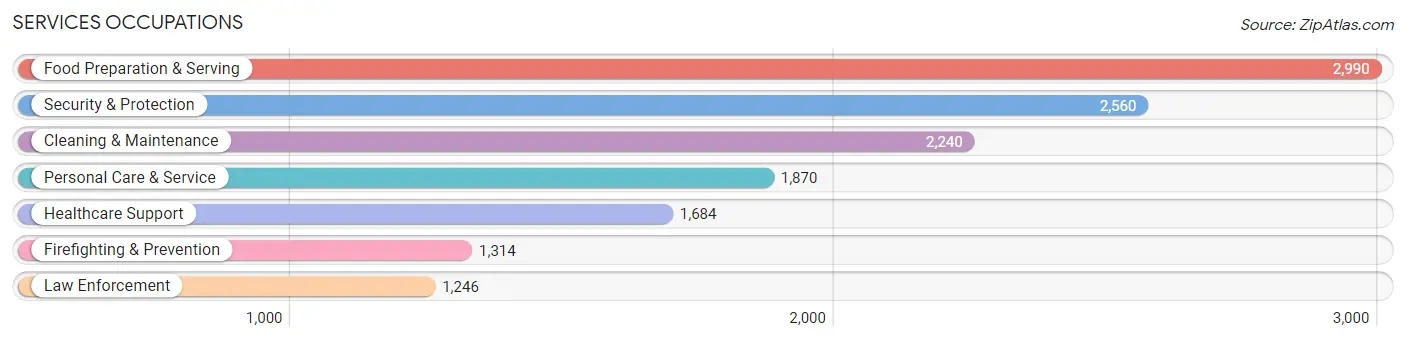
The most common Services occupations in Spotsylvania County are Food Preparation & Serving (2,990 | 4.3%), Security & Protection (2,560 | 3.6%), Cleaning & Maintenance (2,240 | 3.2%), Personal Care & Service (1,870 | 2.7%), and Healthcare Support (1,684 | 2.4%).
Services Occupations by Sex
Within the Services occupations in Spotsylvania County, the most male-oriented occupations are Law Enforcement (84.4%), Security & Protection (80.2%), and Firefighting & Prevention (76.3%), while the most female-oriented occupations are Healthcare Support (86.6%), Personal Care & Service (71.3%), and Food Preparation & Serving (62.1%).
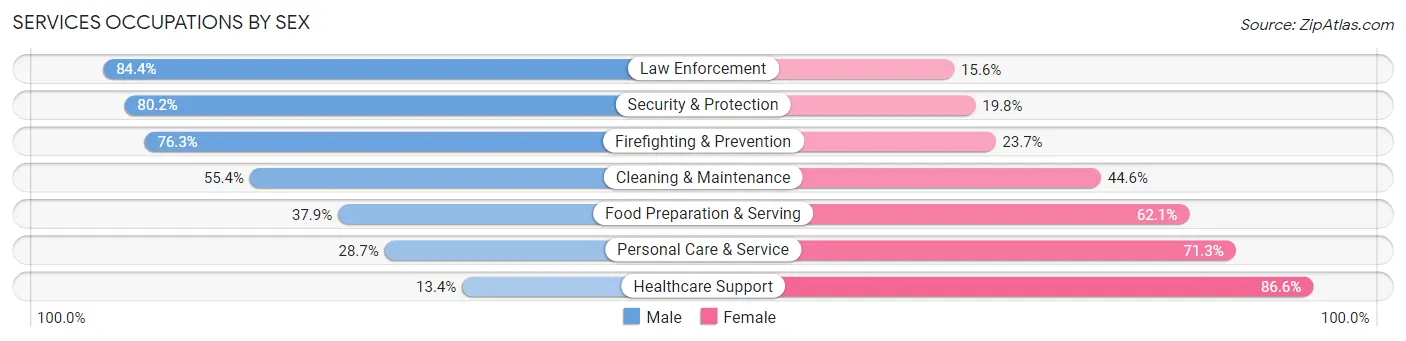
| Occupation | Male | Female |
| Healthcare Support | 225 (13.4%) | 1,459 (86.6%) |
| Security & Protection | 2,054 (80.2%) | 506 (19.8%) |
| Firefighting & Prevention | 1,002 (76.3%) | 312 (23.7%) |
| Law Enforcement | 1,052 (84.4%) | 194 (15.6%) |
| Food Preparation & Serving | 1,134 (37.9%) | 1,856 (62.1%) |
| Cleaning & Maintenance | 1,241 (55.4%) | 999 (44.6%) |
| Personal Care & Service | 537 (28.7%) | 1,333 (71.3%) |
| Total (Category) | 5,191 (45.8%) | 6,153 (54.2%) |
| Total (Overall) | 38,179 (54.3%) | 32,148 (45.7%) |
Sales and Office Occupations
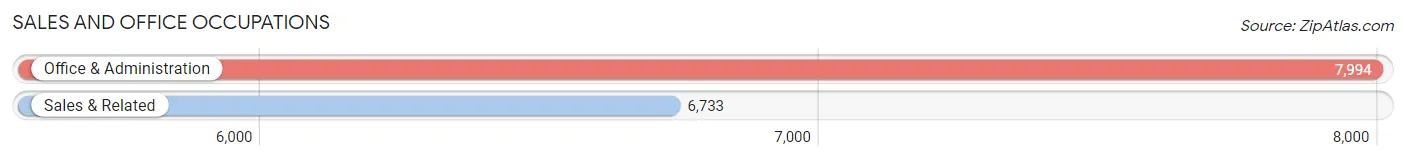
The most common Sales and Office occupations in Spotsylvania County are Office & Administration (7,994 | 11.4%), and Sales & Related (6,733 | 9.6%).
Sales and Office Occupations by Sex
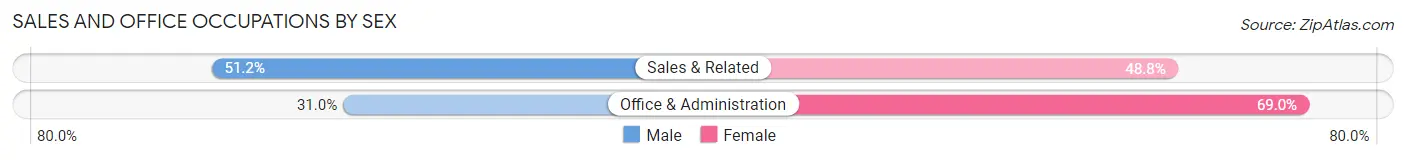
| Occupation | Male | Female |
| Sales & Related | 3,450 (51.2%) | 3,283 (48.8%) |
| Office & Administration | 2,480 (31.0%) | 5,514 (69.0%) |
| Total (Category) | 5,930 (40.3%) | 8,797 (59.7%) |
| Total (Overall) | 38,179 (54.3%) | 32,148 (45.7%) |
Natural Resources, Construction and Maintenance Occupations
The most common Natural Resources, Construction and Maintenance occupations in Spotsylvania County are Construction & Extraction (3,542 | 5.0%), Installation, Maintenance & Repair (2,583 | 3.7%), and Farming, Fishing & Forestry (266 | 0.4%).

Natural Resources, Construction and Maintenance Occupations by Sex
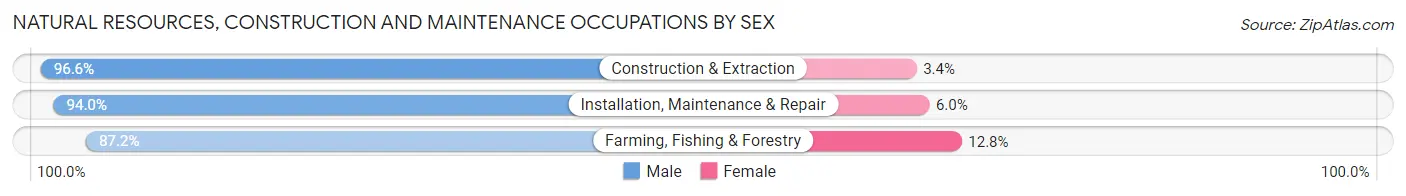
| Occupation | Male | Female |
| Farming, Fishing & Forestry | 232 (87.2%) | 34 (12.8%) |
| Construction & Extraction | 3,422 (96.6%) | 120 (3.4%) |
| Installation, Maintenance & Repair | 2,427 (94.0%) | 156 (6.0%) |
| Total (Category) | 6,081 (95.2%) | 310 (4.9%) |
| Total (Overall) | 38,179 (54.3%) | 32,148 (45.7%) |
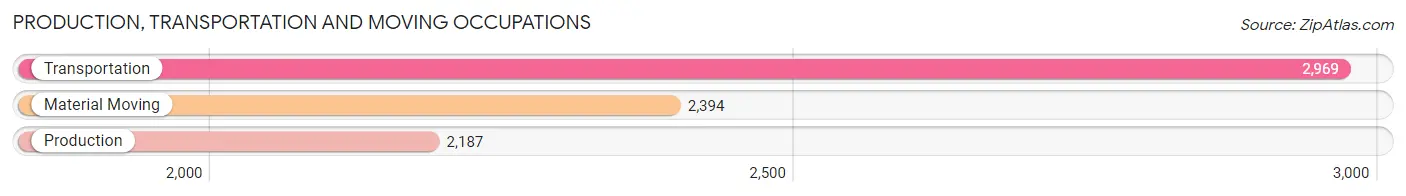
Production, Transportation and Moving Occupations
The most common Production, Transportation and Moving occupations in Spotsylvania County are Transportation (2,969 | 4.2%), Material Moving (2,394 | 3.4%), and Production (2,187 | 3.1%).
Production, Transportation and Moving Occupations by Sex
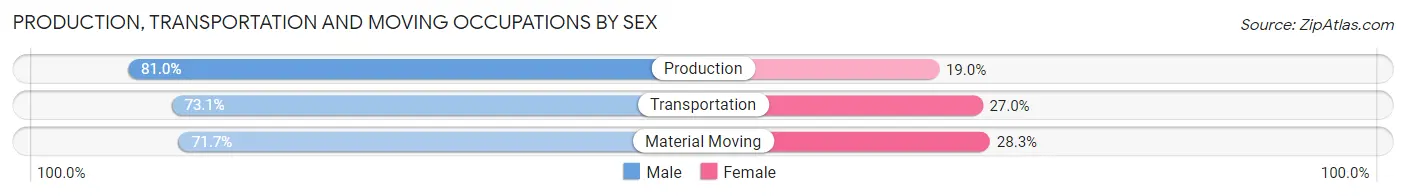
| Occupation | Male | Female |
| Production | 1,772 (81.0%) | 415 (19.0%) |
| Transportation | 2,169 (73.1%) | 800 (27.0%) |
| Material Moving | 1,716 (71.7%) | 678 (28.3%) |
| Total (Category) | 5,657 (74.9%) | 1,893 (25.1%) |
| Total (Overall) | 38,179 (54.3%) | 32,148 (45.7%) |
Employment Industries by Sex in Spotsylvania County
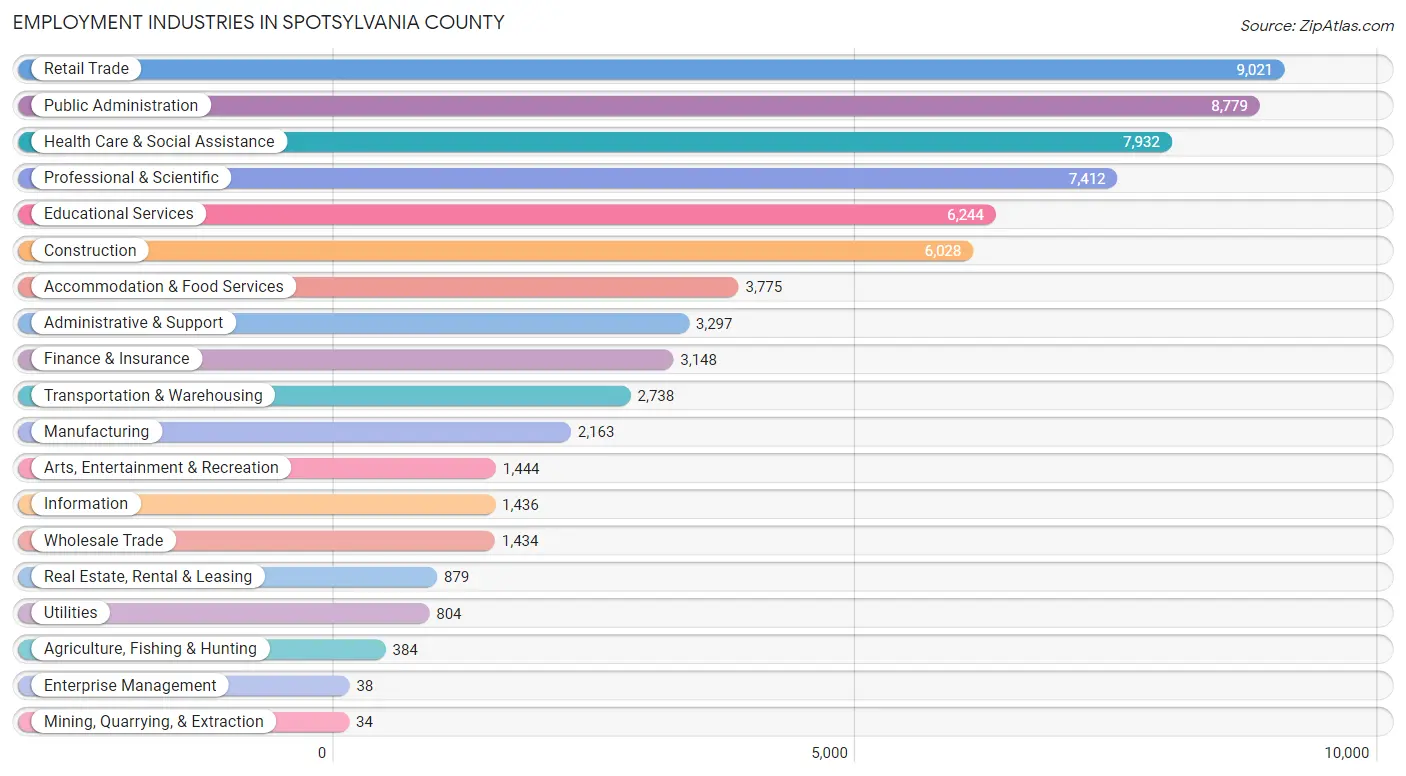
Employment Industries in Spotsylvania County
The major employment industries in Spotsylvania County include Retail Trade (9,021 | 12.8%), Public Administration (8,779 | 12.5%), Health Care & Social Assistance (7,932 | 11.3%), Professional & Scientific (7,412 | 10.5%), and Educational Services (6,244 | 8.9%).
Employment Industries by Sex in Spotsylvania County
The Spotsylvania County industries that see more men than women are Mining, Quarrying, & Extraction (100.0%), Construction (86.7%), and Utilities (86.7%), whereas the industries that tend to have a higher number of women are Health Care & Social Assistance (81.6%), Educational Services (73.8%), and Real Estate, Rental & Leasing (59.7%).
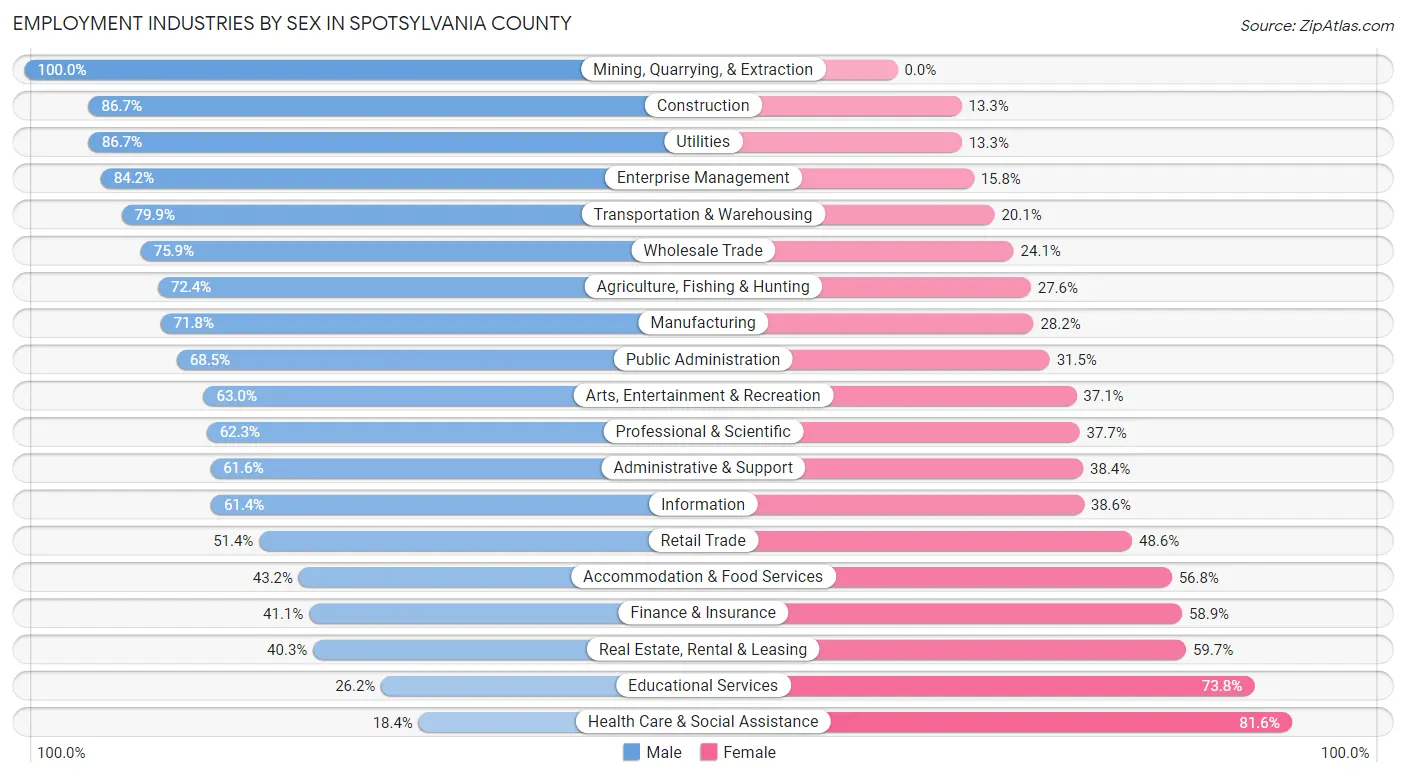
| Industry | Male | Female |
| Agriculture, Fishing & Hunting | 278 (72.4%) | 106 (27.6%) |
| Mining, Quarrying, & Extraction | 34 (100.0%) | 0 (0.0%) |
| Construction | 5,228 (86.7%) | 800 (13.3%) |
| Manufacturing | 1,554 (71.8%) | 609 (28.2%) |
| Wholesale Trade | 1,089 (75.9%) | 345 (24.1%) |
| Retail Trade | 4,640 (51.4%) | 4,381 (48.6%) |
| Transportation & Warehousing | 2,188 (79.9%) | 550 (20.1%) |
| Utilities | 697 (86.7%) | 107 (13.3%) |
| Information | 882 (61.4%) | 554 (38.6%) |
| Finance & Insurance | 1,294 (41.1%) | 1,854 (58.9%) |
| Real Estate, Rental & Leasing | 354 (40.3%) | 525 (59.7%) |
| Professional & Scientific | 4,618 (62.3%) | 2,794 (37.7%) |
| Enterprise Management | 32 (84.2%) | 6 (15.8%) |
| Administrative & Support | 2,030 (61.6%) | 1,267 (38.4%) |
| Educational Services | 1,635 (26.2%) | 4,609 (73.8%) |
| Health Care & Social Assistance | 1,462 (18.4%) | 6,470 (81.6%) |
| Arts, Entertainment & Recreation | 909 (62.9%) | 535 (37.0%) |
| Accommodation & Food Services | 1,632 (43.2%) | 2,143 (56.8%) |
| Public Administration | 6,012 (68.5%) | 2,767 (31.5%) |
| Total | 38,179 (54.3%) | 32,148 (45.7%) |
Education in Spotsylvania County
School Enrollment in Spotsylvania County
The most common levels of schooling among the 35,407 students in Spotsylvania County are high school (8,916 | 25.2%), middle school (8,314 | 23.5%), and elementary school (7,125 | 20.1%).
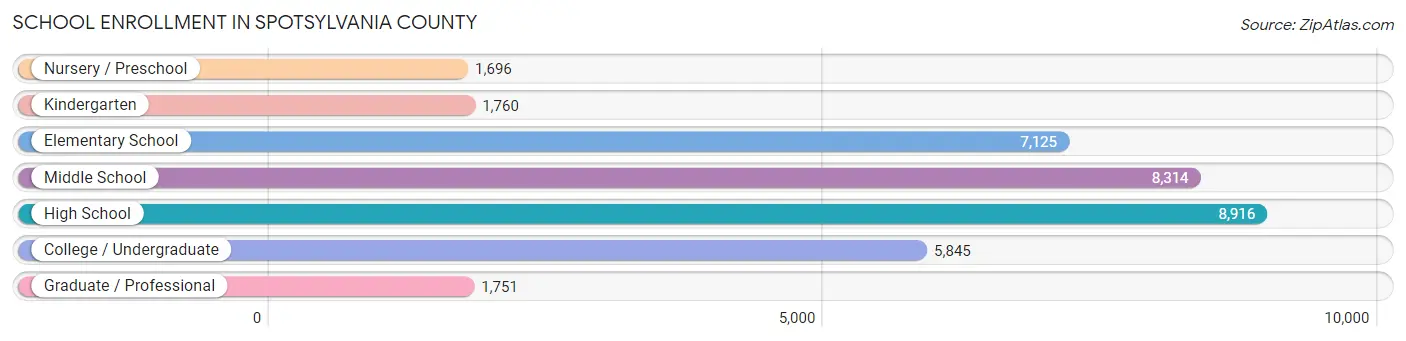
| School Level | # Students | % Students |
| Nursery / Preschool | 1,696 | 4.8% |
| Kindergarten | 1,760 | 5.0% |
| Elementary School | 7,125 | 20.1% |
| Middle School | 8,314 | 23.5% |
| High School | 8,916 | 25.2% |
| College / Undergraduate | 5,845 | 16.5% |
| Graduate / Professional | 1,751 | 5.0% |
| Total | 35,407 | 100.0% |
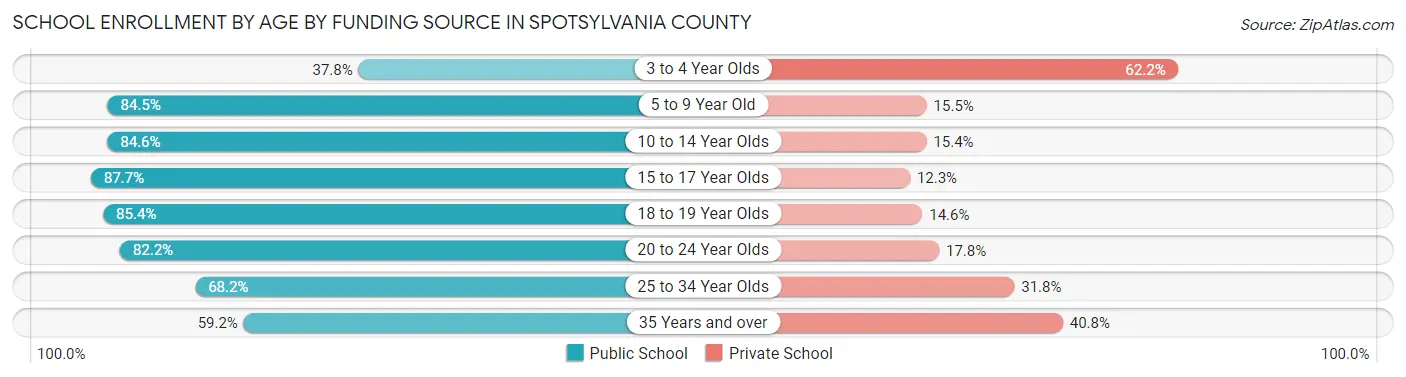
School Enrollment by Age by Funding Source in Spotsylvania County
Out of a total of 35,407 students who are enrolled in schools in Spotsylvania County, 6,692 (18.9%) attend a private institution, while the remaining 28,715 (81.1%) are enrolled in public schools. The age group of 3 to 4 year olds has the highest likelihood of being enrolled in private schools, with 775 (62.2% in the age bracket) enrolled. Conversely, the age group of 15 to 17 year olds has the lowest likelihood of being enrolled in a private school, with 5,542 (87.7% in the age bracket) attending a public institution.
| Age Bracket | Public School | Private School |
| 3 to 4 Year Olds | 471 (37.8%) | 775 (62.2%) |
| 5 to 9 Year Old | 7,216 (84.5%) | 1,320 (15.5%) |
| 10 to 14 Year Olds | 8,758 (84.6%) | 1,597 (15.4%) |
| 15 to 17 Year Olds | 5,542 (87.7%) | 780 (12.3%) |
| 18 to 19 Year Olds | 2,123 (85.4%) | 364 (14.6%) |
| 20 to 24 Year Olds | 2,191 (82.2%) | 473 (17.8%) |
| 25 to 34 Year Olds | 1,213 (68.2%) | 565 (31.8%) |
| 35 Years and over | 1,195 (59.2%) | 824 (40.8%) |
| Total | 28,715 (81.1%) | 6,692 (18.9%) |
Educational Attainment by Field of Study in Spotsylvania County
Business (7,090 | 20.7%), education (3,595 | 10.5%), social sciences (2,979 | 8.7%), computers & mathematics (2,547 | 7.4%), and science & technology (2,490 | 7.3%) are the most common fields of study among 34,181 individuals in Spotsylvania County who have obtained a bachelor's degree or higher.
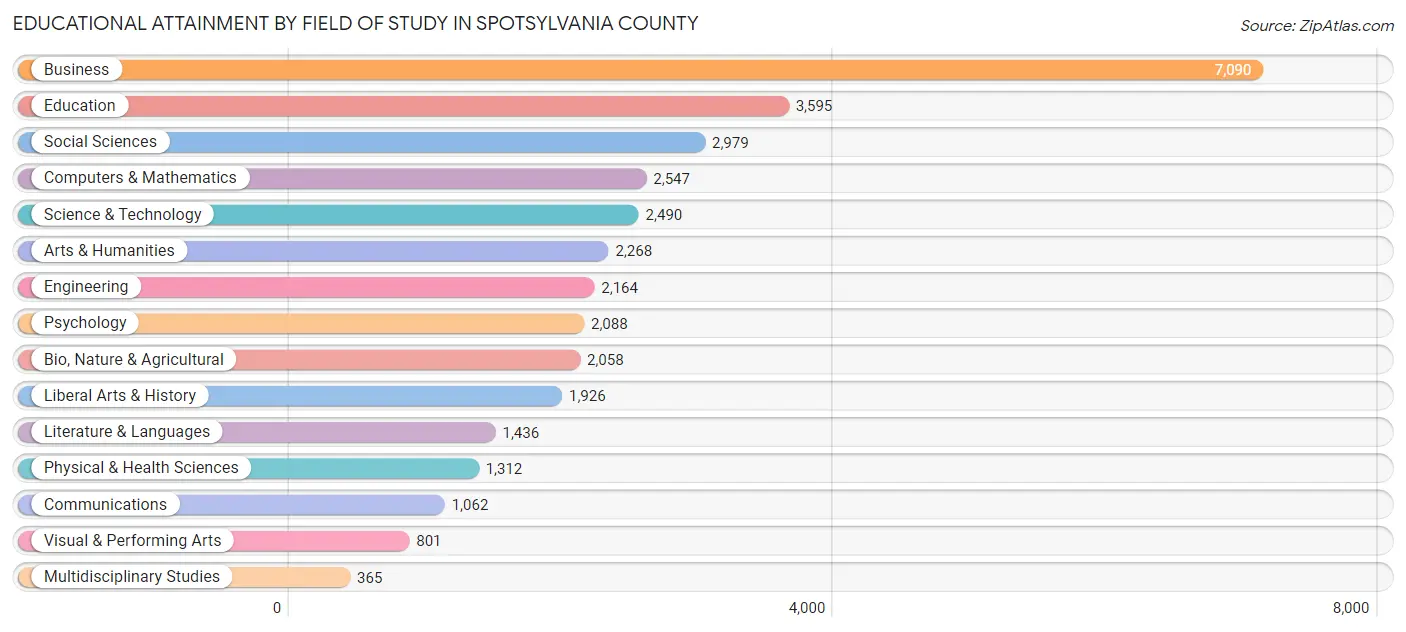
| Field of Study | # Graduates | % Graduates |
| Computers & Mathematics | 2,547 | 7.4% |
| Bio, Nature & Agricultural | 2,058 | 6.0% |
| Physical & Health Sciences | 1,312 | 3.8% |
| Psychology | 2,088 | 6.1% |
| Social Sciences | 2,979 | 8.7% |
| Engineering | 2,164 | 6.3% |
| Multidisciplinary Studies | 365 | 1.1% |
| Science & Technology | 2,490 | 7.3% |
| Business | 7,090 | 20.7% |
| Education | 3,595 | 10.5% |
| Literature & Languages | 1,436 | 4.2% |
| Liberal Arts & History | 1,926 | 5.6% |
| Visual & Performing Arts | 801 | 2.3% |
| Communications | 1,062 | 3.1% |
| Arts & Humanities | 2,268 | 6.6% |
| Total | 34,181 | 100.0% |
Transportation & Commute in Spotsylvania County
Vehicle Availability by Sex in Spotsylvania County
The most prevalent vehicle ownership categories in Spotsylvania County are males with 2 vehicles (13,954, accounting for 36.5%) and females with 2 vehicles (12,120, making up 44.4%).
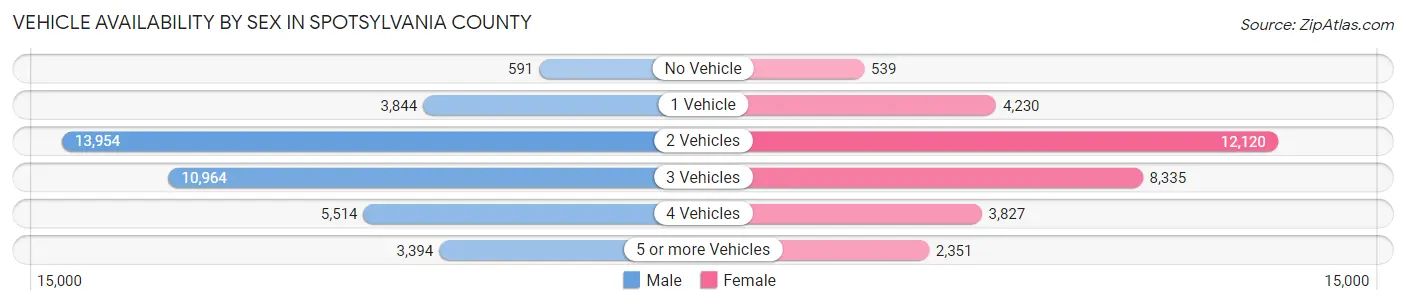
| Vehicles Available | Male | Female |
| No Vehicle | 591 (1.5%) | 539 (1.7%) |
| 1 Vehicle | 3,844 (10.1%) | 4,230 (13.5%) |
| 2 Vehicles | 13,954 (36.5%) | 12,120 (38.6%) |
| 3 Vehicles | 10,964 (28.7%) | 8,335 (26.5%) |
| 4 Vehicles | 5,514 (14.4%) | 3,827 (12.2%) |
| 5 or more Vehicles | 3,394 (8.9%) | 2,351 (7.5%) |
| Total | 38,261 (100.0%) | 31,402 (100.0%) |
Commute Time in Spotsylvania County
The most frequently occuring commute durations in Spotsylvania County are 60 to 89 minutes (9,453 commuters, 15.5%), 15 to 19 minutes (8,959 commuters, 14.7%), and 20 to 24 minutes (8,173 commuters, 13.4%).
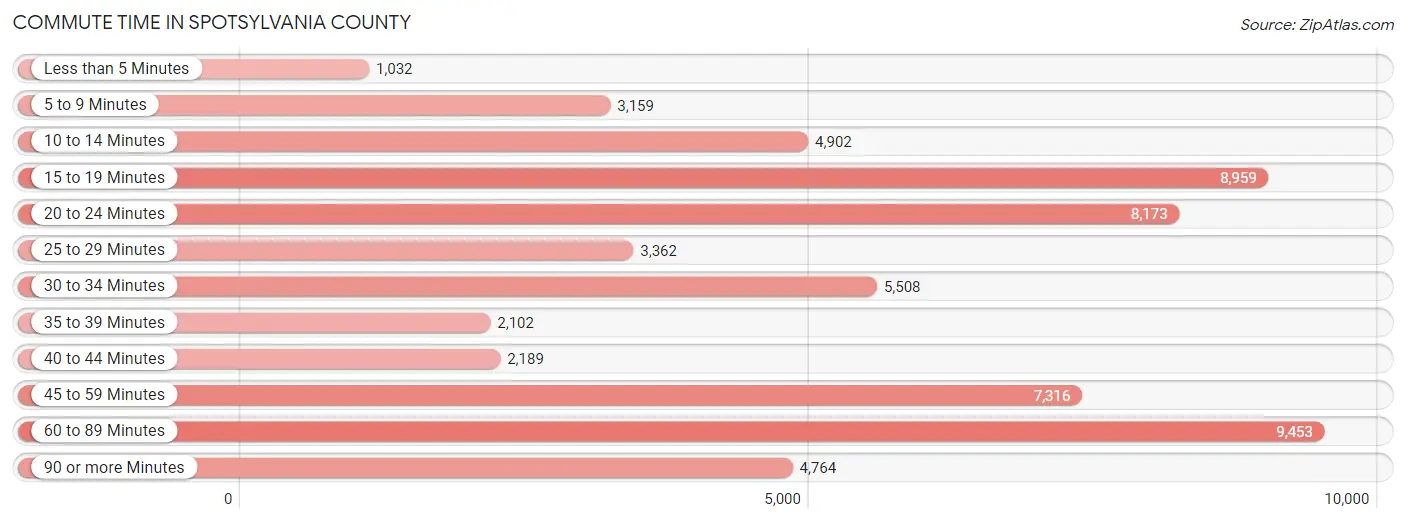
| Commute Time | # Commuters | % Commuters |
| Less than 5 Minutes | 1,032 | 1.7% |
| 5 to 9 Minutes | 3,159 | 5.2% |
| 10 to 14 Minutes | 4,902 | 8.1% |
| 15 to 19 Minutes | 8,959 | 14.7% |
| 20 to 24 Minutes | 8,173 | 13.4% |
| 25 to 29 Minutes | 3,362 | 5.5% |
| 30 to 34 Minutes | 5,508 | 9.0% |
| 35 to 39 Minutes | 2,102 | 3.5% |
| 40 to 44 Minutes | 2,189 | 3.6% |
| 45 to 59 Minutes | 7,316 | 12.0% |
| 60 to 89 Minutes | 9,453 | 15.5% |
| 90 or more Minutes | 4,764 | 7.8% |
Commute Time by Sex in Spotsylvania County
The most common commute times in Spotsylvania County are 60 to 89 minutes (6,645 commuters, 19.6%) for males and 15 to 19 minutes (5,055 commuters, 18.7%) for females.
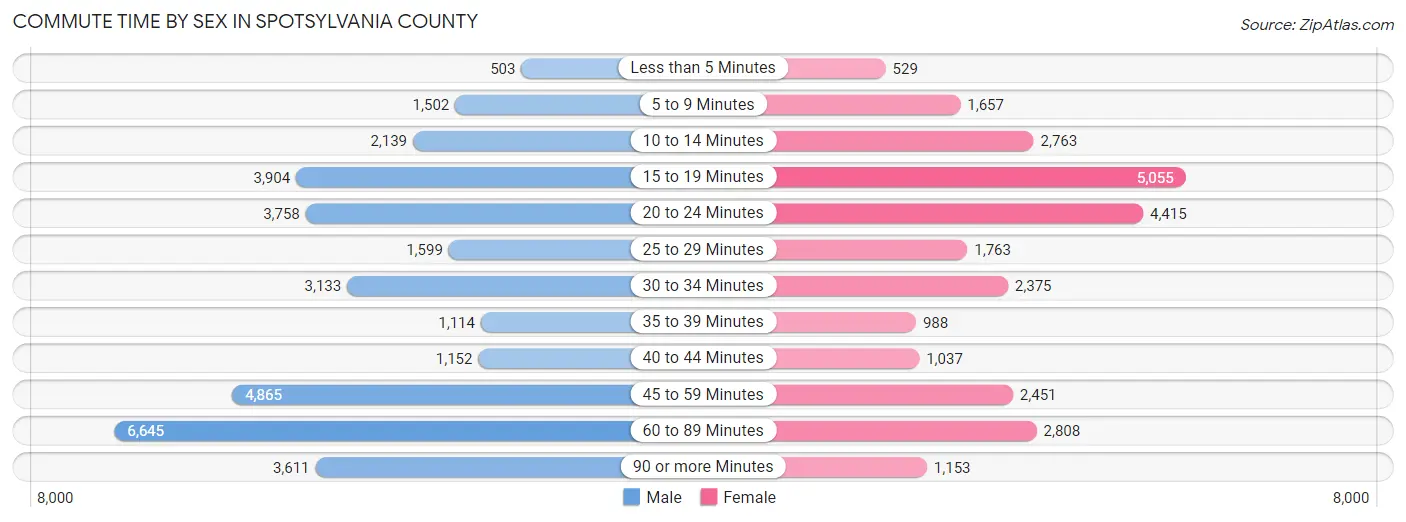
| Commute Time | Male | Female |
| Less than 5 Minutes | 503 (1.5%) | 529 (2.0%) |
| 5 to 9 Minutes | 1,502 (4.4%) | 1,657 (6.1%) |
| 10 to 14 Minutes | 2,139 (6.3%) | 2,763 (10.2%) |
| 15 to 19 Minutes | 3,904 (11.5%) | 5,055 (18.7%) |
| 20 to 24 Minutes | 3,758 (11.1%) | 4,415 (16.4%) |
| 25 to 29 Minutes | 1,599 (4.7%) | 1,763 (6.5%) |
| 30 to 34 Minutes | 3,133 (9.2%) | 2,375 (8.8%) |
| 35 to 39 Minutes | 1,114 (3.3%) | 988 (3.7%) |
| 40 to 44 Minutes | 1,152 (3.4%) | 1,037 (3.8%) |
| 45 to 59 Minutes | 4,865 (14.3%) | 2,451 (9.1%) |
| 60 to 89 Minutes | 6,645 (19.6%) | 2,808 (10.4%) |
| 90 or more Minutes | 3,611 (10.6%) | 1,153 (4.3%) |
Time of Departure to Work by Sex in Spotsylvania County
The most frequent times of departure to work in Spotsylvania County are 12:00 AM to 4:59 AM (4,682, 13.8%) for males and 7:00 AM to 7:29 AM (4,037, 15.0%) for females.
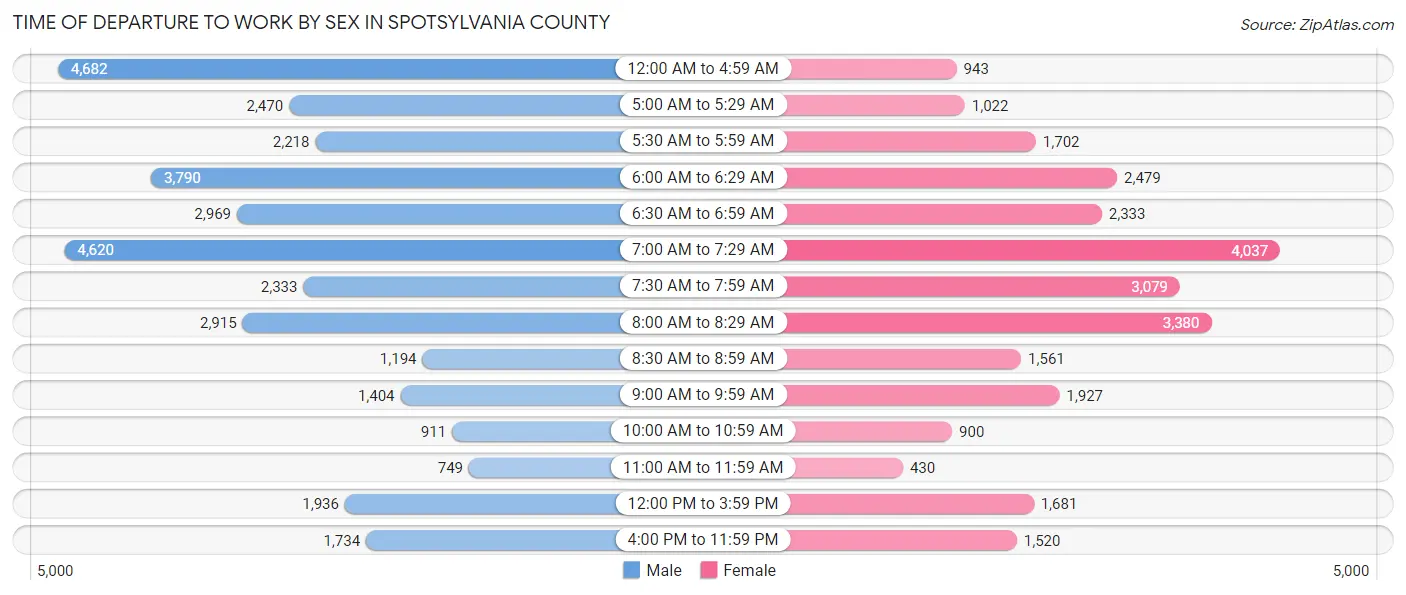
| Time of Departure | Male | Female |
| 12:00 AM to 4:59 AM | 4,682 (13.8%) | 943 (3.5%) |
| 5:00 AM to 5:29 AM | 2,470 (7.3%) | 1,022 (3.8%) |
| 5:30 AM to 5:59 AM | 2,218 (6.5%) | 1,702 (6.3%) |
| 6:00 AM to 6:29 AM | 3,790 (11.2%) | 2,479 (9.2%) |
| 6:30 AM to 6:59 AM | 2,969 (8.7%) | 2,333 (8.6%) |
| 7:00 AM to 7:29 AM | 4,620 (13.6%) | 4,037 (15.0%) |
| 7:30 AM to 7:59 AM | 2,333 (6.9%) | 3,079 (11.4%) |
| 8:00 AM to 8:29 AM | 2,915 (8.6%) | 3,380 (12.5%) |
| 8:30 AM to 8:59 AM | 1,194 (3.5%) | 1,561 (5.8%) |
| 9:00 AM to 9:59 AM | 1,404 (4.1%) | 1,927 (7.1%) |
| 10:00 AM to 10:59 AM | 911 (2.7%) | 900 (3.3%) |
| 11:00 AM to 11:59 AM | 749 (2.2%) | 430 (1.6%) |
| 12:00 PM to 3:59 PM | 1,936 (5.7%) | 1,681 (6.2%) |
| 4:00 PM to 11:59 PM | 1,734 (5.1%) | 1,520 (5.6%) |
| Total | 33,925 (100.0%) | 26,994 (100.0%) |
Housing Occupancy in Spotsylvania County
Occupancy by Ownership in Spotsylvania County
Of the total 49,449 dwellings in Spotsylvania County, owner-occupied units account for 39,018 (78.9%), while renter-occupied units make up 10,431 (21.1%).
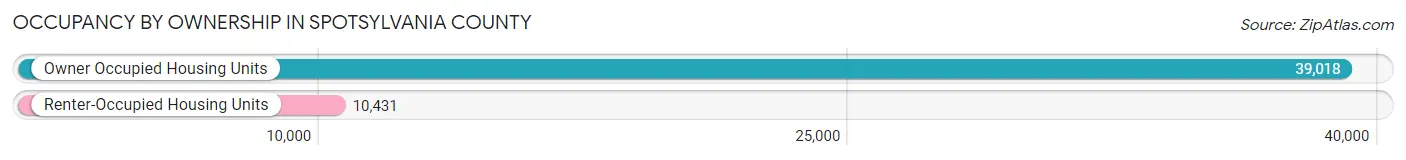
| Occupancy | # Housing Units | % Housing Units |
| Owner Occupied Housing Units | 39,018 | 78.9% |
| Renter-Occupied Housing Units | 10,431 | 21.1% |
| Total Occupied Housing Units | 49,449 | 100.0% |
Occupancy by Household Size in Spotsylvania County
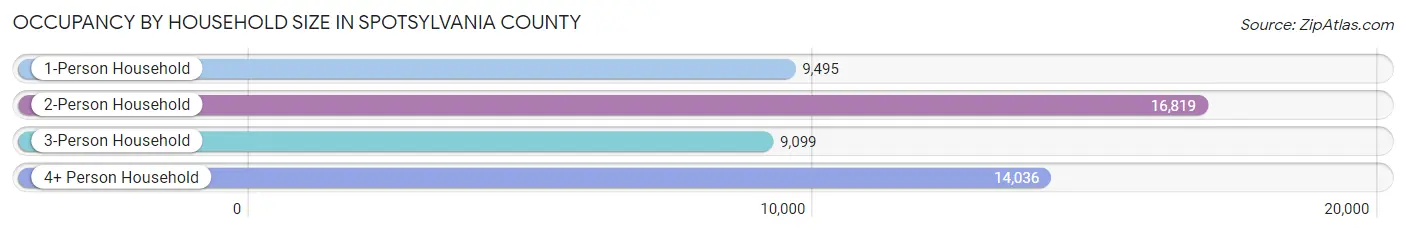
| Household Size | # Housing Units | % Housing Units |
| 1-Person Household | 9,495 | 19.2% |
| 2-Person Household | 16,819 | 34.0% |
| 3-Person Household | 9,099 | 18.4% |
| 4+ Person Household | 14,036 | 28.4% |
| Total Housing Units | 49,449 | 100.0% |
Occupancy by Ownership by Household Size in Spotsylvania County
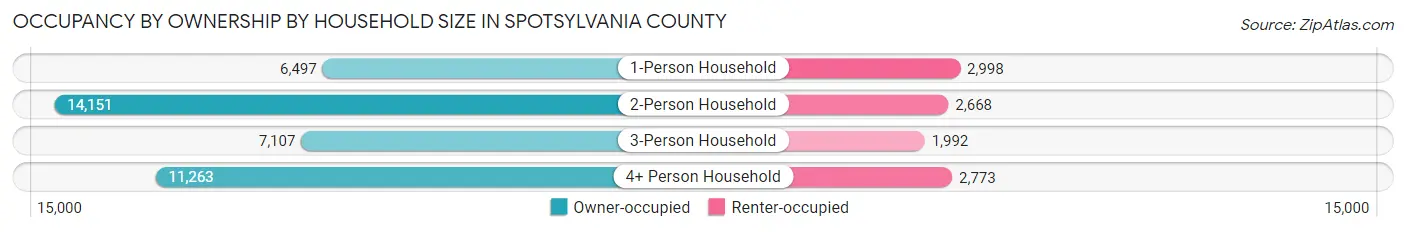
| Household Size | Owner-occupied | Renter-occupied |
| 1-Person Household | 6,497 (68.4%) | 2,998 (31.6%) |
| 2-Person Household | 14,151 (84.1%) | 2,668 (15.9%) |
| 3-Person Household | 7,107 (78.1%) | 1,992 (21.9%) |
| 4+ Person Household | 11,263 (80.2%) | 2,773 (19.8%) |
| Total Housing Units | 39,018 (78.9%) | 10,431 (21.1%) |
Occupancy by Educational Attainment in Spotsylvania County
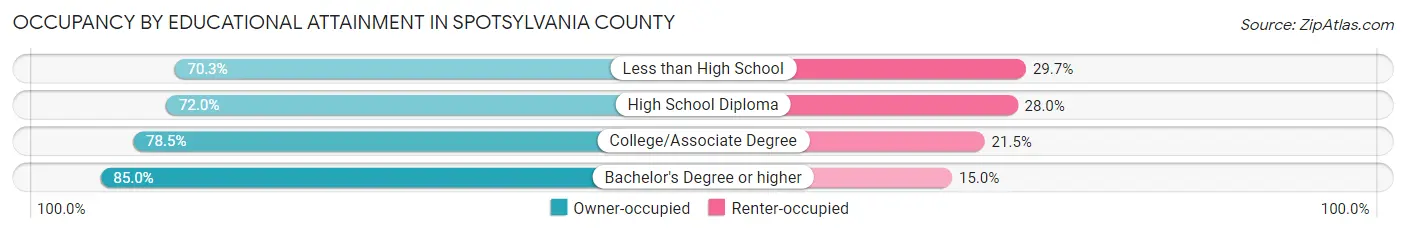
| Household Size | Owner-occupied | Renter-occupied |
| Less than High School | 2,639 (70.3%) | 1,115 (29.7%) |
| High School Diploma | 8,115 (72.0%) | 3,162 (28.0%) |
| College/Associate Degree | 11,856 (78.5%) | 3,250 (21.5%) |
| Bachelor's Degree or higher | 16,408 (85.0%) | 2,904 (15.0%) |
Occupancy by Age of Householder in Spotsylvania County
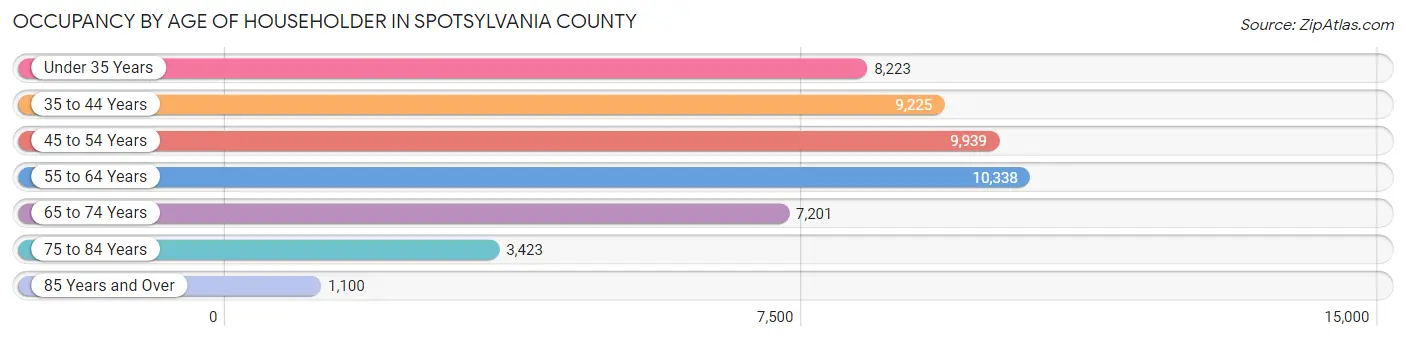
| Age Bracket | # Households | % Households |
| Under 35 Years | 8,223 | 16.6% |
| 35 to 44 Years | 9,225 | 18.7% |
| 45 to 54 Years | 9,939 | 20.1% |
| 55 to 64 Years | 10,338 | 20.9% |
| 65 to 74 Years | 7,201 | 14.6% |
| 75 to 84 Years | 3,423 | 6.9% |
| 85 Years and Over | 1,100 | 2.2% |
| Total | 49,449 | 100.0% |
Housing Finances in Spotsylvania County
Median Income by Occupancy in Spotsylvania County
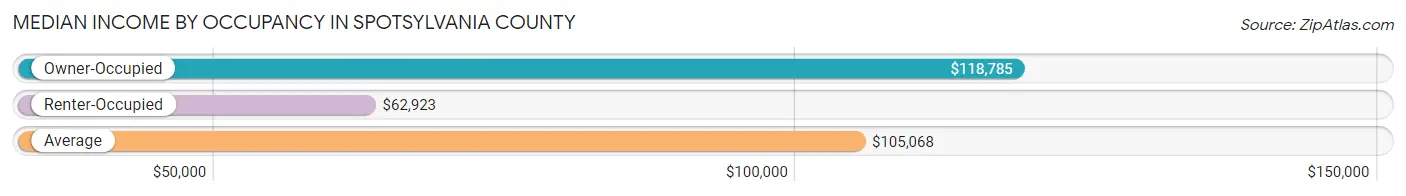
| Occupancy Type | # Households | Median Income |
| Owner-Occupied | 39,018 (78.9%) | $118,785 |
| Renter-Occupied | 10,431 (21.1%) | $62,923 |
| Average | 49,449 (100.0%) | $105,068 |
Occupancy by Householder Income Bracket in Spotsylvania County
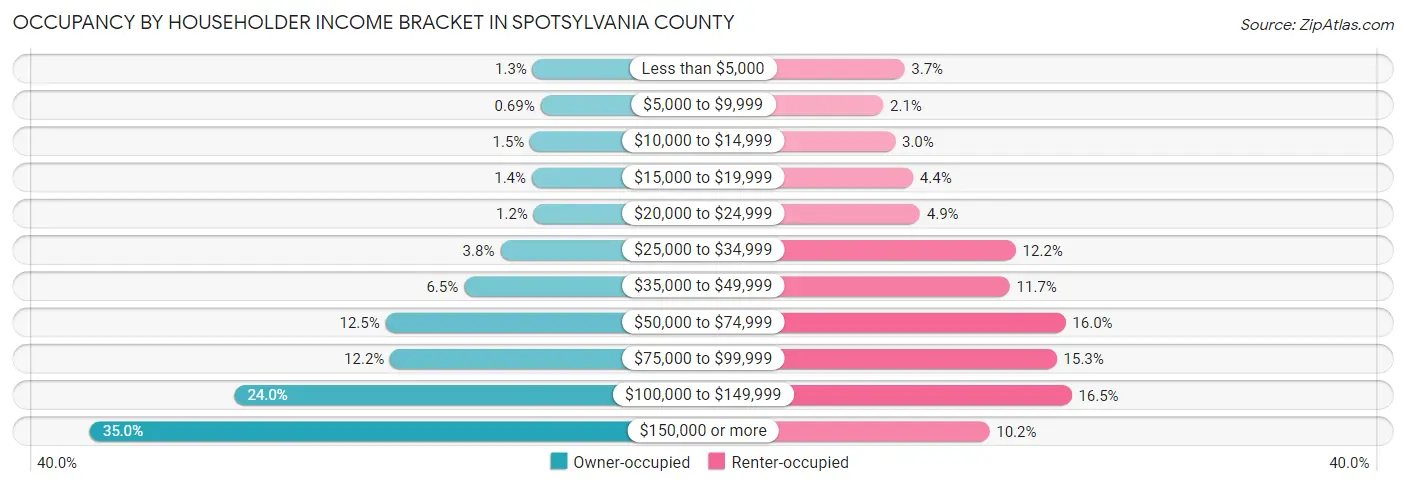
| Income Bracket | Owner-occupied | Renter-occupied |
| Less than $5,000 | 502 (1.3%) | 388 (3.7%) |
| $5,000 to $9,999 | 271 (0.7%) | 219 (2.1%) |
| $10,000 to $14,999 | 579 (1.5%) | 314 (3.0%) |
| $15,000 to $19,999 | 527 (1.3%) | 456 (4.4%) |
| $20,000 to $24,999 | 471 (1.2%) | 511 (4.9%) |
| $25,000 to $34,999 | 1,467 (3.8%) | 1,273 (12.2%) |
| $35,000 to $49,999 | 2,544 (6.5%) | 1,225 (11.7%) |
| $50,000 to $74,999 | 4,876 (12.5%) | 1,668 (16.0%) |
| $75,000 to $99,999 | 4,742 (12.1%) | 1,598 (15.3%) |
| $100,000 to $149,999 | 9,370 (24.0%) | 1,716 (16.5%) |
| $150,000 or more | 13,669 (35.0%) | 1,063 (10.2%) |
| Total | 39,018 (100.0%) | 10,431 (100.0%) |
Monthly Housing Cost Tiers in Spotsylvania County
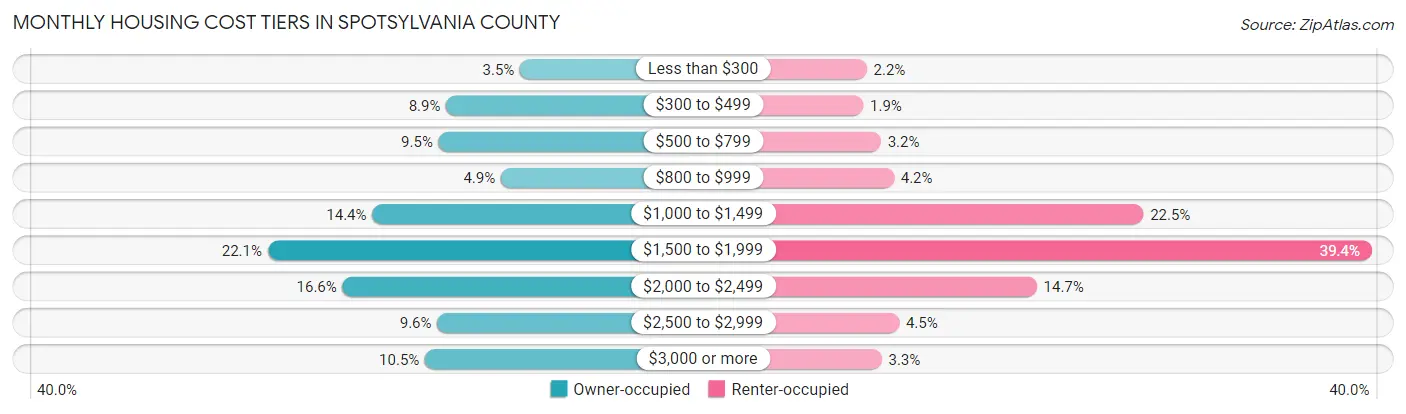
| Monthly Cost | Owner-occupied | Renter-occupied |
| Less than $300 | 1,364 (3.5%) | 224 (2.1%) |
| $300 to $499 | 3,487 (8.9%) | 197 (1.9%) |
| $500 to $799 | 3,706 (9.5%) | 333 (3.2%) |
| $800 to $999 | 1,916 (4.9%) | 433 (4.2%) |
| $1,000 to $1,499 | 5,613 (14.4%) | 2,349 (22.5%) |
| $1,500 to $1,999 | 8,621 (22.1%) | 4,105 (39.4%) |
| $2,000 to $2,499 | 6,470 (16.6%) | 1,530 (14.7%) |
| $2,500 to $2,999 | 3,745 (9.6%) | 473 (4.5%) |
| $3,000 or more | 4,096 (10.5%) | 339 (3.3%) |
| Total | 39,018 (100.0%) | 10,431 (100.0%) |
Physical Housing Characteristics in Spotsylvania County
Housing Structures in Spotsylvania County
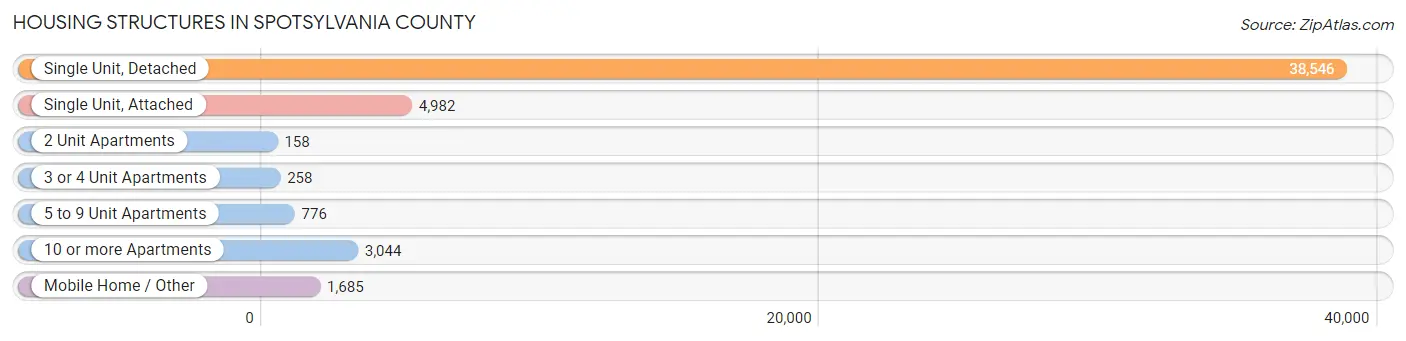
| Structure Type | # Housing Units | % Housing Units |
| Single Unit, Detached | 38,546 | 77.9% |
| Single Unit, Attached | 4,982 | 10.1% |
| 2 Unit Apartments | 158 | 0.3% |
| 3 or 4 Unit Apartments | 258 | 0.5% |
| 5 to 9 Unit Apartments | 776 | 1.6% |
| 10 or more Apartments | 3,044 | 6.2% |
| Mobile Home / Other | 1,685 | 3.4% |
| Total | 49,449 | 100.0% |
Housing Structures by Occupancy in Spotsylvania County
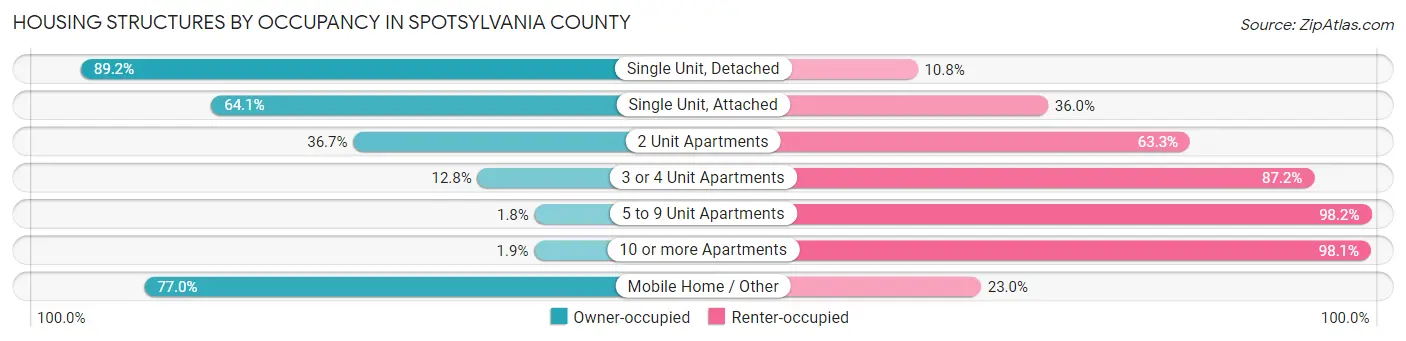
| Structure Type | Owner-occupied | Renter-occupied |
| Single Unit, Detached | 34,368 (89.2%) | 4,178 (10.8%) |
| Single Unit, Attached | 3,191 (64.0%) | 1,791 (35.9%) |
| 2 Unit Apartments | 58 (36.7%) | 100 (63.3%) |
| 3 or 4 Unit Apartments | 33 (12.8%) | 225 (87.2%) |
| 5 to 9 Unit Apartments | 14 (1.8%) | 762 (98.2%) |
| 10 or more Apartments | 57 (1.9%) | 2,987 (98.1%) |
| Mobile Home / Other | 1,297 (77.0%) | 388 (23.0%) |
| Total | 39,018 (78.9%) | 10,431 (21.1%) |
Housing Structures by Number of Rooms in Spotsylvania County
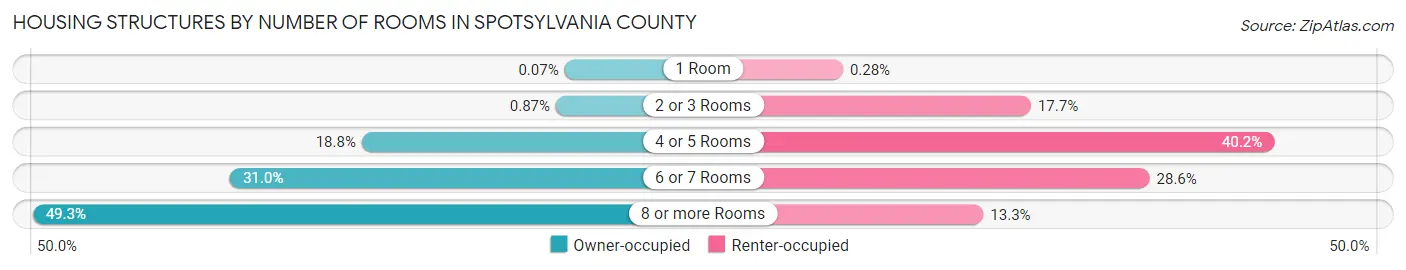
| Number of Rooms | Owner-occupied | Renter-occupied |
| 1 Room | 26 (0.1%) | 29 (0.3%) |
| 2 or 3 Rooms | 338 (0.9%) | 1,843 (17.7%) |
| 4 or 5 Rooms | 7,343 (18.8%) | 4,188 (40.2%) |
| 6 or 7 Rooms | 12,094 (31.0%) | 2,987 (28.6%) |
| 8 or more Rooms | 19,217 (49.2%) | 1,384 (13.3%) |
| Total | 39,018 (100.0%) | 10,431 (100.0%) |
Housing Structure by Heating Type in Spotsylvania County
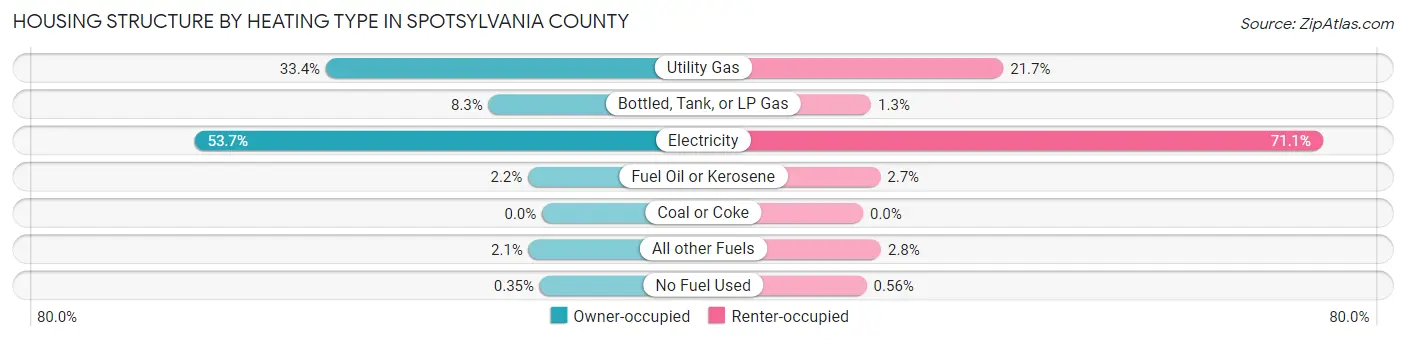
| Heating Type | Owner-occupied | Renter-occupied |
| Utility Gas | 13,039 (33.4%) | 2,261 (21.7%) |
| Bottled, Tank, or LP Gas | 3,228 (8.3%) | 130 (1.3%) |
| Electricity | 20,960 (53.7%) | 7,414 (71.1%) |
| Fuel Oil or Kerosene | 842 (2.2%) | 278 (2.7%) |
| Coal or Coke | 0 (0.0%) | 0 (0.0%) |
| All other Fuels | 811 (2.1%) | 290 (2.8%) |
| No Fuel Used | 138 (0.4%) | 58 (0.6%) |
| Total | 39,018 (100.0%) | 10,431 (100.0%) |
Household Vehicle Usage in Spotsylvania County
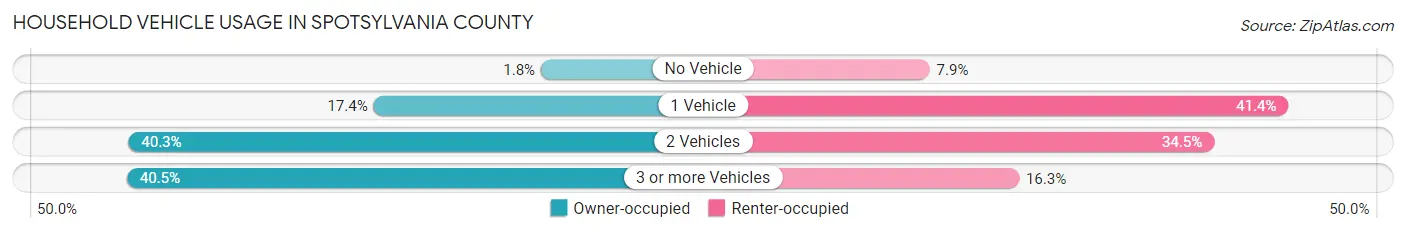
| Vehicles per Household | Owner-occupied | Renter-occupied |
| No Vehicle | 703 (1.8%) | 825 (7.9%) |
| 1 Vehicle | 6,800 (17.4%) | 4,317 (41.4%) |
| 2 Vehicles | 15,730 (40.3%) | 3,594 (34.4%) |
| 3 or more Vehicles | 15,785 (40.5%) | 1,695 (16.3%) |
| Total | 39,018 (100.0%) | 10,431 (100.0%) |
Real Estate & Mortgages in Spotsylvania County
Real Estate and Mortgage Overview in Spotsylvania County
| Characteristic | Without Mortgage | With Mortgage |
| Housing Units | 9,548 | 29,470 |
| Median Property Value | $323,100 | $356,400 |
| Median Household Income | $88,025 | $11,477 |
| Monthly Housing Costs | $502 | $4,040 |
| Real Estate Taxes | $2,058 | $777 |
Property Value by Mortgage Status in Spotsylvania County
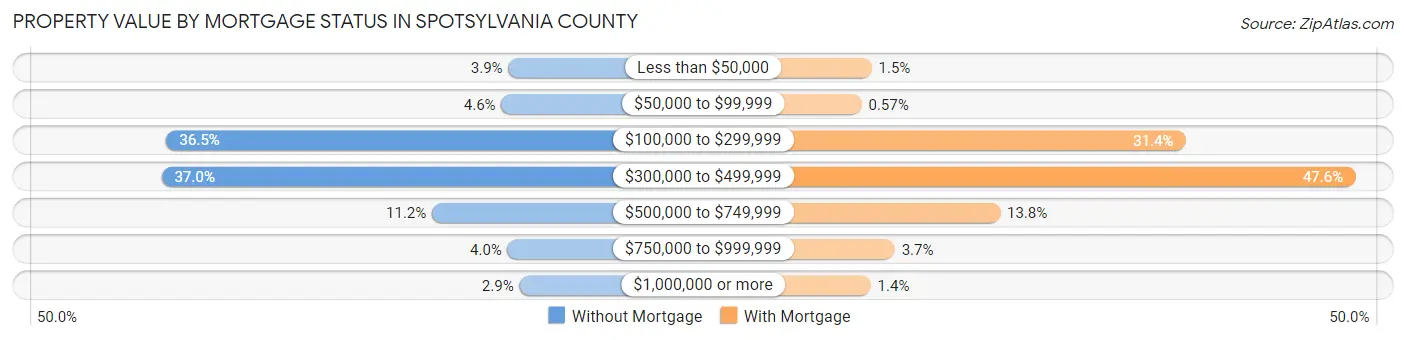
| Property Value | Without Mortgage | With Mortgage |
| Less than $50,000 | 374 (3.9%) | 451 (1.5%) |
| $50,000 to $99,999 | 438 (4.6%) | 168 (0.6%) |
| $100,000 to $299,999 | 3,484 (36.5%) | 9,256 (31.4%) |
| $300,000 to $499,999 | 3,529 (37.0%) | 14,016 (47.6%) |
| $500,000 to $749,999 | 1,068 (11.2%) | 4,056 (13.8%) |
| $750,000 to $999,999 | 381 (4.0%) | 1,100 (3.7%) |
| $1,000,000 or more | 274 (2.9%) | 423 (1.4%) |
| Total | 9,548 (100.0%) | 29,470 (100.0%) |
Household Income by Mortgage Status in Spotsylvania County
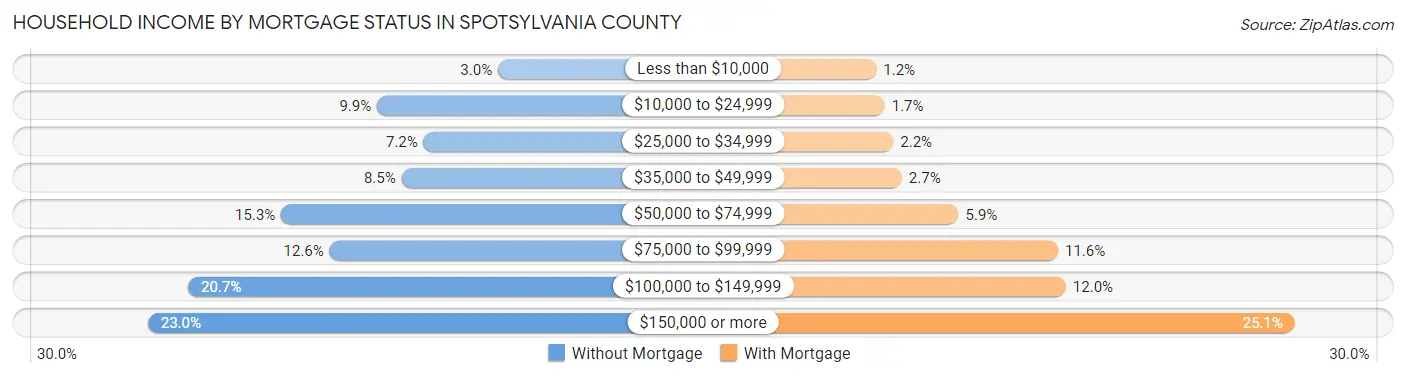
| Household Income | Without Mortgage | With Mortgage |
| Less than $10,000 | 282 (2.9%) | 352 (1.2%) |
| $10,000 to $24,999 | 941 (9.9%) | 491 (1.7%) |
| $25,000 to $34,999 | 687 (7.2%) | 636 (2.2%) |
| $35,000 to $49,999 | 808 (8.5%) | 780 (2.6%) |
| $50,000 to $74,999 | 1,465 (15.3%) | 1,736 (5.9%) |
| $75,000 to $99,999 | 1,200 (12.6%) | 3,411 (11.6%) |
| $100,000 to $149,999 | 1,973 (20.7%) | 3,542 (12.0%) |
| $150,000 or more | 2,192 (23.0%) | 7,397 (25.1%) |
| Total | 9,548 (100.0%) | 29,470 (100.0%) |
Property Value to Household Income Ratio in Spotsylvania County
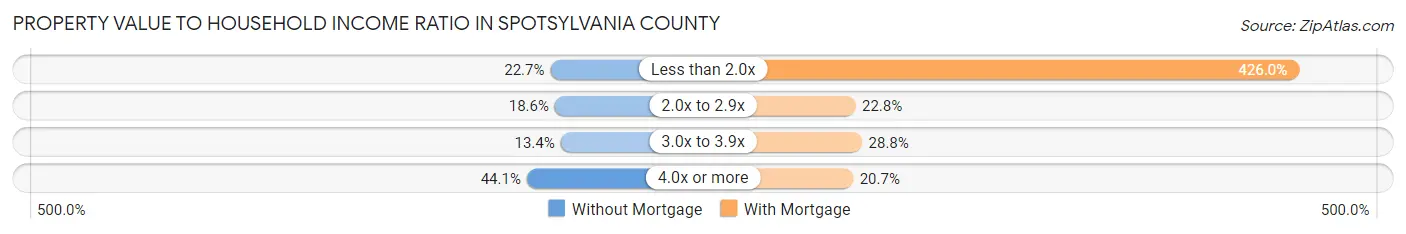
| Value-to-Income Ratio | Without Mortgage | With Mortgage |
| Less than 2.0x | 2,164 (22.7%) | 125,542 (426.0%) |
| 2.0x to 2.9x | 1,772 (18.6%) | 6,715 (22.8%) |
| 3.0x to 3.9x | 1,277 (13.4%) | 8,488 (28.8%) |
| 4.0x or more | 4,206 (44.1%) | 6,107 (20.7%) |
| Total | 9,548 (100.0%) | 29,470 (100.0%) |
Real Estate Taxes by Mortgage Status in Spotsylvania County
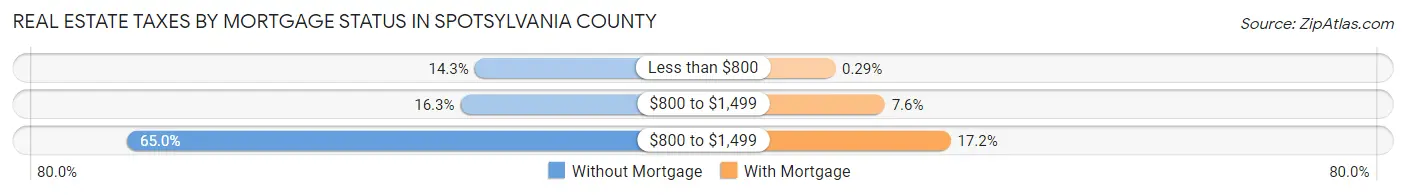
| Property Taxes | Without Mortgage | With Mortgage |
| Less than $800 | 1,361 (14.2%) | 85 (0.3%) |
| $800 to $1,499 | 1,559 (16.3%) | 2,225 (7.5%) |
| $800 to $1,499 | 6,208 (65.0%) | 5,057 (17.2%) |
| Total | 9,548 (100.0%) | 29,470 (100.0%) |
Health & Disability in Spotsylvania County
Health Insurance Coverage by Age in Spotsylvania County
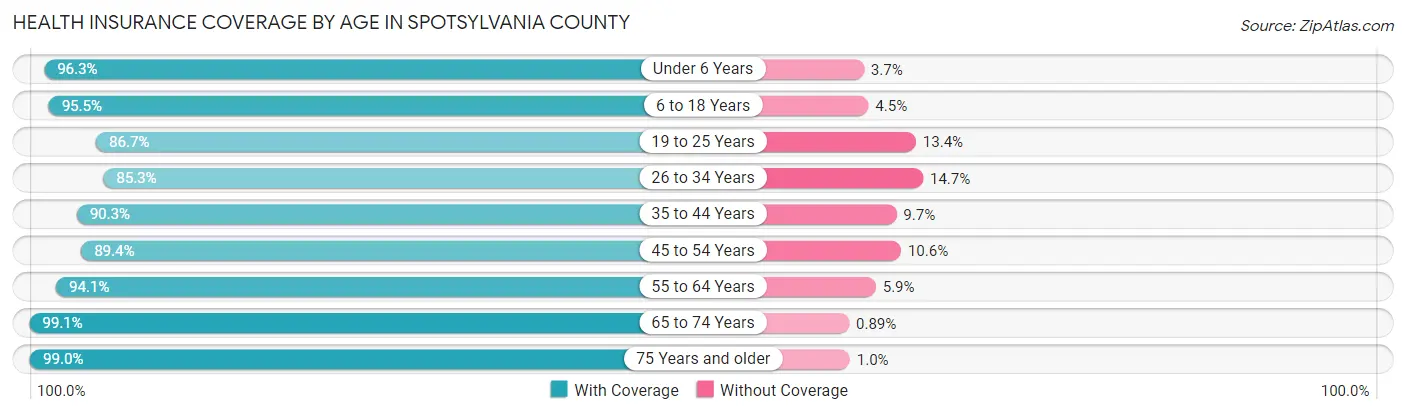
| Age Bracket | With Coverage | Without Coverage |
| Under 6 Years | 9,808 (96.3%) | 373 (3.7%) |
| 6 to 18 Years | 25,290 (95.5%) | 1,191 (4.5%) |
| 19 to 25 Years | 9,986 (86.7%) | 1,538 (13.4%) |
| 26 to 34 Years | 13,610 (85.3%) | 2,344 (14.7%) |
| 35 to 44 Years | 16,409 (90.3%) | 1,767 (9.7%) |
| 45 to 54 Years | 16,879 (89.4%) | 1,994 (10.6%) |
| 55 to 64 Years | 17,466 (94.1%) | 1,090 (5.9%) |
| 65 to 74 Years | 12,502 (99.1%) | 112 (0.9%) |
| 75 Years and older | 7,645 (99.0%) | 80 (1.0%) |
| Total | 129,595 (92.5%) | 10,489 (7.5%) |
Health Insurance Coverage by Citizenship Status in Spotsylvania County
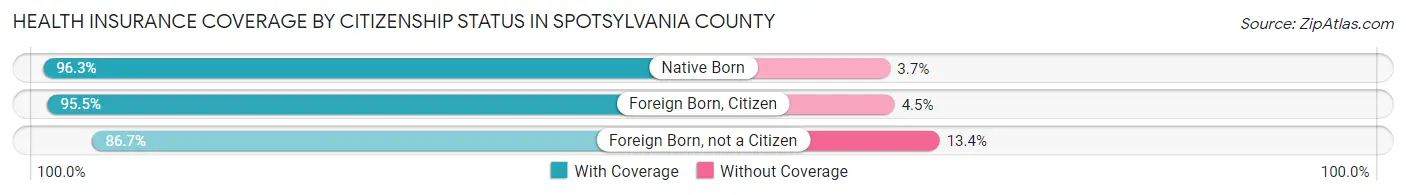
| Citizenship Status | With Coverage | Without Coverage |
| Native Born | 9,808 (96.3%) | 373 (3.7%) |
| Foreign Born, Citizen | 25,290 (95.5%) | 1,191 (4.5%) |
| Foreign Born, not a Citizen | 9,986 (86.7%) | 1,538 (13.4%) |
Health Insurance Coverage by Household Income in Spotsylvania County
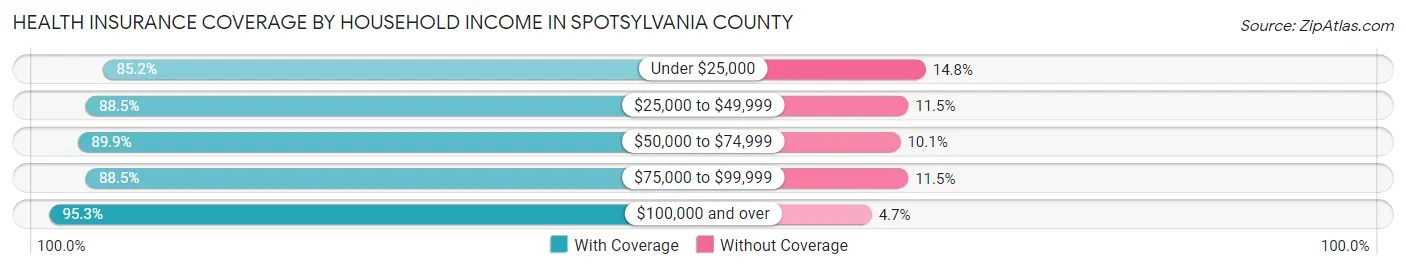
| Household Income | With Coverage | Without Coverage |
| Under $25,000 | 6,715 (85.2%) | 1,166 (14.8%) |
| $25,000 to $49,999 | 12,756 (88.5%) | 1,661 (11.5%) |
| $50,000 to $74,999 | 15,414 (89.9%) | 1,724 (10.1%) |
| $75,000 to $99,999 | 15,572 (88.5%) | 2,026 (11.5%) |
| $100,000 and over | 79,067 (95.3%) | 3,873 (4.7%) |
Public vs Private Health Insurance Coverage by Age in Spotsylvania County
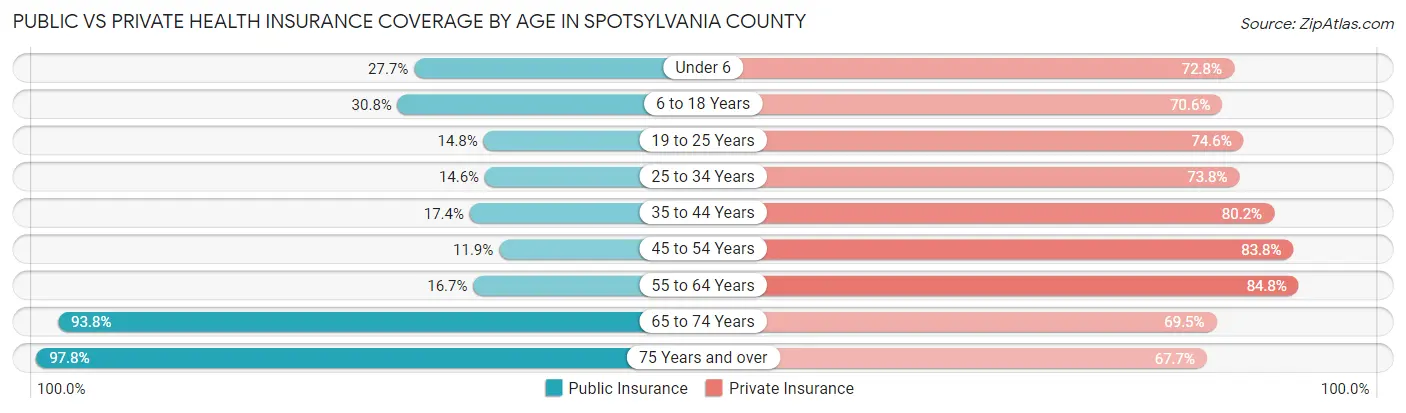
| Age Bracket | Public Insurance | Private Insurance |
| Under 6 | 2,820 (27.7%) | 7,407 (72.8%) |
| 6 to 18 Years | 8,145 (30.8%) | 18,697 (70.6%) |
| 19 to 25 Years | 1,706 (14.8%) | 8,593 (74.6%) |
| 25 to 34 Years | 2,321 (14.5%) | 11,769 (73.8%) |
| 35 to 44 Years | 3,157 (17.4%) | 14,578 (80.2%) |
| 45 to 54 Years | 2,249 (11.9%) | 15,815 (83.8%) |
| 55 to 64 Years | 3,103 (16.7%) | 15,736 (84.8%) |
| 65 to 74 Years | 11,831 (93.8%) | 8,769 (69.5%) |
| 75 Years and over | 7,557 (97.8%) | 5,233 (67.7%) |
| Total | 42,889 (30.6%) | 106,597 (76.1%) |
Disability Status by Sex by Age in Spotsylvania County
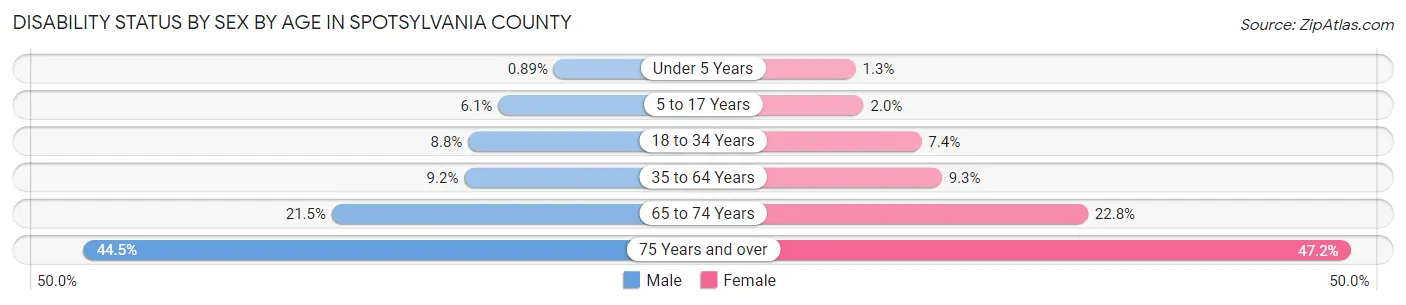
| Age Bracket | Male | Female |
| Under 5 Years | 38 (0.9%) | 52 (1.3%) |
| 5 to 17 Years | 811 (6.0%) | 258 (2.0%) |
| 18 to 34 Years | 1,326 (8.8%) | 1,078 (7.4%) |
| 35 to 64 Years | 2,527 (9.2%) | 2,611 (9.3%) |
| 65 to 74 Years | 1,267 (21.5%) | 1,534 (22.8%) |
| 75 Years and over | 1,480 (44.5%) | 2,077 (47.2%) |
Disability Class by Sex by Age in Spotsylvania County
Disability Class: Hearing Difficulty
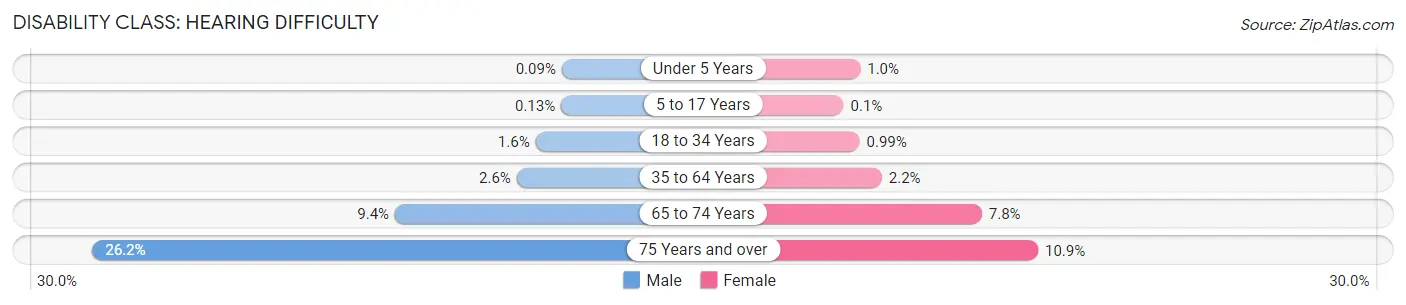
| Age Bracket | Male | Female |
| Under 5 Years | 4 (0.1%) | 42 (1.0%) |
| 5 to 17 Years | 18 (0.1%) | 13 (0.1%) |
| 18 to 34 Years | 233 (1.5%) | 145 (1.0%) |
| 35 to 64 Years | 713 (2.6%) | 627 (2.2%) |
| 65 to 74 Years | 553 (9.4%) | 524 (7.8%) |
| 75 Years and over | 872 (26.2%) | 481 (10.9%) |
Disability Class: Vision Difficulty
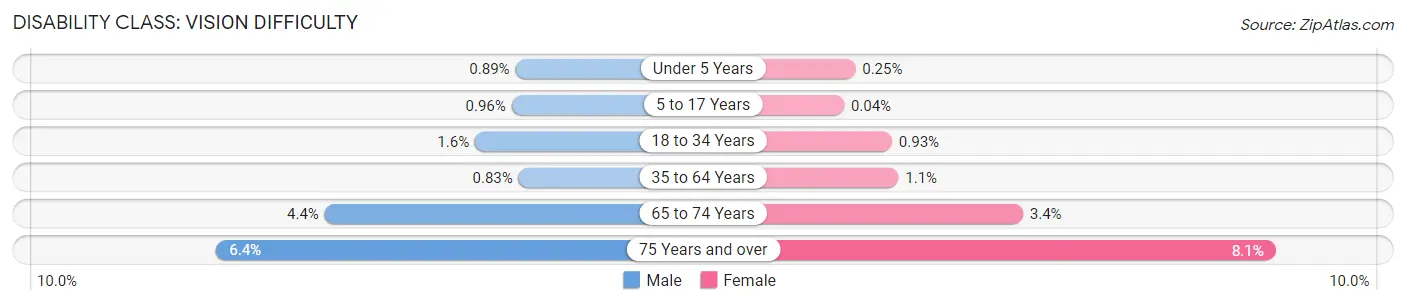
| Age Bracket | Male | Female |
| Under 5 Years | 38 (0.9%) | 10 (0.3%) |
| 5 to 17 Years | 128 (1.0%) | 5 (0.0%) |
| 18 to 34 Years | 246 (1.6%) | 136 (0.9%) |
| 35 to 64 Years | 228 (0.8%) | 295 (1.1%) |
| 65 to 74 Years | 261 (4.4%) | 226 (3.4%) |
| 75 Years and over | 214 (6.4%) | 354 (8.1%) |
Disability Class: Cognitive Difficulty
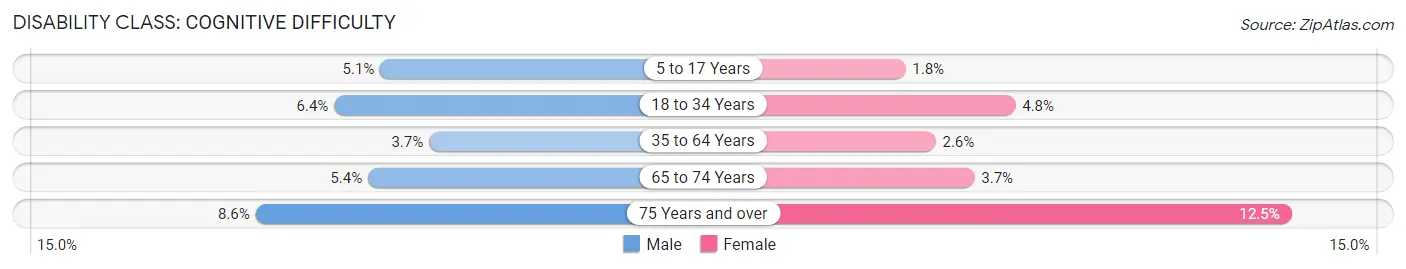
| Age Bracket | Male | Female |
| 5 to 17 Years | 683 (5.1%) | 226 (1.8%) |
| 18 to 34 Years | 958 (6.4%) | 704 (4.8%) |
| 35 to 64 Years | 1,027 (3.7%) | 735 (2.6%) |
| 65 to 74 Years | 321 (5.4%) | 248 (3.7%) |
| 75 Years and over | 285 (8.6%) | 551 (12.5%) |
Disability Class: Ambulatory Difficulty
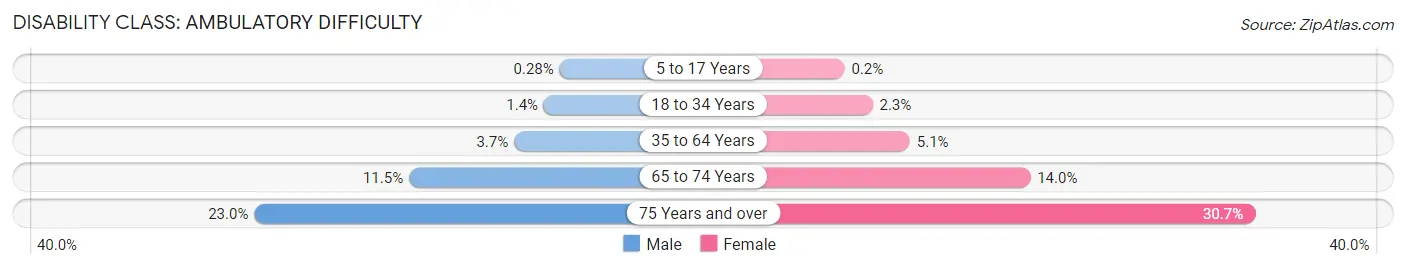
| Age Bracket | Male | Female |
| 5 to 17 Years | 38 (0.3%) | 25 (0.2%) |
| 18 to 34 Years | 217 (1.4%) | 333 (2.3%) |
| 35 to 64 Years | 1,005 (3.7%) | 1,422 (5.1%) |
| 65 to 74 Years | 676 (11.5%) | 940 (14.0%) |
| 75 Years and over | 763 (23.0%) | 1,350 (30.7%) |
Disability Class: Self-Care Difficulty
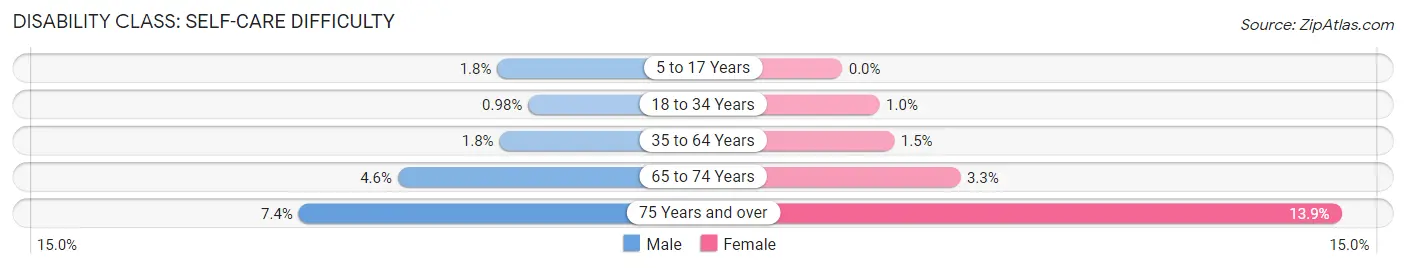
| Age Bracket | Male | Female |
| 5 to 17 Years | 246 (1.8%) | 0 (0.0%) |
| 18 to 34 Years | 147 (1.0%) | 152 (1.0%) |
| 35 to 64 Years | 489 (1.8%) | 407 (1.5%) |
| 65 to 74 Years | 272 (4.6%) | 221 (3.3%) |
| 75 Years and over | 245 (7.4%) | 612 (13.9%) |
Technology Access in Spotsylvania County
Computing Device Access in Spotsylvania County
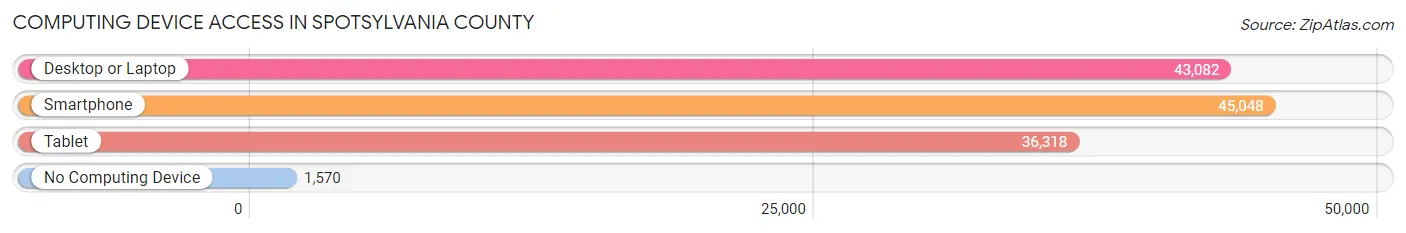
| Device Type | # Households | % Households |
| Desktop or Laptop | 43,082 | 87.1% |
| Smartphone | 45,048 | 91.1% |
| Tablet | 36,318 | 73.5% |
| No Computing Device | 1,570 | 3.2% |
| Total | 49,449 | 100.0% |
Internet Access in Spotsylvania County
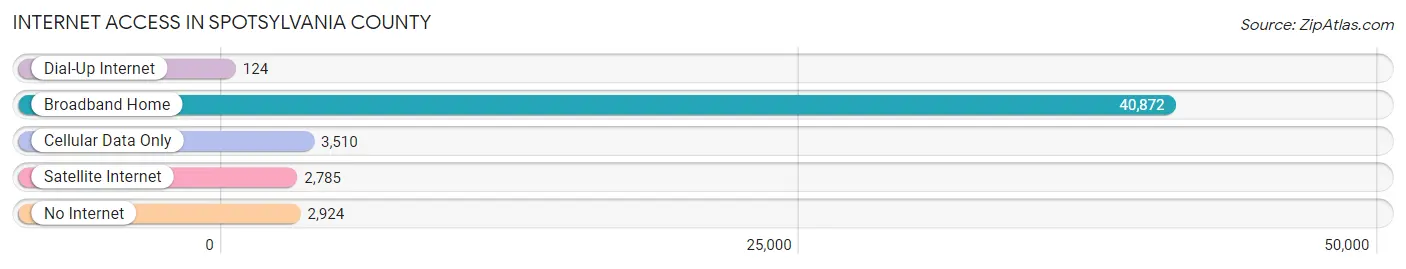
| Internet Type | # Households | % Households |
| Dial-Up Internet | 124 | 0.3% |
| Broadband Home | 40,872 | 82.7% |
| Cellular Data Only | 3,510 | 7.1% |
| Satellite Internet | 2,785 | 5.6% |
| No Internet | 2,924 | 5.9% |
| Total | 49,449 | 100.0% |
Spotsylvania County Summary
Spotsylvania County, Virginia is located in the central part of the state, about 40 miles south of Washington, D.C. It is part of the Fredericksburg Metropolitan Statistical Area and is bordered by Caroline, King George, Stafford, and Orange counties. The county seat is Spotsylvania Courthouse.
History
Spotsylvania County was formed in 1721 from parts of Essex, King and Queen, and King William counties. It was named for Alexander Spotswood, the Lieutenant Governor of Virginia from 1710 to 1722. The county was the site of several major battles during the Civil War, including the Battle of Chancellorsville and the Battle of the Wilderness.
Geography
Spotsylvania County covers an area of 437 square miles and is located in the Piedmont region of Virginia. The terrain is mostly rolling hills, with the highest point being the summit of Massaponax Mountain at 1,068 feet. The county is drained by the Rappahannock River and its tributaries, including the Rapidan River.
Economy
The economy of Spotsylvania County is largely based on agriculture and manufacturing. The county is home to several large farms, as well as several wineries and breweries. The county is also home to several large manufacturing companies, including the Volvo Trucks North America plant in Dublin.
Demographics
As of the 2010 census, Spotsylvania County had a population of 132,373. The racial makeup of the county was 79.2% White, 14.3% African American, 0.5% Native American, 2.2% Asian, 0.1% Pacific Islander, 1.7% from other races, and 2.1% from two or more races. Hispanic or Latino of any race were 5.2% of the population.
The median household income in Spotsylvania County was $76,845, and the median family income was $86,945. The per capita income was $32,945. About 5.2% of families and 7.2% of the population were below the poverty line, including 9.2% of those under age 18 and 5.2% of those age 65 or over.
Spotsylvania County is served by the Spotsylvania County Public Schools system, which includes 15 elementary schools, five middle schools, and four high schools. The county is also home to Germanna Community College, a two-year public college.
Common Questions
What is Per Capita Income in Spotsylvania County?
Per Capita income in Spotsylvania County is $44,881.
What is the Median Family Income in Spotsylvania County?
Median Family Income in Spotsylvania County is $114,779.
What is the Median Household income in Spotsylvania County?
Median Household Income in Spotsylvania County is $105,068.
What is Income or Wage Gap in Spotsylvania County?
Income or Wage Gap in Spotsylvania County is 37.8%.
Women in Spotsylvania County earn 62.2 cents for every dollar earned by a man.
What is Family Income Deficit in Spotsylvania County?
Family Income Deficit in Spotsylvania County is $11,201.
Families that are below poverty line in Spotsylvania County earn $11,201 less on average than the poverty threshold level.
What is Inequality or Gini Index in Spotsylvania County?
Inequality or Gini Index in Spotsylvania County is 0.40.
What is the Total Population of Spotsylvania County?
Total Population of Spotsylvania County is 141,097.
What is the Total Male Population of Spotsylvania County?
Total Male Population of Spotsylvania County is 70,013.
What is the Total Female Population of Spotsylvania County?
Total Female Population of Spotsylvania County is 71,084.
What is the Ratio of Males per 100 Females in Spotsylvania County?
There are 98.49 Males per 100 Females in Spotsylvania County.
What is the Ratio of Females per 100 Males in Spotsylvania County?
There are 101.53 Females per 100 Males in Spotsylvania County.
What is the Median Population Age in Spotsylvania County?
Median Population Age in Spotsylvania County is 38.1 Years.
What is the Average Family Size in Spotsylvania County
Average Family Size in Spotsylvania County is 3.2 People.
What is the Average Household Size in Spotsylvania County
Average Household Size in Spotsylvania County is 2.9 People.
How Large is the Labor Force in Spotsylvania County?
There are 75,267 People in the Labor Forcein in Spotsylvania County.
What is the Percentage of People in the Labor Force in Spotsylvania County?
68.1% of People are in the Labor Force in Spotsylvania County.
What is the Unemployment Rate in Spotsylvania County?
Unemployment Rate in Spotsylvania County is 5.6%.