Southampton County, VA Map & Demographics
Southampton County Map
Southampton County Overview
$32,218
PER CAPITA INCOME
$86,596
AVG FAMILY INCOME
$67,813
AVG HOUSEHOLD INCOME
22.4%
WAGE / INCOME GAP [ % ]
77.6¢/ $1
WAGE / INCOME GAP [ $ ]
0.41
INEQUALITY / GINI INDEX
18,003
TOTAL POPULATION
9,450
MALE POPULATION
8,553
FEMALE POPULATION
110.49
MALES / 100 FEMALES
90.51
FEMALES / 100 MALES
47.0
MEDIAN AGE
3.0
AVG FAMILY SIZE
2.4
AVG HOUSEHOLD SIZE
8,343
LABOR FORCE [ PEOPLE ]
55.9%
PERCENT IN LABOR FORCE
5.5%
UNEMPLOYMENT RATE
Income in Southampton County
Income Overview in Southampton County
Per Capita Income in Southampton County is $32,218, while median incomes of families and households are $86,596 and $67,813 respectively.
| Characteristic | Number | Measure |
| Per Capita Income | 18,003 | $32,218 |
| Median Family Income | 4,648 | $86,596 |
| Mean Family Income | 4,648 | $95,993 |
| Median Household Income | 6,841 | $67,813 |
| Mean Household Income | 6,841 | $81,318 |
| Income Deficit | 4,648 | $0 |
| Wage / Income Gap (%) | 18,003 | 22.36% |
| Wage / Income Gap ($) | 18,003 | 77.64¢ per $1 |
| Gini / Inequality Index | 18,003 | 0.41 |
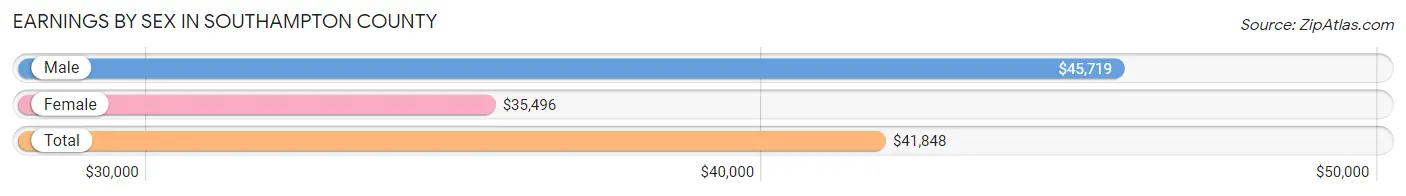
Earnings by Sex in Southampton County
Average Earnings in Southampton County are $41,848, $45,719 for men and $35,496 for women, a difference of 22.4%.
| Sex | Number | Average Earnings |
| Male | 4,674 (53.3%) | $45,719 |
| Female | 4,091 (46.7%) | $35,496 |
| Total | 8,765 (100.0%) | $41,848 |
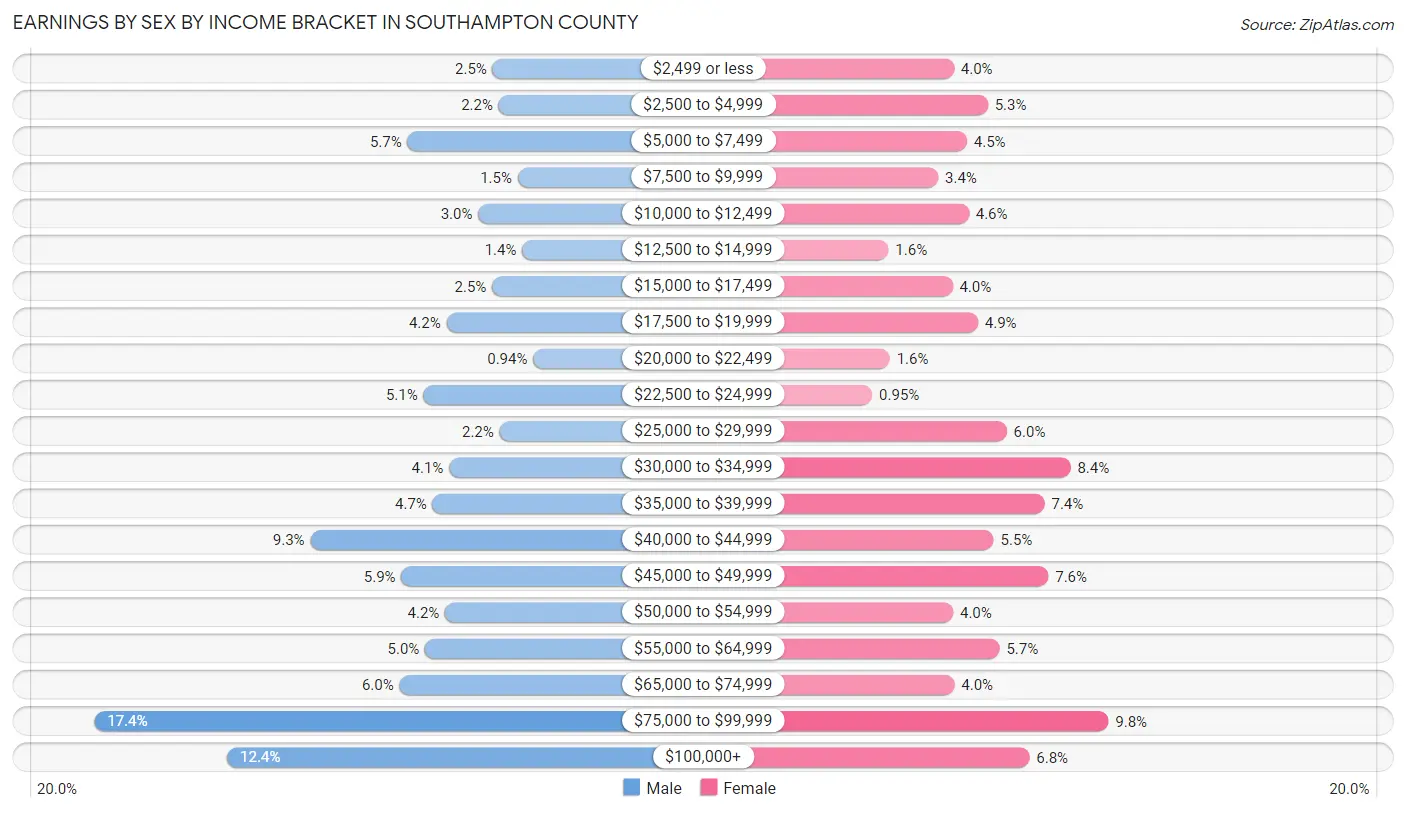
Earnings by Sex by Income Bracket in Southampton County
The most common earnings brackets in Southampton County are $75,000 to $99,999 for men (813 | 17.4%) and $75,000 to $99,999 for women (401 | 9.8%).
| Income | Male | Female |
| $2,499 or less | 115 (2.5%) | 164 (4.0%) |
| $2,500 to $4,999 | 104 (2.2%) | 216 (5.3%) |
| $5,000 to $7,499 | 264 (5.7%) | 184 (4.5%) |
| $7,500 to $9,999 | 71 (1.5%) | 140 (3.4%) |
| $10,000 to $12,499 | 140 (3.0%) | 187 (4.6%) |
| $12,500 to $14,999 | 63 (1.3%) | 64 (1.6%) |
| $15,000 to $17,499 | 116 (2.5%) | 162 (4.0%) |
| $17,500 to $19,999 | 196 (4.2%) | 201 (4.9%) |
| $20,000 to $22,499 | 44 (0.9%) | 66 (1.6%) |
| $22,500 to $24,999 | 236 (5.1%) | 39 (0.9%) |
| $25,000 to $29,999 | 103 (2.2%) | 245 (6.0%) |
| $30,000 to $34,999 | 191 (4.1%) | 343 (8.4%) |
| $35,000 to $39,999 | 220 (4.7%) | 303 (7.4%) |
| $40,000 to $44,999 | 434 (9.3%) | 225 (5.5%) |
| $45,000 to $49,999 | 275 (5.9%) | 309 (7.5%) |
| $50,000 to $54,999 | 198 (4.2%) | 163 (4.0%) |
| $55,000 to $64,999 | 233 (5.0%) | 234 (5.7%) |
| $65,000 to $74,999 | 278 (5.9%) | 165 (4.0%) |
| $75,000 to $99,999 | 813 (17.4%) | 401 (9.8%) |
| $100,000+ | 580 (12.4%) | 280 (6.8%) |
| Total | 4,674 (100.0%) | 4,091 (100.0%) |
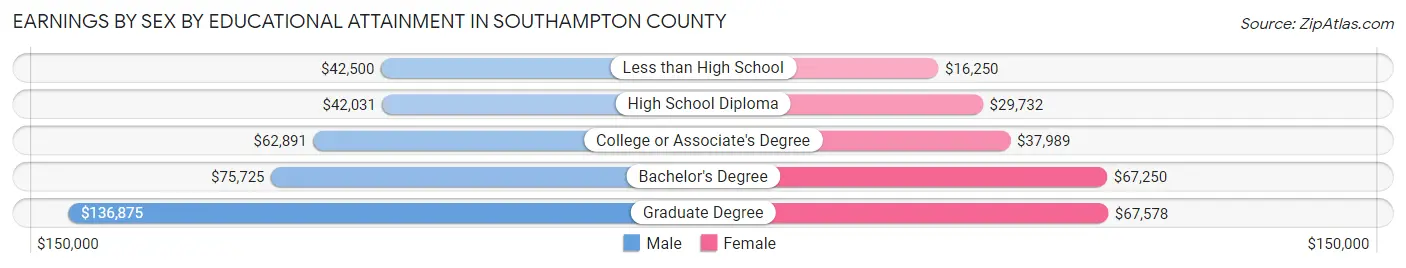
Earnings by Sex by Educational Attainment in Southampton County
Average earnings in Southampton County are $50,598 for men and $39,496 for women, a difference of 21.9%. Men with an educational attainment of graduate degree enjoy the highest average annual earnings of $136,875, while those with high school diploma education earn the least with $42,031. Women with an educational attainment of graduate degree earn the most with the average annual earnings of $67,578, while those with less than high school education have the smallest earnings of $16,250.
| Educational Attainment | Male Income | Female Income |
| Less than High School | $42,500 | $16,250 |
| High School Diploma | $42,031 | $29,732 |
| College or Associate's Degree | $62,891 | $37,989 |
| Bachelor's Degree | $75,725 | $67,250 |
| Graduate Degree | $136,875 | $67,578 |
| Total | $50,598 | $39,496 |
Family Income in Southampton County
Family Income Brackets in Southampton County
According to the Southampton County family income data, there are 1,009 families falling into the $100,000 to $149,999 income range, which is the most common income bracket and makes up 21.7% of all families. Conversely, the $10,000 to $14,999 income bracket is the least frequent group with only 70 families (1.5%) belonging to this category.
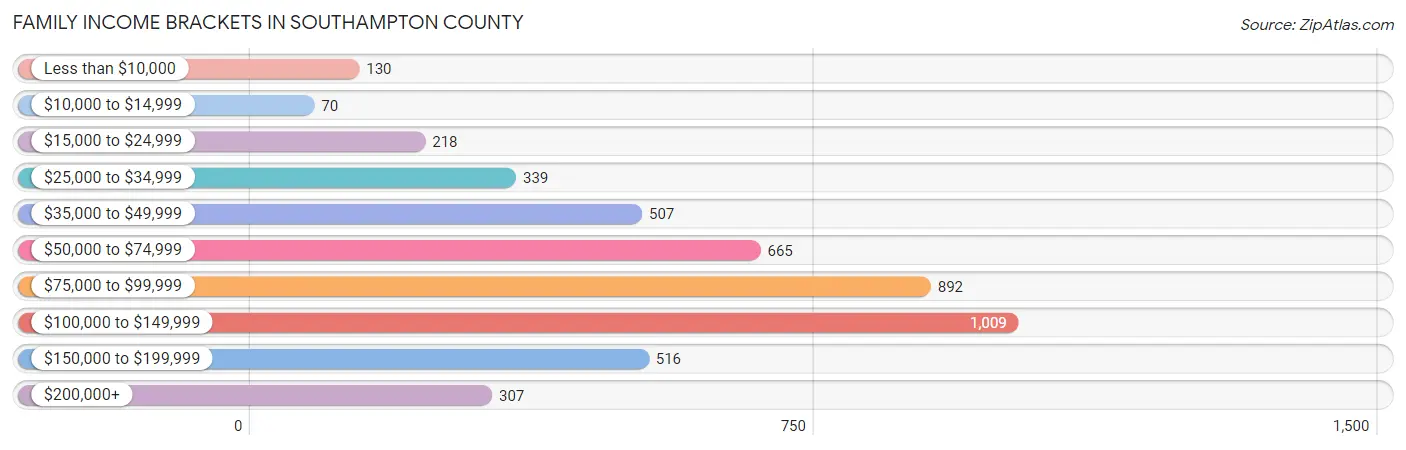
| Income Bracket | # Families | % Families |
| Less than $10,000 | 130 | 2.8% |
| $10,000 to $14,999 | 70 | 1.5% |
| $15,000 to $24,999 | 218 | 4.7% |
| $25,000 to $34,999 | 339 | 7.3% |
| $35,000 to $49,999 | 507 | 10.9% |
| $50,000 to $74,999 | 665 | 14.3% |
| $75,000 to $99,999 | 892 | 19.2% |
| $100,000 to $149,999 | 1,009 | 21.7% |
| $150,000 to $199,999 | 516 | 11.1% |
| $200,000+ | 307 | 6.6% |
Family Income by Famaliy Size in Southampton County
6-person families (79 | 1.7%) account for the highest median family income in Southampton County with $250,001 per family, while 6-person families (79 | 1.7%) have the highest median income of $41,667 per family member.
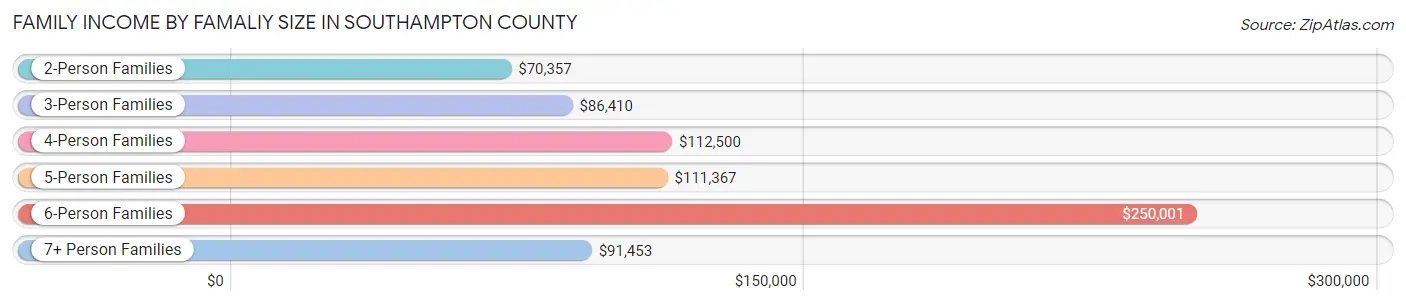
| Income Bracket | # Families | Median Income |
| 2-Person Families | 2,680 (57.7%) | $70,357 |
| 3-Person Families | 980 (21.1%) | $86,410 |
| 4-Person Families | 598 (12.9%) | $112,500 |
| 5-Person Families | 215 (4.6%) | $111,367 |
| 6-Person Families | 79 (1.7%) | $250,001 |
| 7+ Person Families | 96 (2.1%) | $91,453 |
| Total | 4,648 (100.0%) | $86,596 |
Family Income by Number of Earners in Southampton County
The median family income in Southampton County is $86,596, with families comprising 3+ earners (501) having the highest median family income of $177,689, while families with no earners (779) have the lowest median family income of $47,656, accounting for 10.8% and 16.8% of families, respectively.
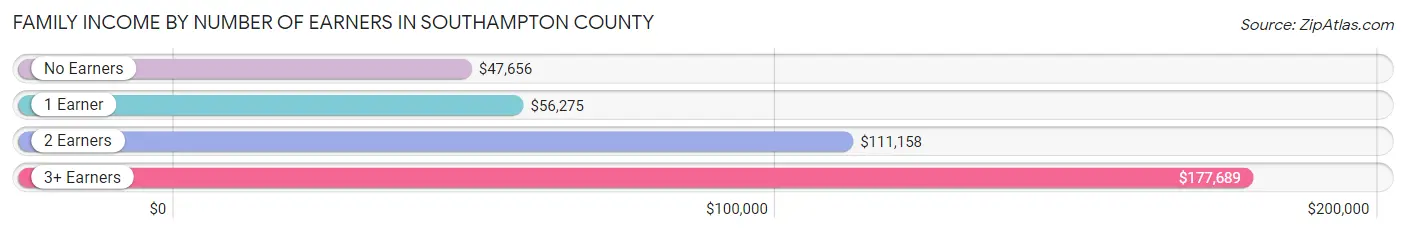
| Number of Earners | # Families | Median Income |
| No Earners | 779 (16.8%) | $47,656 |
| 1 Earner | 1,624 (34.9%) | $56,275 |
| 2 Earners | 1,744 (37.5%) | $111,158 |
| 3+ Earners | 501 (10.8%) | $177,689 |
| Total | 4,648 (100.0%) | $86,596 |
Household Income in Southampton County
Household Income Brackets in Southampton County
With 1,129 households falling in the category, the $100,000 to $149,999 income range is the most frequent in Southampton County, accounting for 16.5% of all households. In contrast, only 164 households (2.4%) fall into the $10,000 to $14,999 income bracket, making it the least populous group.
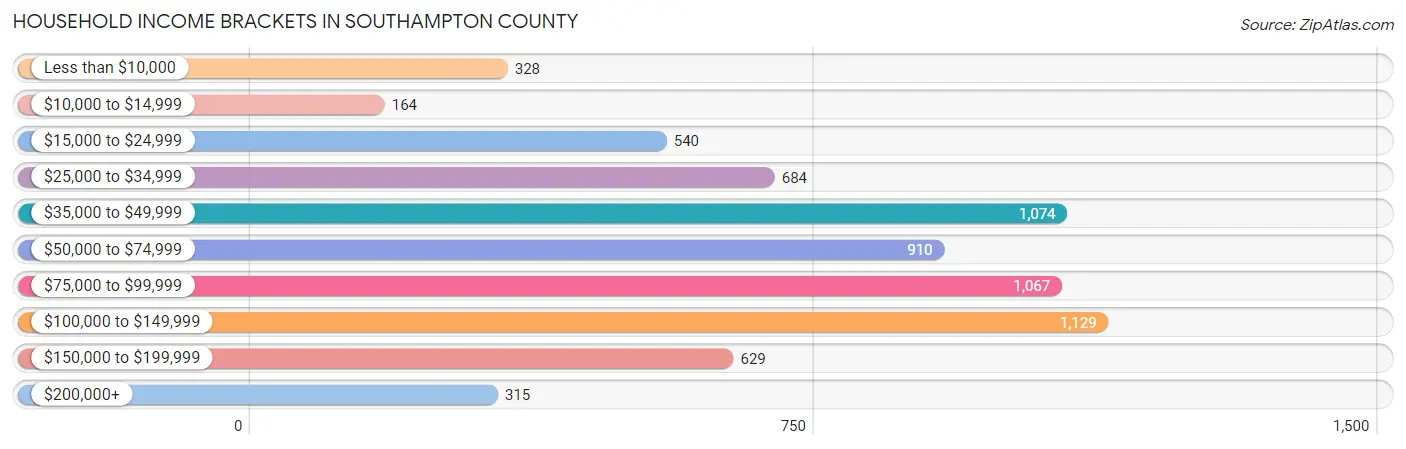
| Income Bracket | # Households | % Households |
| Less than $10,000 | 328 | 4.8% |
| $10,000 to $14,999 | 164 | 2.4% |
| $15,000 to $24,999 | 540 | 7.9% |
| $25,000 to $34,999 | 684 | 10.0% |
| $35,000 to $49,999 | 1,074 | 15.7% |
| $50,000 to $74,999 | 910 | 13.3% |
| $75,000 to $99,999 | 1,067 | 15.6% |
| $100,000 to $149,999 | 1,129 | 16.5% |
| $150,000 to $199,999 | 629 | 9.2% |
| $200,000+ | 315 | 4.6% |
Household Income by Householder Age in Southampton County
The median household income in Southampton County is $67,813, with the highest median household income of $83,387 found in the 45 to 64 years age bracket for the primary householder. A total of 3,130 households (45.8%) fall into this category. Meanwhile, the 15 to 24 years age bracket for the primary householder has the lowest median household income of $0, with 75 households (1.1%) in this group.
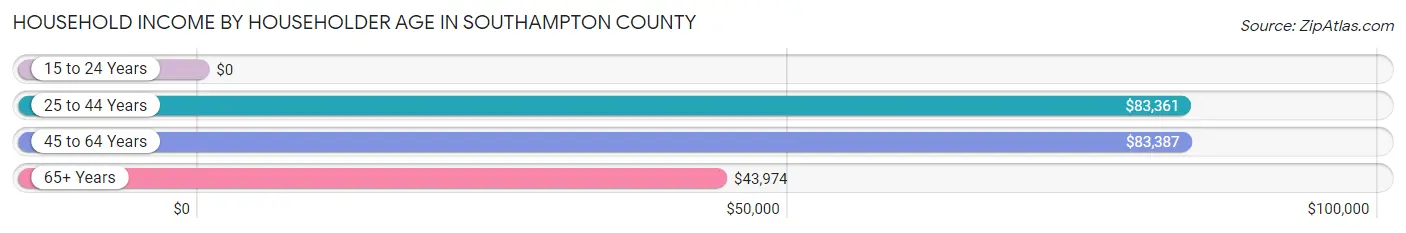
| Income Bracket | # Households | Median Income |
| 15 to 24 Years | 75 (1.1%) | $0 |
| 25 to 44 Years | 1,267 (18.5%) | $83,361 |
| 45 to 64 Years | 3,130 (45.8%) | $83,387 |
| 65+ Years | 2,369 (34.6%) | $43,974 |
| Total | 6,841 (100.0%) | $67,813 |
Poverty in Southampton County
Income Below Poverty by Sex and Age in Southampton County
With 6.7% poverty level for males and 10.1% for females among the residents of Southampton County, 18 to 24 year old males and 5 year old females are the most vulnerable to poverty, with 92 males (14.3%) and 14 females (22.6%) in their respective age groups living below the poverty level.
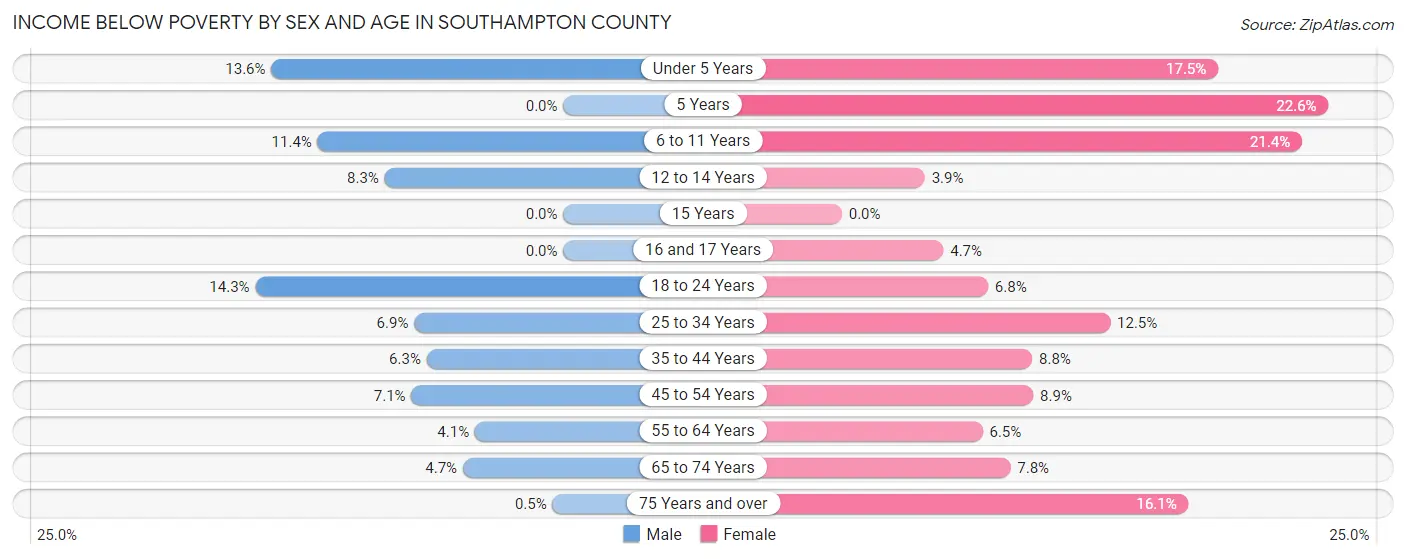
| Age Bracket | Male | Female |
| Under 5 Years | 58 (13.6%) | 73 (17.5%) |
| 5 Years | 0 (0.0%) | 14 (22.6%) |
| 6 to 11 Years | 74 (11.4%) | 107 (21.4%) |
| 12 to 14 Years | 17 (8.3%) | 12 (3.8%) |
| 15 Years | 0 (0.0%) | 0 (0.0%) |
| 16 and 17 Years | 0 (0.0%) | 8 (4.7%) |
| 18 to 24 Years | 92 (14.3%) | 43 (6.8%) |
| 25 to 34 Years | 55 (6.9%) | 100 (12.4%) |
| 35 to 44 Years | 51 (6.3%) | 78 (8.8%) |
| 45 to 54 Years | 98 (7.0%) | 98 (8.9%) |
| 55 to 64 Years | 51 (4.1%) | 90 (6.5%) |
| 65 to 74 Years | 48 (4.7%) | 83 (7.8%) |
| 75 Years and over | 3 (0.5%) | 131 (16.1%) |
| Total | 547 (6.7%) | 837 (10.1%) |
Income Above Poverty by Sex and Age in Southampton County
According to the poverty statistics in Southampton County, males aged 5 years and females aged 15 years are the age groups that are most secure financially, with 100.0% of males and 100.0% of females in these age groups living above the poverty line.
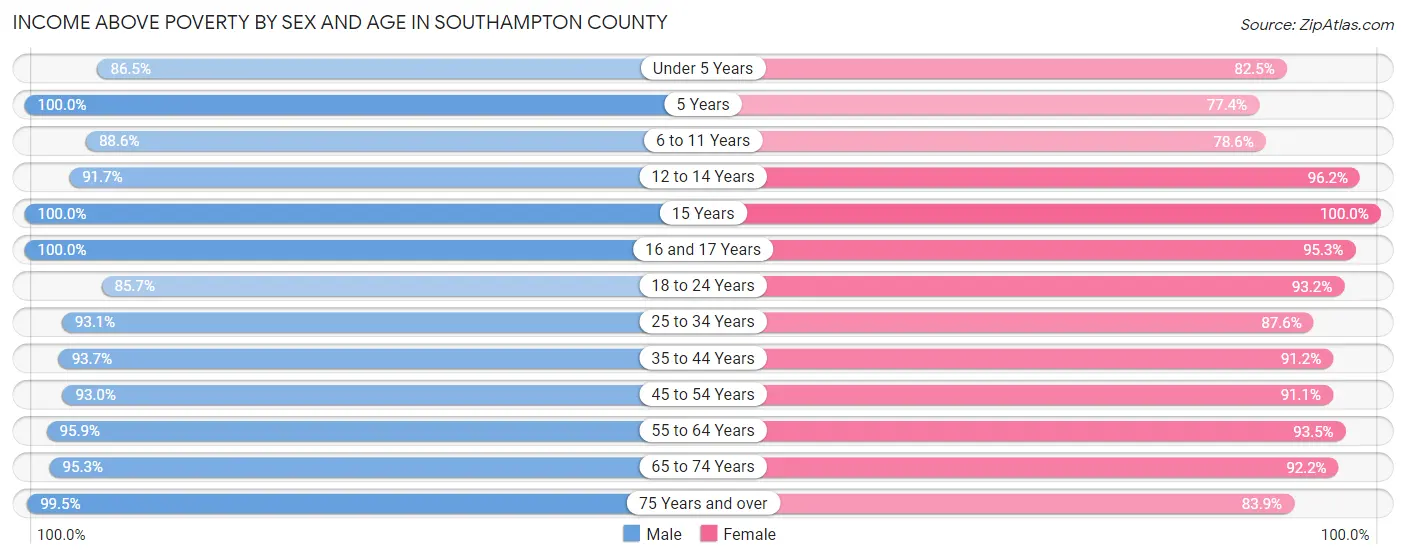
| Age Bracket | Male | Female |
| Under 5 Years | 370 (86.5%) | 345 (82.5%) |
| 5 Years | 81 (100.0%) | 48 (77.4%) |
| 6 to 11 Years | 575 (88.6%) | 394 (78.6%) |
| 12 to 14 Years | 188 (91.7%) | 300 (96.2%) |
| 15 Years | 117 (100.0%) | 185 (100.0%) |
| 16 and 17 Years | 229 (100.0%) | 162 (95.3%) |
| 18 to 24 Years | 552 (85.7%) | 591 (93.2%) |
| 25 to 34 Years | 740 (93.1%) | 703 (87.5%) |
| 35 to 44 Years | 753 (93.7%) | 805 (91.2%) |
| 45 to 54 Years | 1,293 (92.9%) | 1,006 (91.1%) |
| 55 to 64 Years | 1,193 (95.9%) | 1,288 (93.5%) |
| 65 to 74 Years | 983 (95.3%) | 978 (92.2%) |
| 75 Years and over | 600 (99.5%) | 683 (83.9%) |
| Total | 7,674 (93.3%) | 7,488 (89.9%) |
Income Below Poverty Among Married-Couple Families in Southampton County
The poverty statistics for married-couple families in Southampton County show that 1.9% or 60 of the total 3,112 families live below the poverty line. Families with no children have the highest poverty rate of 2.6%, comprising of 54 families. On the other hand, families with 5 or more children have the lowest poverty rate of 0.0%, which includes 0 families.
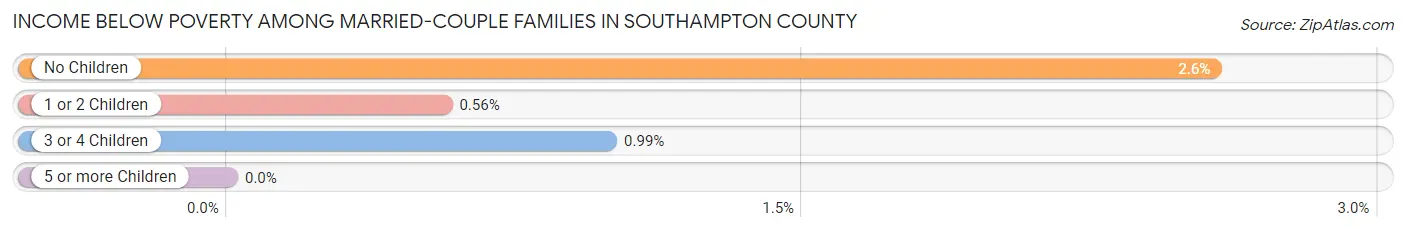
| Children | Above Poverty | Below Poverty |
| No Children | 2,051 (97.4%) | 54 (2.6%) |
| 1 or 2 Children | 889 (99.4%) | 5 (0.6%) |
| 3 or 4 Children | 100 (99.0%) | 1 (1.0%) |
| 5 or more Children | 12 (100.0%) | 0 (0.0%) |
| Total | 3,052 (98.1%) | 60 (1.9%) |
Income Below Poverty Among Single-Parent Households in Southampton County
According to the poverty data in Southampton County, 6.3% or 23 single-father households and 18.1% or 212 single-mother households are living below the poverty line. Among single-father households, those with no children have the highest poverty rate, with 15 households (10.4%) experiencing poverty. Likewise, among single-mother households, those with 3 or 4 children have the highest poverty rate, with 57 households (60.6%) falling below the poverty line.
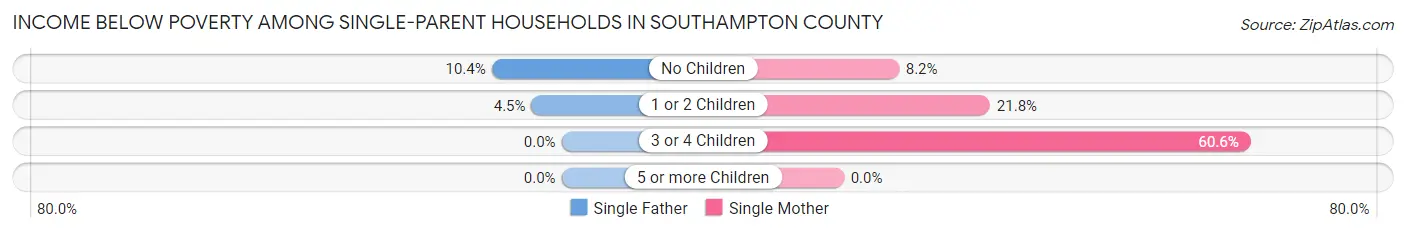
| Children | Single Father | Single Mother |
| No Children | 15 (10.4%) | 48 (8.2%) |
| 1 or 2 Children | 8 (4.5%) | 107 (21.8%) |
| 3 or 4 Children | 0 (0.0%) | 57 (60.6%) |
| 5 or more Children | 0 (0.0%) | 0 (0.0%) |
| Total | 23 (6.3%) | 212 (18.1%) |
Income Below Poverty Among Married-Couple vs Single-Parent Households in Southampton County
The poverty data for Southampton County shows that 60 of the married-couple family households (1.9%) and 235 of the single-parent households (15.3%) are living below the poverty level. Within the married-couple family households, those with no children have the highest poverty rate, with 54 households (2.6%) falling below the poverty line. Among the single-parent households, those with 3 or 4 children have the highest poverty rate, with 57 household (41.3%) living below poverty.
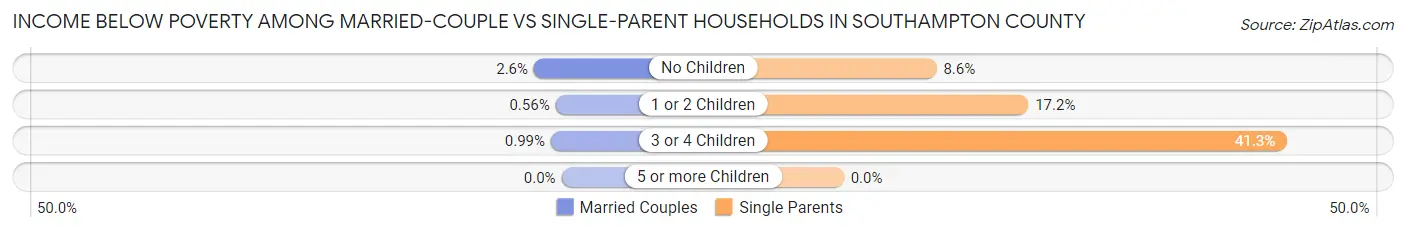
| Children | Married-Couple Families | Single-Parent Households |
| No Children | 54 (2.6%) | 63 (8.6%) |
| 1 or 2 Children | 5 (0.6%) | 115 (17.2%) |
| 3 or 4 Children | 1 (1.0%) | 57 (41.3%) |
| 5 or more Children | 0 (0.0%) | 0 (0.0%) |
| Total | 60 (1.9%) | 235 (15.3%) |
Race in Southampton County
The most populous races in Southampton County are White / Caucasian (11,114 | 61.7%), Black / African American (5,421 | 30.1%), and Two or more Races (1,253 | 7.0%).
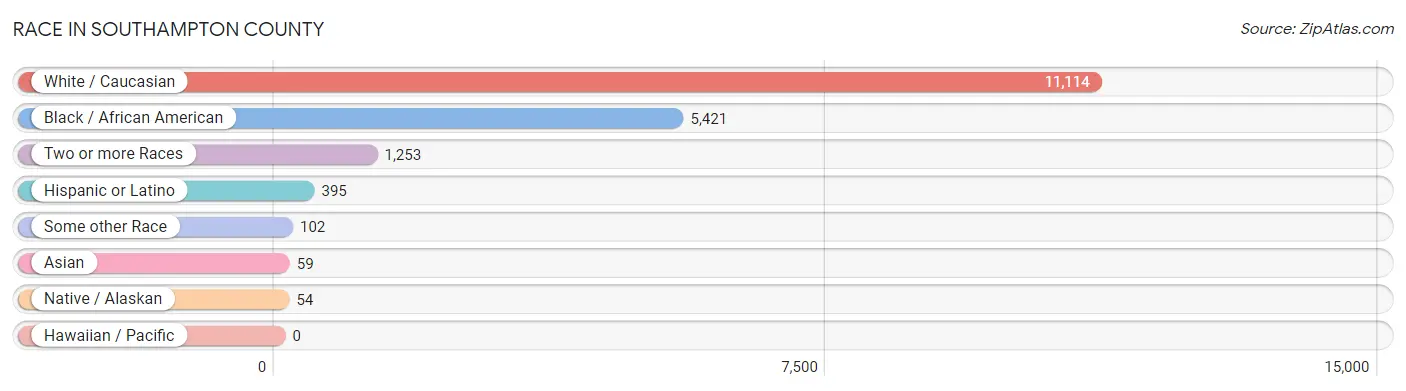
| Race | # Population | % Population |
| Asian | 59 | 0.3% |
| Black / African American | 5,421 | 30.1% |
| Hawaiian / Pacific | 0 | 0.0% |
| Hispanic or Latino | 395 | 2.2% |
| Native / Alaskan | 54 | 0.3% |
| White / Caucasian | 11,114 | 61.7% |
| Two or more Races | 1,253 | 7.0% |
| Some other Race | 102 | 0.6% |
| Total | 18,003 | 100.0% |
Ancestry in Southampton County
The most populous ancestries reported in Southampton County are English (2,724 | 15.1%), Subsaharan African (2,009 | 11.2%), African (1,999 | 11.1%), Irish (1,256 | 7.0%), and American (1,173 | 6.5%), together accounting for 50.9% of all Southampton County residents.
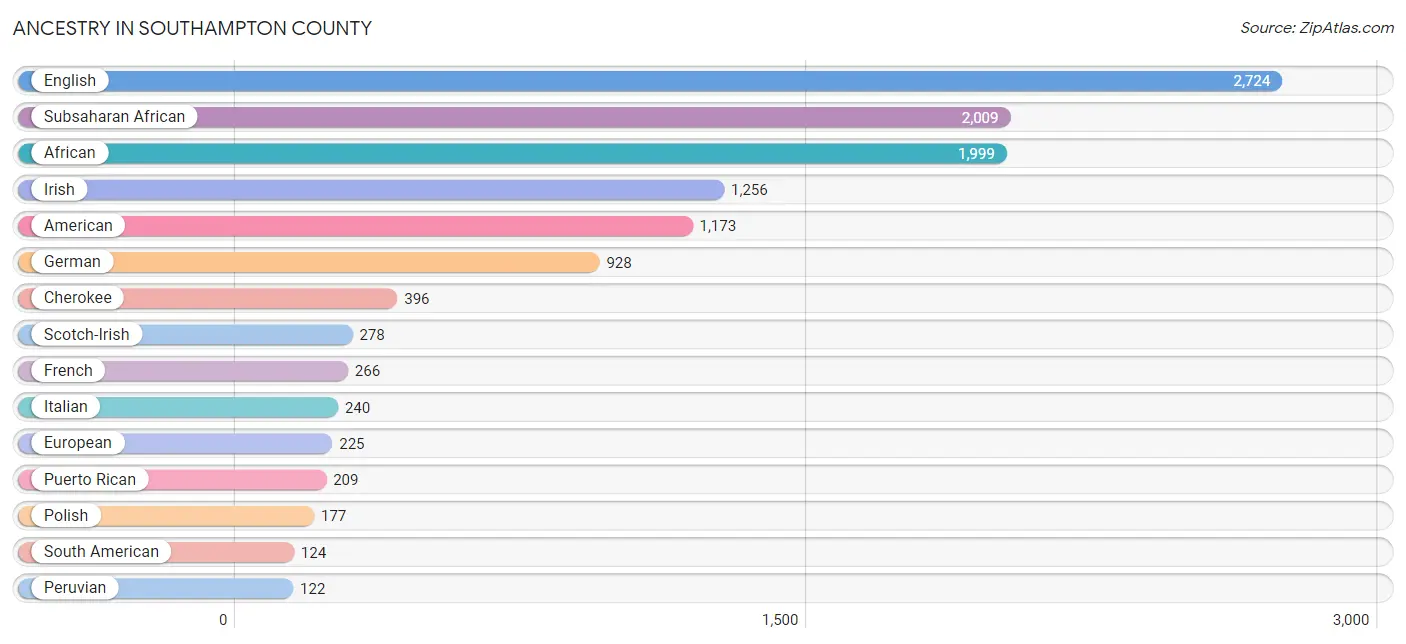
| Ancestry | # Population | % Population |
| African | 1,999 | 11.1% |
| American | 1,173 | 6.5% |
| Apache | 42 | 0.2% |
| Arab | 13 | 0.1% |
| Austrian | 26 | 0.1% |
| Blackfeet | 40 | 0.2% |
| British | 73 | 0.4% |
| Burmese | 2 | 0.0% |
| Canadian | 4 | 0.0% |
| Central American | 23 | 0.1% |
| Cherokee | 396 | 2.2% |
| Choctaw | 95 | 0.5% |
| Colombian | 2 | 0.0% |
| Danish | 17 | 0.1% |
| Dutch | 102 | 0.6% |
| Eastern European | 18 | 0.1% |
| Egyptian | 10 | 0.1% |
| English | 2,724 | 15.1% |
| European | 225 | 1.3% |
| French | 266 | 1.5% |
| French Canadian | 47 | 0.3% |
| German | 928 | 5.1% |
| Greek | 77 | 0.4% |
| Haitian | 28 | 0.2% |
| Hungarian | 25 | 0.1% |
| Irish | 1,256 | 7.0% |
| Italian | 240 | 1.3% |
| Korean | 75 | 0.4% |
| Lebanese | 3 | 0.0% |
| Lithuanian | 89 | 0.5% |
| Lumbee | 15 | 0.1% |
| Mexican | 34 | 0.2% |
| Norwegian | 64 | 0.4% |
| Panamanian | 23 | 0.1% |
| Peruvian | 122 | 0.7% |
| Polish | 177 | 1.0% |
| Portuguese | 23 | 0.1% |
| Puerto Rican | 209 | 1.2% |
| Russian | 23 | 0.1% |
| Scandinavian | 18 | 0.1% |
| Scotch-Irish | 278 | 1.5% |
| Scottish | 93 | 0.5% |
| Seminole | 92 | 0.5% |
| Sioux | 14 | 0.1% |
| South African | 10 | 0.1% |
| South American | 124 | 0.7% |
| Spaniard | 5 | 0.0% |
| Sri Lankan | 16 | 0.1% |
| Subsaharan African | 2,009 | 11.2% |
| Swiss | 38 | 0.2% |
| Thai | 5 | 0.0% |
| Trinidadian and Tobagonian | 4 | 0.0% |
| U.S. Virgin Islander | 5 | 0.0% |
| Ukrainian | 38 | 0.2% |
| Welsh | 70 | 0.4% |
| Yugoslavian | 2 | 0.0% | View All 56 Rows |
Immigrants in Southampton County
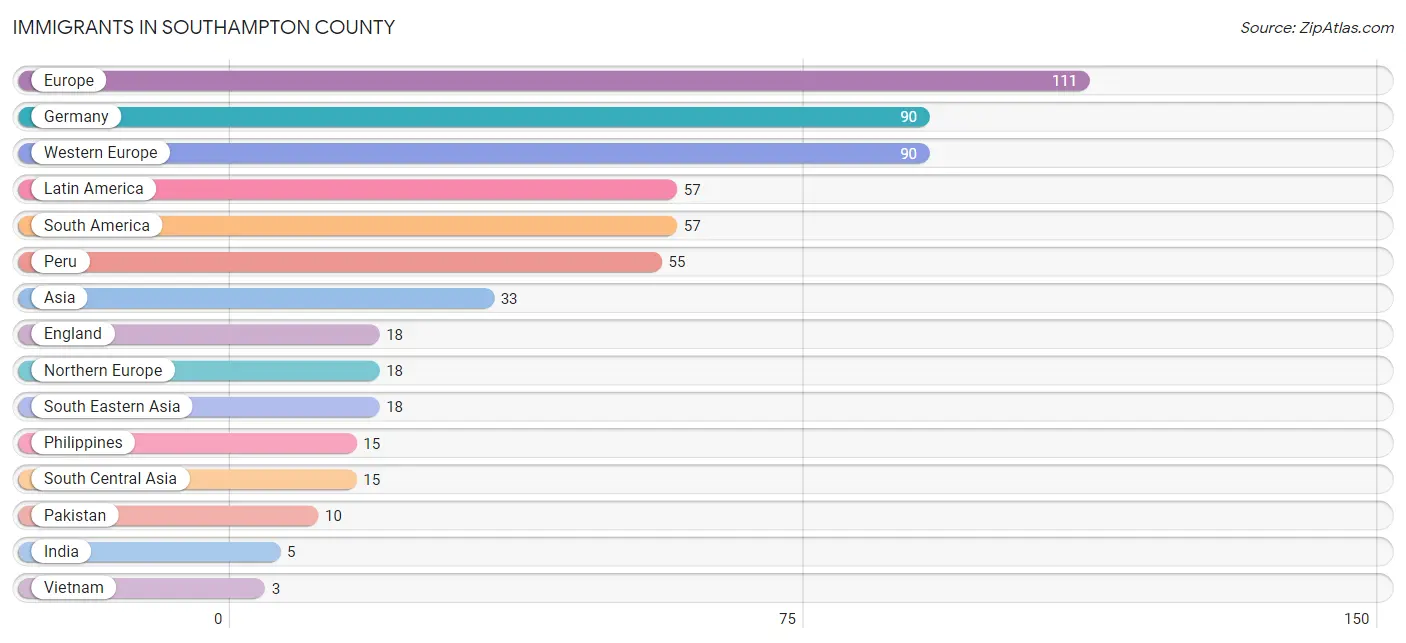
The most numerous immigrant groups reported in Southampton County came from Europe (111 | 0.6%), Germany (90 | 0.5%), Western Europe (90 | 0.5%), Latin America (57 | 0.3%), and South America (57 | 0.3%), together accounting for 2.3% of all Southampton County residents.
| Immigration Origin | # Population | % Population |
| Asia | 33 | 0.2% |
| Colombia | 2 | 0.0% |
| Eastern Europe | 2 | 0.0% |
| England | 18 | 0.1% |
| Europe | 111 | 0.6% |
| Germany | 90 | 0.5% |
| India | 5 | 0.0% |
| Italy | 1 | 0.0% |
| Latin America | 57 | 0.3% |
| Northern Europe | 18 | 0.1% |
| Pakistan | 10 | 0.1% |
| Peru | 55 | 0.3% |
| Philippines | 15 | 0.1% |
| South America | 57 | 0.3% |
| South Central Asia | 15 | 0.1% |
| South Eastern Asia | 18 | 0.1% |
| Southern Europe | 1 | 0.0% |
| Vietnam | 3 | 0.0% |
| Western Europe | 90 | 0.5% | View All 19 Rows |
Sex and Age in Southampton County
Sex and Age in Southampton County
The most populous age groups in Southampton County are 50 to 54 Years (868 | 9.2%) for men and 60 to 64 Years (794 | 9.3%) for women.
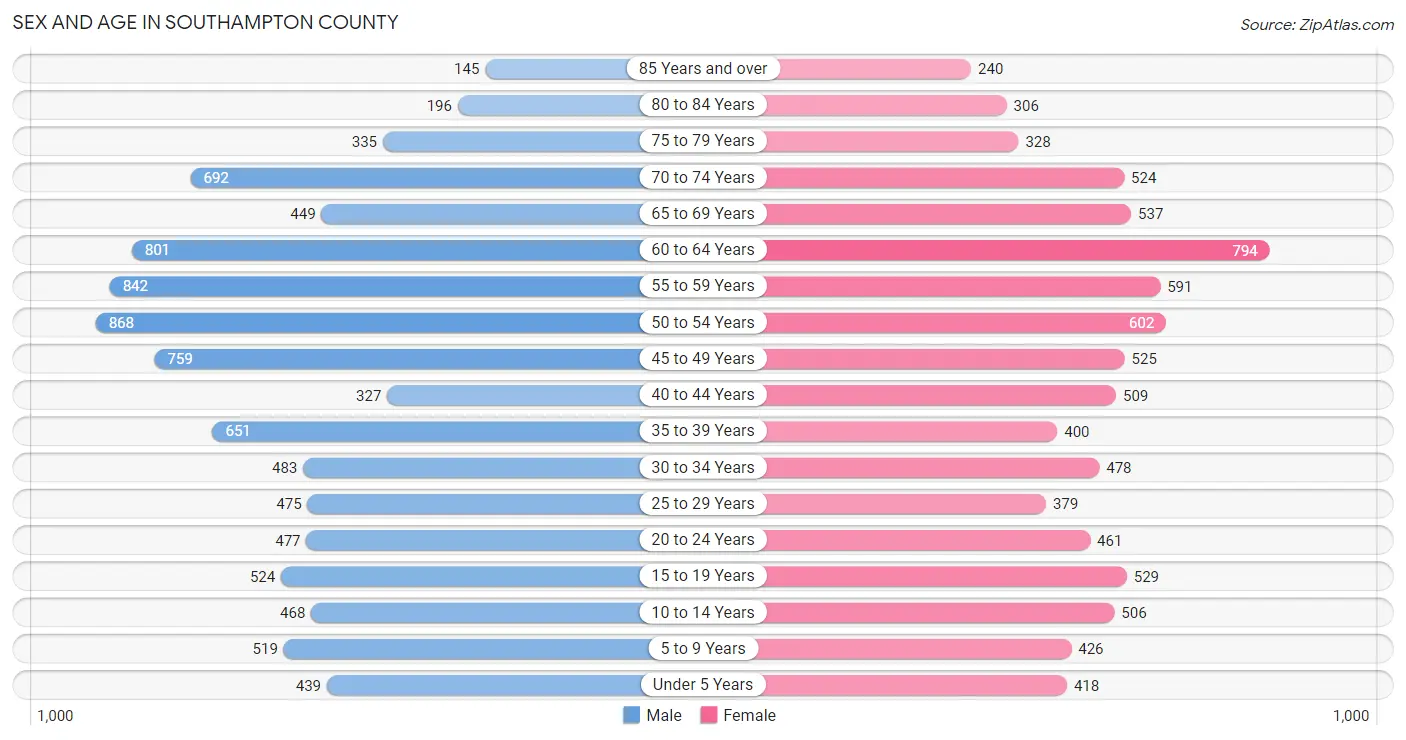
| Age Bracket | Male | Female |
| Under 5 Years | 439 (4.6%) | 418 (4.9%) |
| 5 to 9 Years | 519 (5.5%) | 426 (5.0%) |
| 10 to 14 Years | 468 (5.0%) | 506 (5.9%) |
| 15 to 19 Years | 524 (5.5%) | 529 (6.2%) |
| 20 to 24 Years | 477 (5.1%) | 461 (5.4%) |
| 25 to 29 Years | 475 (5.0%) | 379 (4.4%) |
| 30 to 34 Years | 483 (5.1%) | 478 (5.6%) |
| 35 to 39 Years | 651 (6.9%) | 400 (4.7%) |
| 40 to 44 Years | 327 (3.5%) | 509 (5.9%) |
| 45 to 49 Years | 759 (8.0%) | 525 (6.1%) |
| 50 to 54 Years | 868 (9.2%) | 602 (7.0%) |
| 55 to 59 Years | 842 (8.9%) | 591 (6.9%) |
| 60 to 64 Years | 801 (8.5%) | 794 (9.3%) |
| 65 to 69 Years | 449 (4.8%) | 537 (6.3%) |
| 70 to 74 Years | 692 (7.3%) | 524 (6.1%) |
| 75 to 79 Years | 335 (3.5%) | 328 (3.8%) |
| 80 to 84 Years | 196 (2.1%) | 306 (3.6%) |
| 85 Years and over | 145 (1.5%) | 240 (2.8%) |
| Total | 9,450 (100.0%) | 8,553 (100.0%) |
Families and Households in Southampton County
Median Family Size in Southampton County
The median family size in Southampton County is 2.97 persons per family, with single female/mother families (1,170 | 25.2%) accounting for the largest median family size of 3.02 persons per family. On the other hand, single male/father families (366 | 7.9%) represent the smallest median family size with 2.92 persons per family.
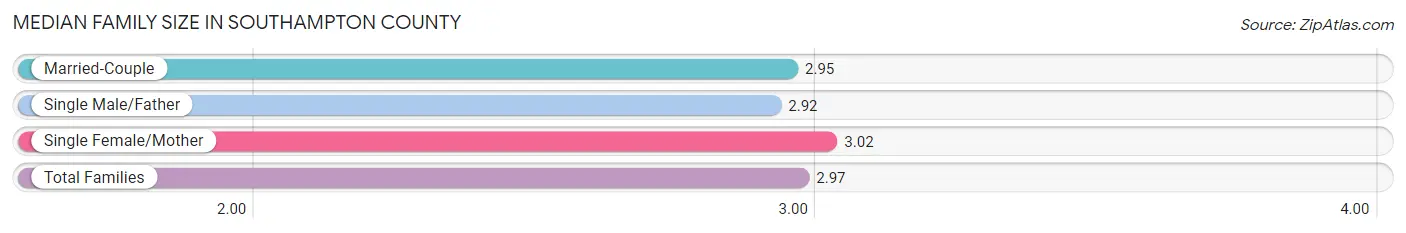
| Family Type | # Families | Family Size |
| Married-Couple | 3,112 (66.9%) | 2.95 |
| Single Male/Father | 366 (7.9%) | 2.92 |
| Single Female/Mother | 1,170 (25.2%) | 3.02 |
| Total Families | 4,648 (100.0%) | 2.97 |
Median Household Size in Southampton County
The median household size in Southampton County is 2.43 persons per household, with single female/mother households (1,170 | 17.1%) accounting for the largest median household size of 3.24 persons per household. non-family households (2,193 | 32.1%) represent the smallest median household size with 1.14 persons per household.
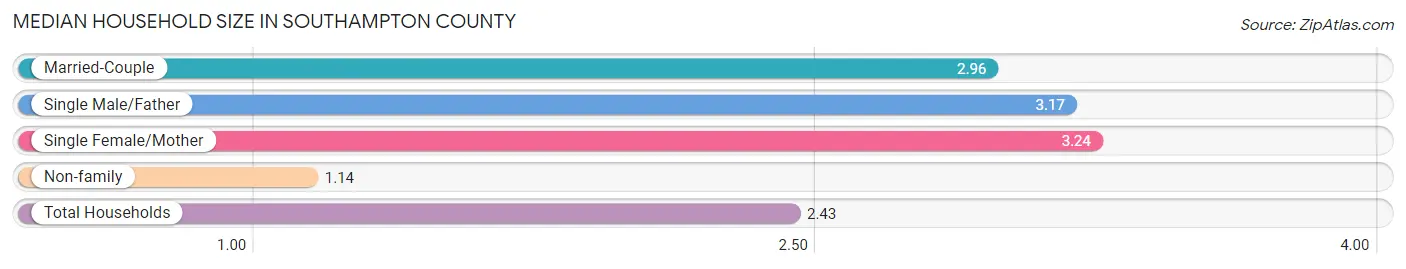
| Household Type | # Households | Household Size |
| Married-Couple | 3,112 (45.5%) | 2.96 |
| Single Male/Father | 366 (5.3%) | 3.17 |
| Single Female/Mother | 1,170 (17.1%) | 3.24 |
| Non-family | 2,193 (32.1%) | 1.14 |
| Total Households | 6,841 (100.0%) | 2.43 |
Household Size by Marriage Status in Southampton County
Out of a total of 6,841 households in Southampton County, 4,648 (67.9%) are family households, while 2,193 (32.1%) are nonfamily households. The most numerous type of family households are 2-person households, comprising 2,520, and the most common type of nonfamily households are 1-person households, comprising 1,954.
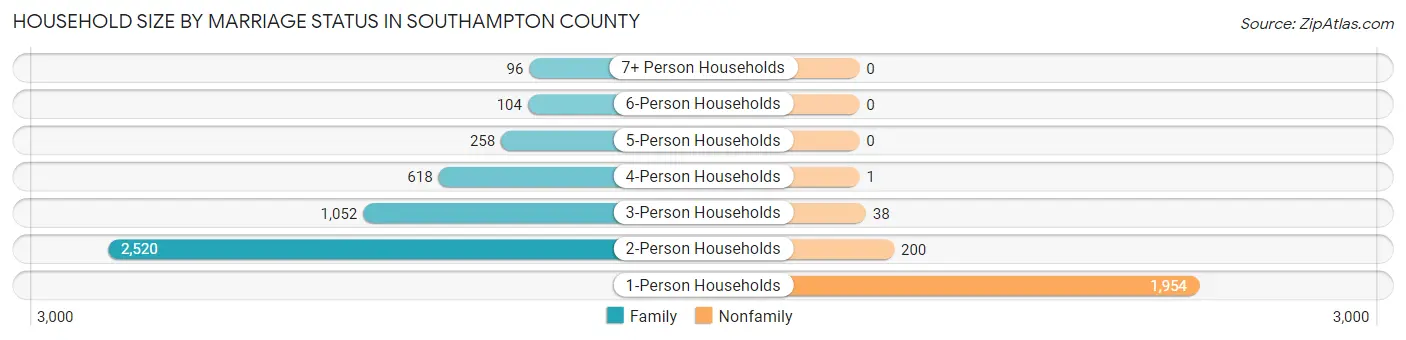
| Household Size | Family Households | Nonfamily Households |
| 1-Person Households | - | 1,954 (28.6%) |
| 2-Person Households | 2,520 (36.8%) | 200 (2.9%) |
| 3-Person Households | 1,052 (15.4%) | 38 (0.6%) |
| 4-Person Households | 618 (9.0%) | 1 (0.0%) |
| 5-Person Households | 258 (3.8%) | 0 (0.0%) |
| 6-Person Households | 104 (1.5%) | 0 (0.0%) |
| 7+ Person Households | 96 (1.4%) | 0 (0.0%) |
| Total | 4,648 (67.9%) | 2,193 (32.1%) |
Female Fertility in Southampton County
Fertility by Age in Southampton County
Average fertility rate in Southampton County is 45.0 births per 1,000 women. Women in the age bracket of 35 to 50 years have the highest fertility rate with 52.0 births per 1,000 women. Women in the age bracket of 35 to 50 years acount for 53.0% of all women with births.
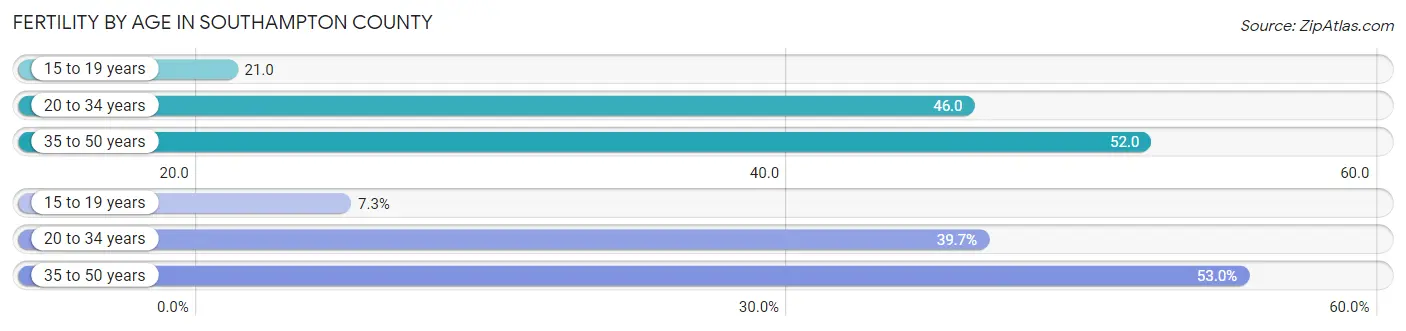
| Age Bracket | Women with Births | Births / 1,000 Women |
| 15 to 19 years | 11 (7.3%) | 21.0 |
| 20 to 34 years | 60 (39.7%) | 46.0 |
| 35 to 50 years | 80 (53.0%) | 52.0 |
| Total | 151 (100.0%) | 45.0 |
Fertility by Age by Marriage Status in Southampton County
64.2% of women with births (151) in Southampton County are married. The highest percentage of unmarried women with births falls into 15 to 19 years age bracket with 100.0% of them unmarried at the time of birth, while the lowest percentage of unmarried women with births belong to 35 to 50 years age bracket with 21.3% of them unmarried.
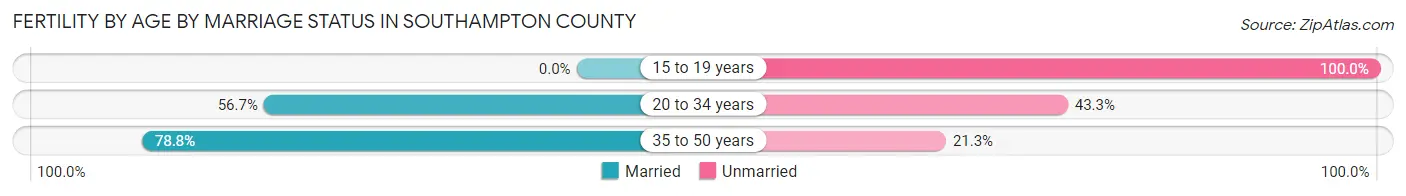
| Age Bracket | Married | Unmarried |
| 15 to 19 years | 0 (0.0%) | 11 (100.0%) |
| 20 to 34 years | 34 (56.7%) | 26 (43.3%) |
| 35 to 50 years | 63 (78.7%) | 17 (21.2%) |
| Total | 97 (64.2%) | 54 (35.8%) |
Fertility by Education in Southampton County
Average fertility rate in Southampton County is 45.0 births per 1,000 women. Women with the education attainment of high school diploma have the highest fertility rate of 64.0 births per 1,000 women, while women with the education attainment of less than high school have the lowest fertility at 10.0 births per 1,000 women. Women with the education attainment of high school diploma represent 41.7% of all women with births.
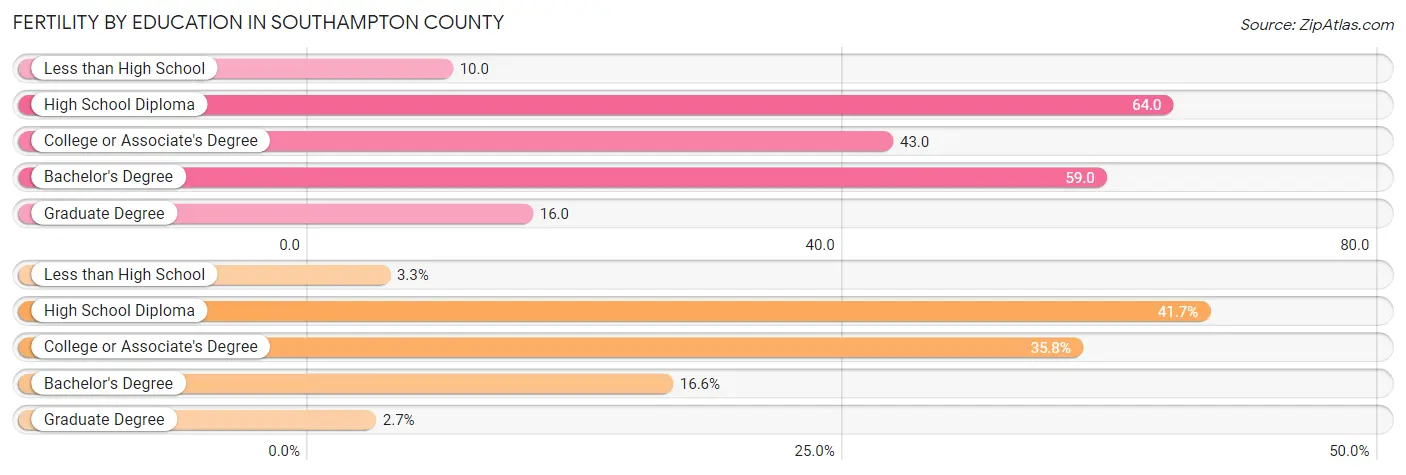
| Educational Attainment | Women with Births | Births / 1,000 Women |
| Less than High School | 5 (3.3%) | 10.0 |
| High School Diploma | 63 (41.7%) | 64.0 |
| College or Associate's Degree | 54 (35.8%) | 43.0 |
| Bachelor's Degree | 25 (16.6%) | 59.0 |
| Graduate Degree | 4 (2.6%) | 16.0 |
| Total | 151 (100.0%) | 45.0 |
Fertility by Education by Marriage Status in Southampton County
35.8% of women with births in Southampton County are unmarried. Women with the educational attainment of graduate degree are most likely to be married with 100.0% of them married at childbirth, while women with the educational attainment of less than high school are least likely to be married with 100.0% of them unmarried at childbirth.
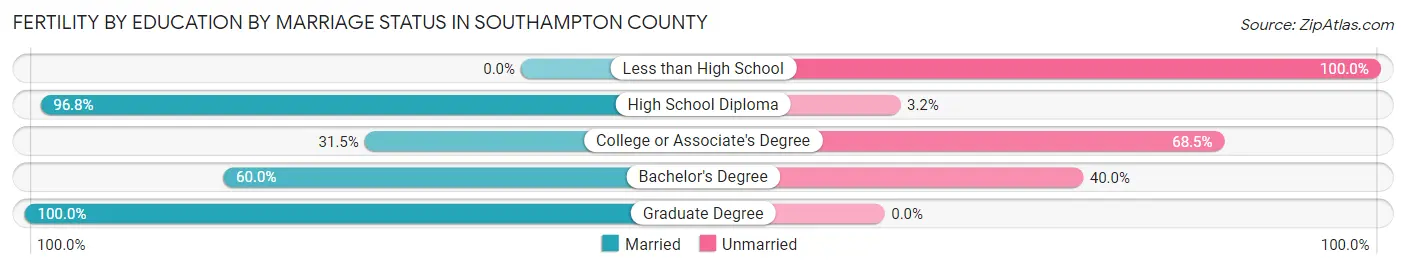
| Educational Attainment | Married | Unmarried |
| Less than High School | 0 (0.0%) | 5 (100.0%) |
| High School Diploma | 61 (96.8%) | 2 (3.2%) |
| College or Associate's Degree | 17 (31.5%) | 37 (68.5%) |
| Bachelor's Degree | 15 (60.0%) | 10 (40.0%) |
| Graduate Degree | 4 (100.0%) | 0 (0.0%) |
| Total | 97 (64.2%) | 54 (35.8%) |
Employment Characteristics in Southampton County
Employment by Class of Employer in Southampton County
Among the 7,839 employed individuals in Southampton County, private company employees (4,373 | 55.8%), local government employees (1,024 | 13.1%), and federal government employees (627 | 8.0%) make up the most common classes of employment.
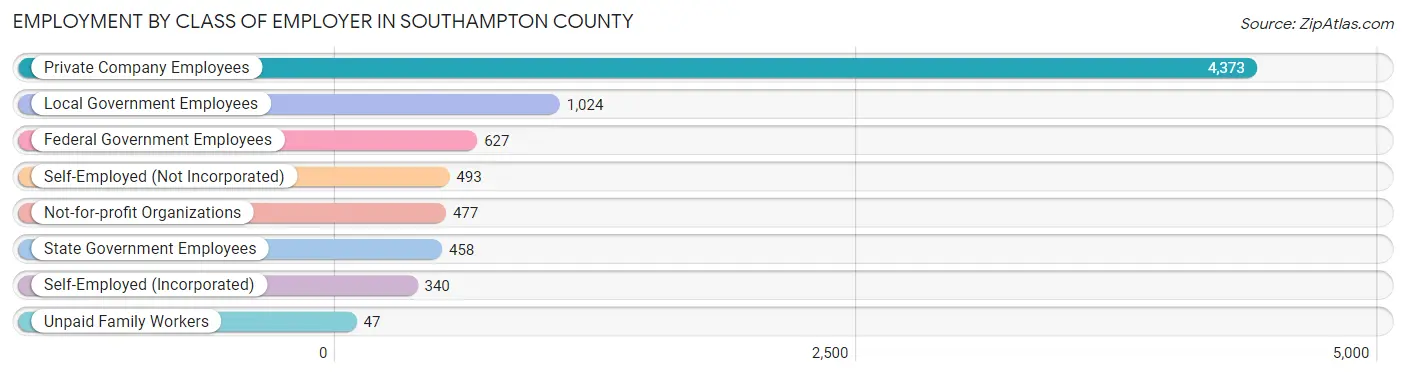
| Employer Class | # Employees | % Employees |
| Private Company Employees | 4,373 | 55.8% |
| Self-Employed (Incorporated) | 340 | 4.3% |
| Self-Employed (Not Incorporated) | 493 | 6.3% |
| Not-for-profit Organizations | 477 | 6.1% |
| Local Government Employees | 1,024 | 13.1% |
| State Government Employees | 458 | 5.8% |
| Federal Government Employees | 627 | 8.0% |
| Unpaid Family Workers | 47 | 0.6% |
| Total | 7,839 | 100.0% |
Employment Status by Age in Southampton County
According to the labor force statistics for Southampton County, out of the total population over 16 years of age (14,925), 55.9% or 8,343 individuals are in the labor force, with 5.5% or 459 of them unemployed. The age group with the highest labor force participation rate is 35 to 44 years, with 79.7% or 1,504 individuals in the labor force. Within the labor force, the 16 to 19 years age range has the highest percentage of unemployed individuals, with 34.1% or 121 of them being unemployed.
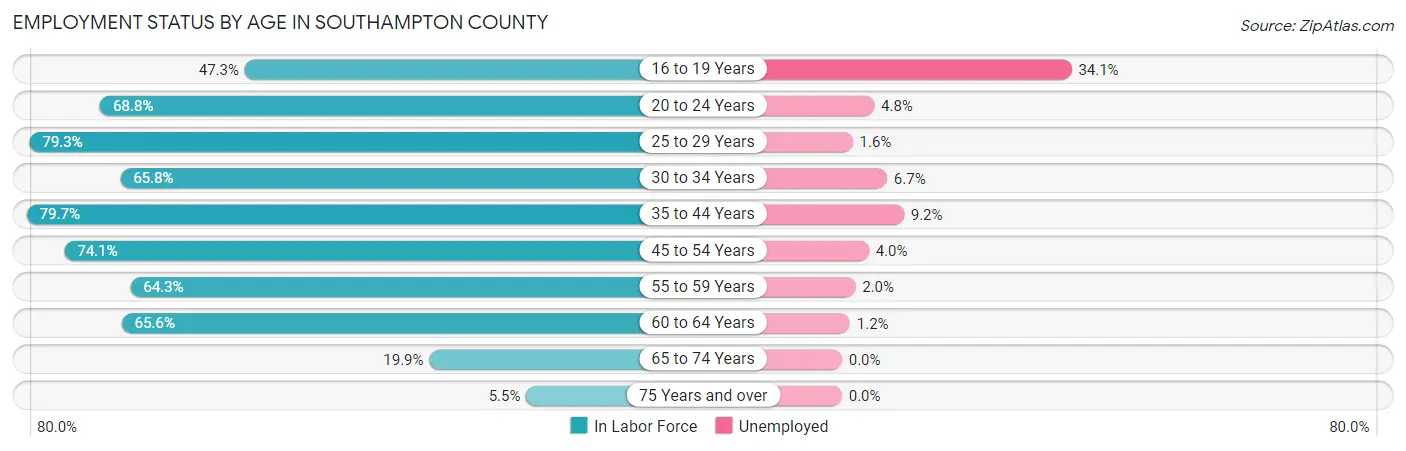
| Age Bracket | In Labor Force | Unemployed |
| 16 to 19 Years | 355 (47.3%) | 121 (34.1%) |
| 20 to 24 Years | 645 (68.8%) | 31 (4.8%) |
| 25 to 29 Years | 677 (79.3%) | 11 (1.6%) |
| 30 to 34 Years | 632 (65.8%) | 42 (6.7%) |
| 35 to 44 Years | 1,504 (79.7%) | 138 (9.2%) |
| 45 to 54 Years | 2,041 (74.1%) | 82 (4.0%) |
| 55 to 59 Years | 921 (64.3%) | 18 (2.0%) |
| 60 to 64 Years | 1,046 (65.6%) | 13 (1.2%) |
| 65 to 74 Years | 438 (19.9%) | 0 (0.0%) |
| 75 Years and over | 85 (5.5%) | 0 (0.0%) |
| Total | 8,343 (55.9%) | 459 (5.5%) |
Employment Status by Educational Attainment in Southampton County
According to labor force statistics for Southampton County, 71.9% of individuals (6,819) out of the total population between 25 and 64 years of age (9,484) are in the labor force, with 4.5% or 307 of them being unemployed. The group with the highest labor force participation rate are those with the educational attainment of bachelor's degree or higher, with 89.5% or 1,800 individuals in the labor force. Within the labor force, individuals with college / associate degree education have the highest percentage of unemployment, with 7.6% or 217 of them being unemployed.
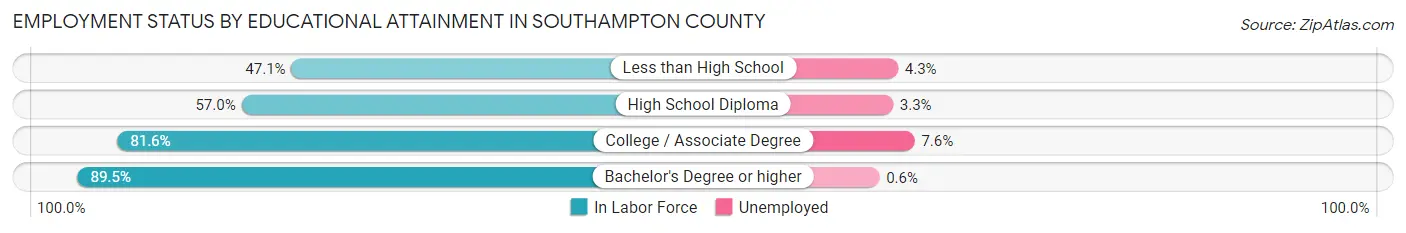
| Educational Attainment | In Labor Force | Unemployed |
| Less than High School | 461 (47.1%) | 42 (4.3%) |
| High School Diploma | 1,712 (57.0%) | 99 (3.3%) |
| College / Associate Degree | 2,849 (81.6%) | 265 (7.6%) |
| Bachelor's Degree or higher | 1,800 (89.5%) | 12 (0.6%) |
| Total | 6,819 (71.9%) | 427 (4.5%) |
Employment Occupations by Sex in Southampton County
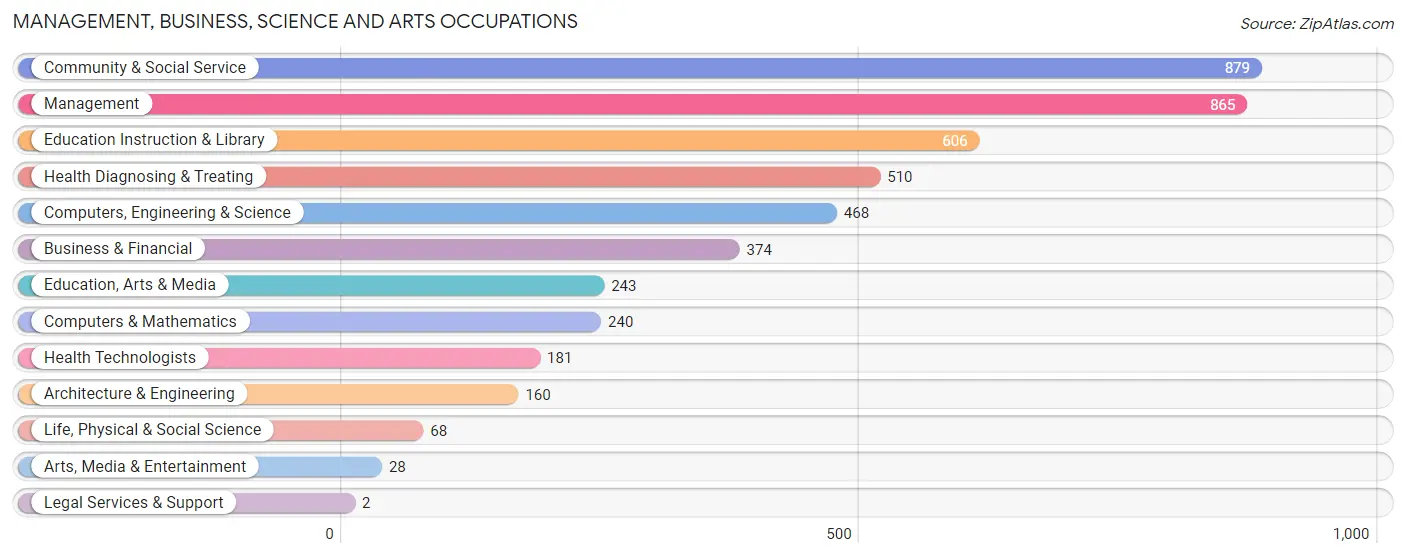
Management, Business, Science and Arts Occupations
The most common Management, Business, Science and Arts occupations in Southampton County are Community & Social Service (879 | 11.2%), Management (865 | 11.0%), Education Instruction & Library (606 | 7.7%), Health Diagnosing & Treating (510 | 6.5%), and Computers, Engineering & Science (468 | 6.0%).
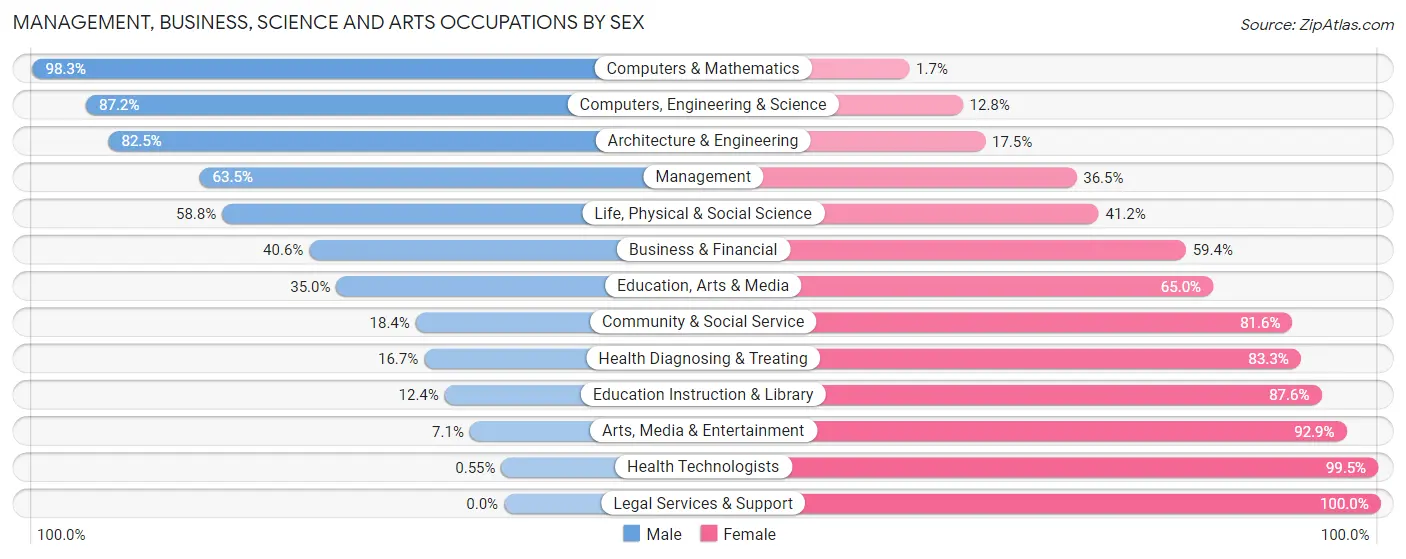
Management, Business, Science and Arts Occupations by Sex
Within the Management, Business, Science and Arts occupations in Southampton County, the most male-oriented occupations are Computers & Mathematics (98.3%), Computers, Engineering & Science (87.2%), and Architecture & Engineering (82.5%), while the most female-oriented occupations are Legal Services & Support (100.0%), Health Technologists (99.5%), and Arts, Media & Entertainment (92.9%).
| Occupation | Male | Female |
| Management | 549 (63.5%) | 316 (36.5%) |
| Business & Financial | 152 (40.6%) | 222 (59.4%) |
| Computers, Engineering & Science | 408 (87.2%) | 60 (12.8%) |
| Computers & Mathematics | 236 (98.3%) | 4 (1.7%) |
| Architecture & Engineering | 132 (82.5%) | 28 (17.5%) |
| Life, Physical & Social Science | 40 (58.8%) | 28 (41.2%) |
| Community & Social Service | 162 (18.4%) | 717 (81.6%) |
| Education, Arts & Media | 85 (35.0%) | 158 (65.0%) |
| Legal Services & Support | 0 (0.0%) | 2 (100.0%) |
| Education Instruction & Library | 75 (12.4%) | 531 (87.6%) |
| Arts, Media & Entertainment | 2 (7.1%) | 26 (92.9%) |
| Health Diagnosing & Treating | 85 (16.7%) | 425 (83.3%) |
| Health Technologists | 1 (0.5%) | 180 (99.5%) |
| Total (Category) | 1,356 (43.8%) | 1,740 (56.2%) |
| Total (Overall) | 4,041 (51.6%) | 3,797 (48.4%) |
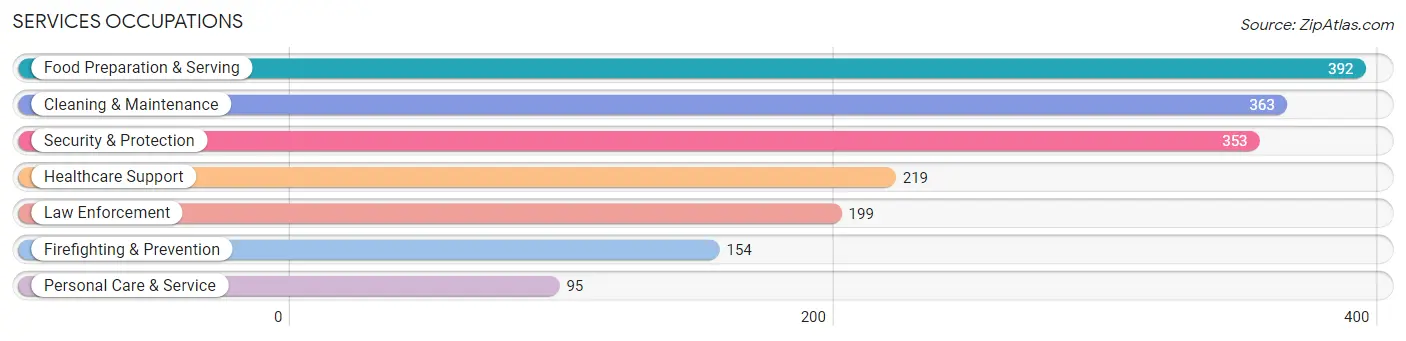
Services Occupations
The most common Services occupations in Southampton County are Food Preparation & Serving (392 | 5.0%), Cleaning & Maintenance (363 | 4.6%), Security & Protection (353 | 4.5%), Healthcare Support (219 | 2.8%), and Law Enforcement (199 | 2.5%).
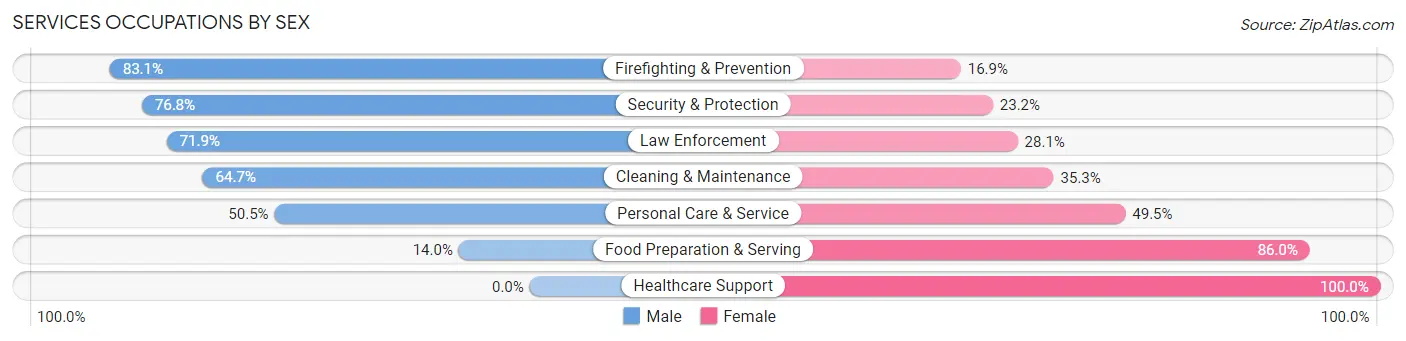
Services Occupations by Sex
Within the Services occupations in Southampton County, the most male-oriented occupations are Firefighting & Prevention (83.1%), Security & Protection (76.8%), and Law Enforcement (71.9%), while the most female-oriented occupations are Healthcare Support (100.0%), Food Preparation & Serving (86.0%), and Personal Care & Service (49.5%).
| Occupation | Male | Female |
| Healthcare Support | 0 (0.0%) | 219 (100.0%) |
| Security & Protection | 271 (76.8%) | 82 (23.2%) |
| Firefighting & Prevention | 128 (83.1%) | 26 (16.9%) |
| Law Enforcement | 143 (71.9%) | 56 (28.1%) |
| Food Preparation & Serving | 55 (14.0%) | 337 (86.0%) |
| Cleaning & Maintenance | 235 (64.7%) | 128 (35.3%) |
| Personal Care & Service | 48 (50.5%) | 47 (49.5%) |
| Total (Category) | 609 (42.8%) | 813 (57.2%) |
| Total (Overall) | 4,041 (51.6%) | 3,797 (48.4%) |
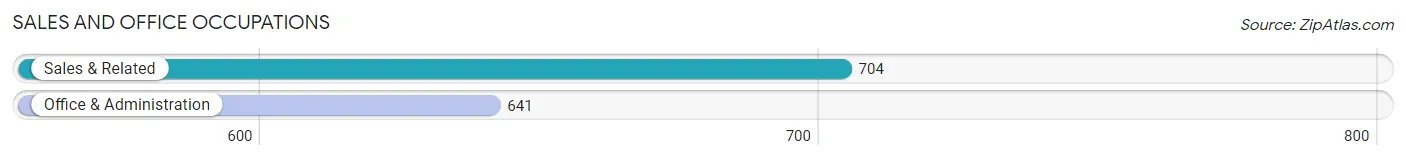
Sales and Office Occupations
The most common Sales and Office occupations in Southampton County are Sales & Related (704 | 9.0%), and Office & Administration (641 | 8.2%).
Sales and Office Occupations by Sex
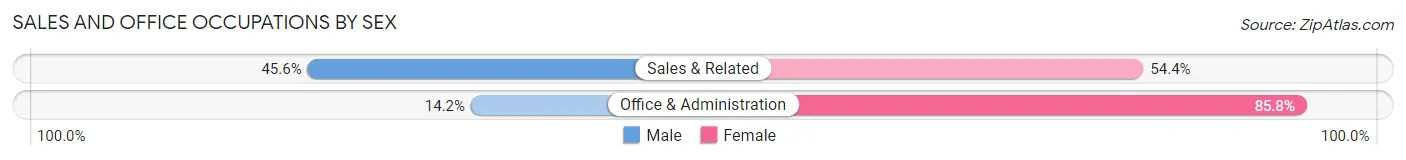
| Occupation | Male | Female |
| Sales & Related | 321 (45.6%) | 383 (54.4%) |
| Office & Administration | 91 (14.2%) | 550 (85.8%) |
| Total (Category) | 412 (30.6%) | 933 (69.4%) |
| Total (Overall) | 4,041 (51.6%) | 3,797 (48.4%) |
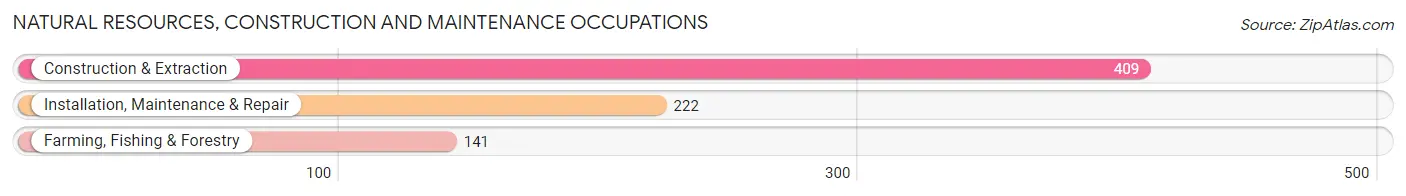
Natural Resources, Construction and Maintenance Occupations
The most common Natural Resources, Construction and Maintenance occupations in Southampton County are Construction & Extraction (409 | 5.2%), Installation, Maintenance & Repair (222 | 2.8%), and Farming, Fishing & Forestry (141 | 1.8%).
Natural Resources, Construction and Maintenance Occupations by Sex
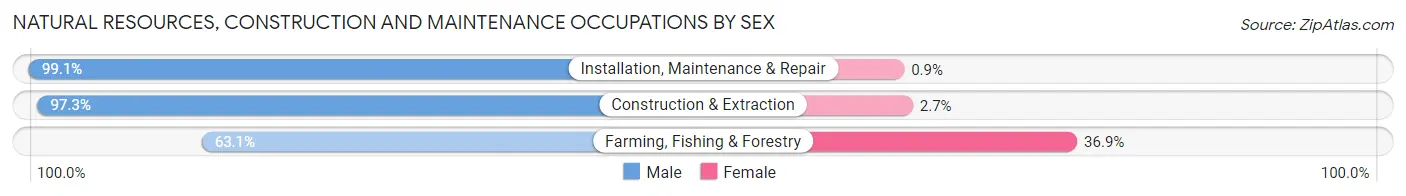
| Occupation | Male | Female |
| Farming, Fishing & Forestry | 89 (63.1%) | 52 (36.9%) |
| Construction & Extraction | 398 (97.3%) | 11 (2.7%) |
| Installation, Maintenance & Repair | 220 (99.1%) | 2 (0.9%) |
| Total (Category) | 707 (91.6%) | 65 (8.4%) |
| Total (Overall) | 4,041 (51.6%) | 3,797 (48.4%) |
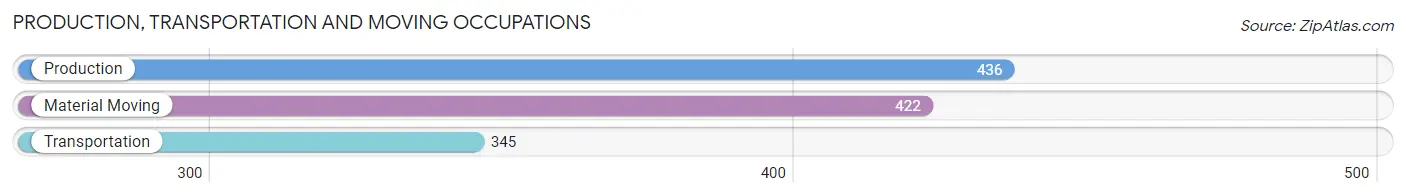
Production, Transportation and Moving Occupations
The most common Production, Transportation and Moving occupations in Southampton County are Production (436 | 5.6%), Material Moving (422 | 5.4%), and Transportation (345 | 4.4%).
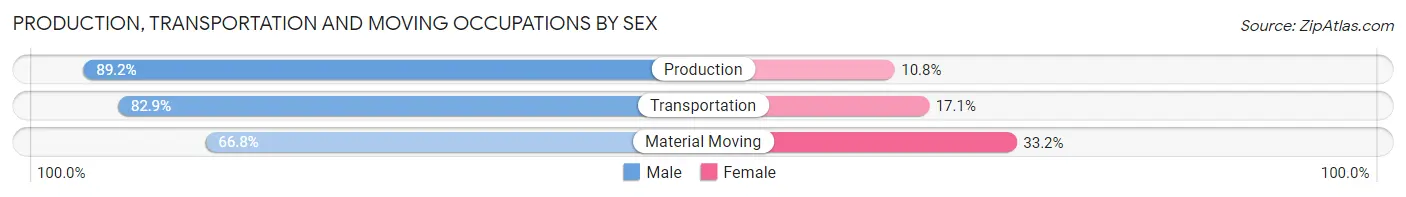
Production, Transportation and Moving Occupations by Sex
| Occupation | Male | Female |
| Production | 389 (89.2%) | 47 (10.8%) |
| Transportation | 286 (82.9%) | 59 (17.1%) |
| Material Moving | 282 (66.8%) | 140 (33.2%) |
| Total (Category) | 957 (79.5%) | 246 (20.4%) |
| Total (Overall) | 4,041 (51.6%) | 3,797 (48.4%) |
Employment Industries by Sex in Southampton County
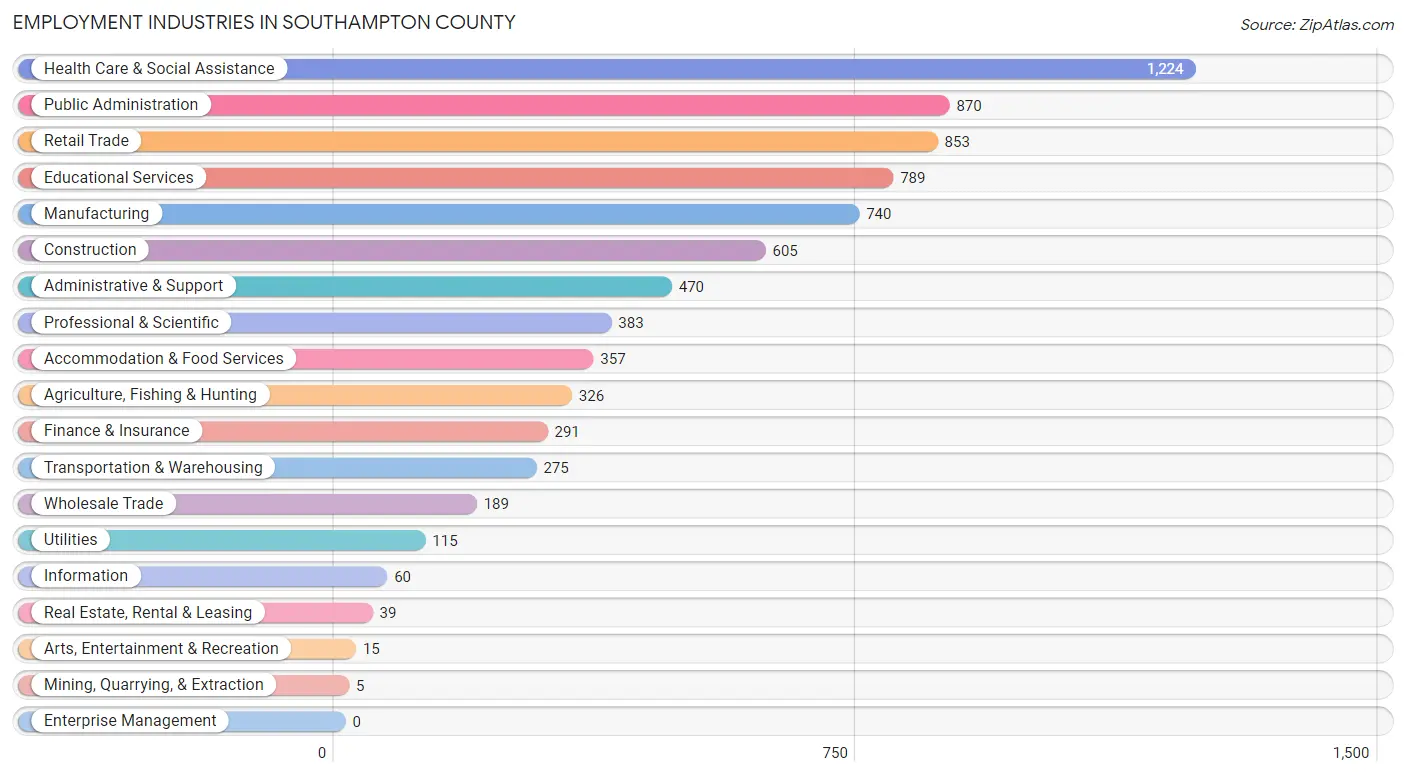
Employment Industries in Southampton County
The major employment industries in Southampton County include Health Care & Social Assistance (1,224 | 15.6%), Public Administration (870 | 11.1%), Retail Trade (853 | 10.9%), Educational Services (789 | 10.1%), and Manufacturing (740 | 9.4%).
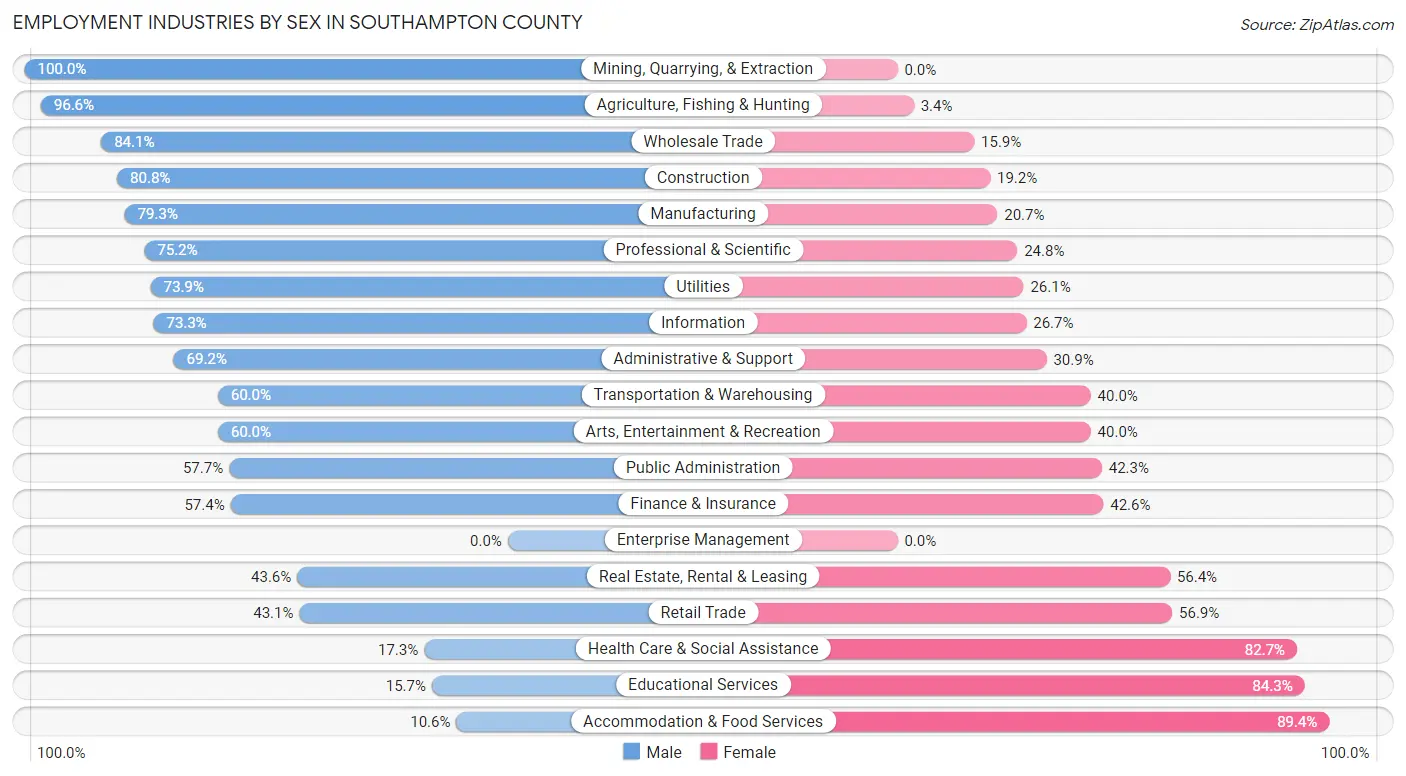
Employment Industries by Sex in Southampton County
The Southampton County industries that see more men than women are Mining, Quarrying, & Extraction (100.0%), Agriculture, Fishing & Hunting (96.6%), and Wholesale Trade (84.1%), whereas the industries that tend to have a higher number of women are Accommodation & Food Services (89.4%), Educational Services (84.3%), and Health Care & Social Assistance (82.7%).
| Industry | Male | Female |
| Agriculture, Fishing & Hunting | 315 (96.6%) | 11 (3.4%) |
| Mining, Quarrying, & Extraction | 5 (100.0%) | 0 (0.0%) |
| Construction | 489 (80.8%) | 116 (19.2%) |
| Manufacturing | 587 (79.3%) | 153 (20.7%) |
| Wholesale Trade | 159 (84.1%) | 30 (15.9%) |
| Retail Trade | 368 (43.1%) | 485 (56.9%) |
| Transportation & Warehousing | 165 (60.0%) | 110 (40.0%) |
| Utilities | 85 (73.9%) | 30 (26.1%) |
| Information | 44 (73.3%) | 16 (26.7%) |
| Finance & Insurance | 167 (57.4%) | 124 (42.6%) |
| Real Estate, Rental & Leasing | 17 (43.6%) | 22 (56.4%) |
| Professional & Scientific | 288 (75.2%) | 95 (24.8%) |
| Enterprise Management | 0 (0.0%) | 0 (0.0%) |
| Administrative & Support | 325 (69.2%) | 145 (30.8%) |
| Educational Services | 124 (15.7%) | 665 (84.3%) |
| Health Care & Social Assistance | 212 (17.3%) | 1,012 (82.7%) |
| Arts, Entertainment & Recreation | 9 (60.0%) | 6 (40.0%) |
| Accommodation & Food Services | 38 (10.6%) | 319 (89.4%) |
| Public Administration | 502 (57.7%) | 368 (42.3%) |
| Total | 4,041 (51.6%) | 3,797 (48.4%) |
Education in Southampton County
School Enrollment in Southampton County
The most common levels of schooling among the 3,473 students in Southampton County are middle school (839 | 24.2%), high school (759 | 21.8%), and elementary school (744 | 21.4%).
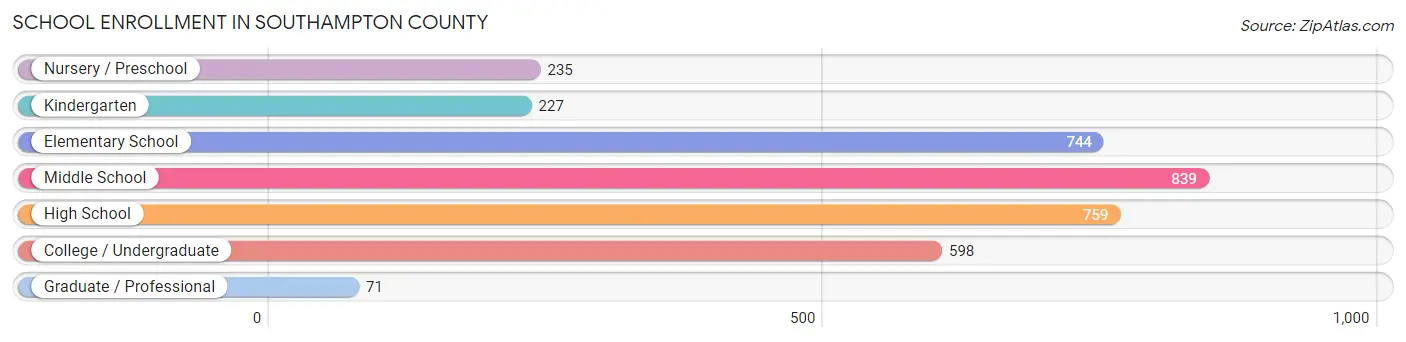
| School Level | # Students | % Students |
| Nursery / Preschool | 235 | 6.8% |
| Kindergarten | 227 | 6.5% |
| Elementary School | 744 | 21.4% |
| Middle School | 839 | 24.2% |
| High School | 759 | 21.8% |
| College / Undergraduate | 598 | 17.2% |
| Graduate / Professional | 71 | 2.0% |
| Total | 3,473 | 100.0% |
School Enrollment by Age by Funding Source in Southampton County
Out of a total of 3,473 students who are enrolled in schools in Southampton County, 559 (16.1%) attend a private institution, while the remaining 2,914 (83.9%) are enrolled in public schools. The age group of 3 to 4 year olds has the highest likelihood of being enrolled in private schools, with 51 (42.1% in the age bracket) enrolled. Conversely, the age group of 35 years and over has the lowest likelihood of being enrolled in a private school, with 207 (92.4% in the age bracket) attending a public institution.
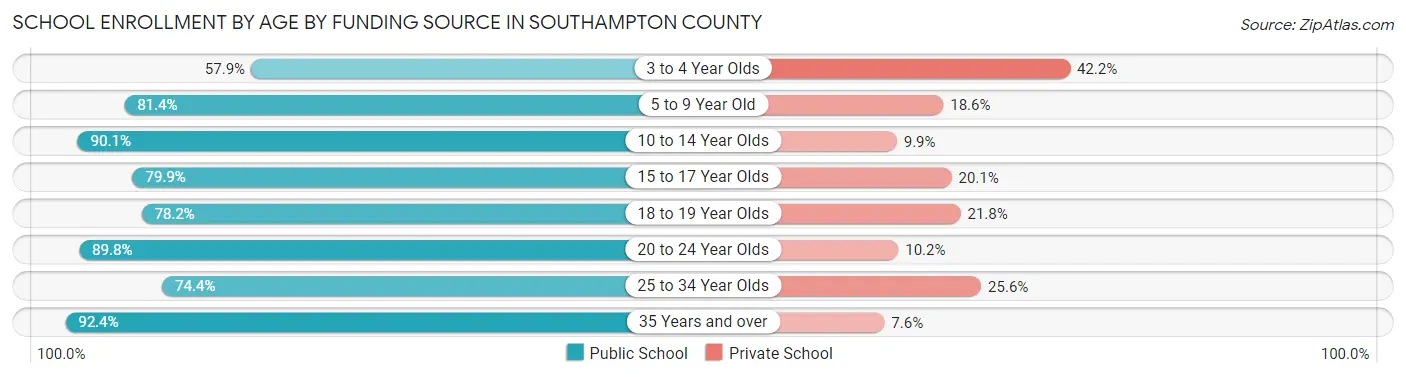
| Age Bracket | Public School | Private School |
| 3 to 4 Year Olds | 70 (57.9%) | 51 (42.1%) |
| 5 to 9 Year Old | 768 (81.4%) | 175 (18.6%) |
| 10 to 14 Year Olds | 856 (90.1%) | 94 (9.9%) |
| 15 to 17 Year Olds | 529 (79.9%) | 133 (20.1%) |
| 18 to 19 Year Olds | 115 (78.2%) | 32 (21.8%) |
| 20 to 24 Year Olds | 309 (89.8%) | 35 (10.2%) |
| 25 to 34 Year Olds | 61 (74.4%) | 21 (25.6%) |
| 35 Years and over | 207 (92.4%) | 17 (7.6%) |
| Total | 2,914 (83.9%) | 559 (16.1%) |
Educational Attainment by Field of Study in Southampton County
Education (489 | 18.8%), business (446 | 17.2%), arts & humanities (323 | 12.4%), science & technology (258 | 9.9%), and visual & performing arts (159 | 6.1%) are the most common fields of study among 2,601 individuals in Southampton County who have obtained a bachelor's degree or higher.
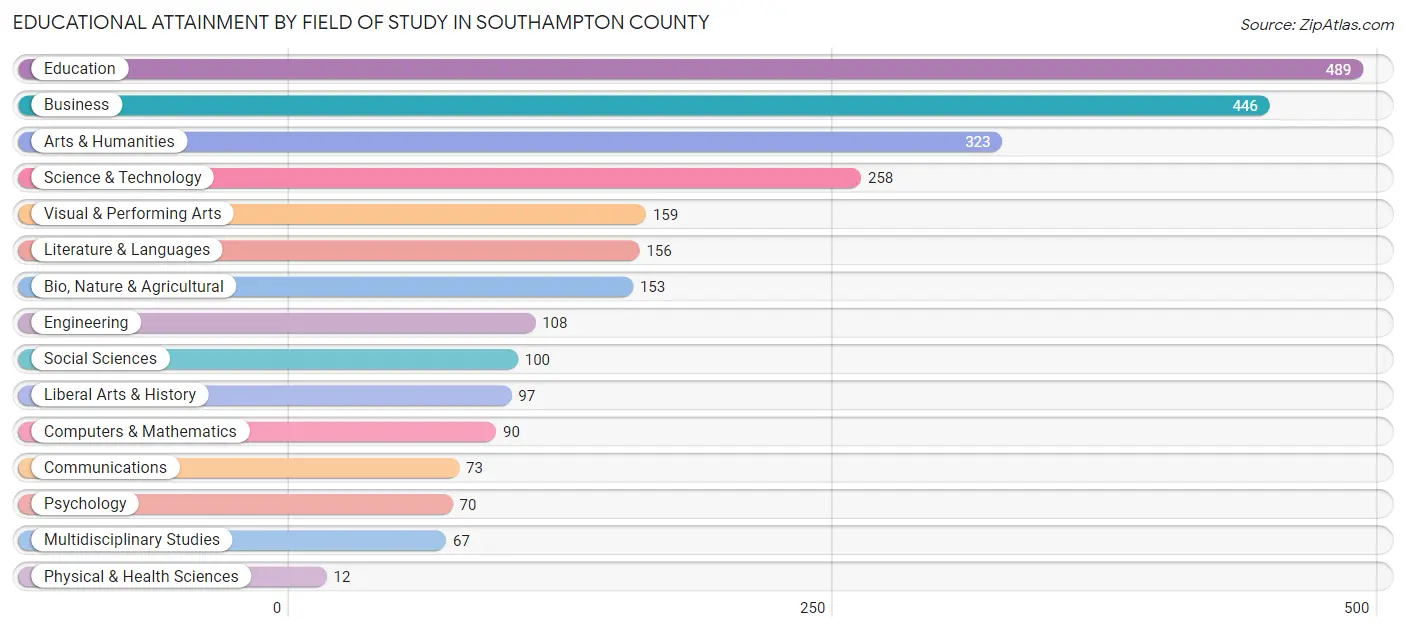
| Field of Study | # Graduates | % Graduates |
| Computers & Mathematics | 90 | 3.5% |
| Bio, Nature & Agricultural | 153 | 5.9% |
| Physical & Health Sciences | 12 | 0.5% |
| Psychology | 70 | 2.7% |
| Social Sciences | 100 | 3.8% |
| Engineering | 108 | 4.2% |
| Multidisciplinary Studies | 67 | 2.6% |
| Science & Technology | 258 | 9.9% |
| Business | 446 | 17.2% |
| Education | 489 | 18.8% |
| Literature & Languages | 156 | 6.0% |
| Liberal Arts & History | 97 | 3.7% |
| Visual & Performing Arts | 159 | 6.1% |
| Communications | 73 | 2.8% |
| Arts & Humanities | 323 | 12.4% |
| Total | 2,601 | 100.0% |
Transportation & Commute in Southampton County
Vehicle Availability by Sex in Southampton County
The most prevalent vehicle ownership categories in Southampton County are males with 3 vehicles (1,283, accounting for 31.7%) and females with 3 vehicles (864, making up 33.9%).
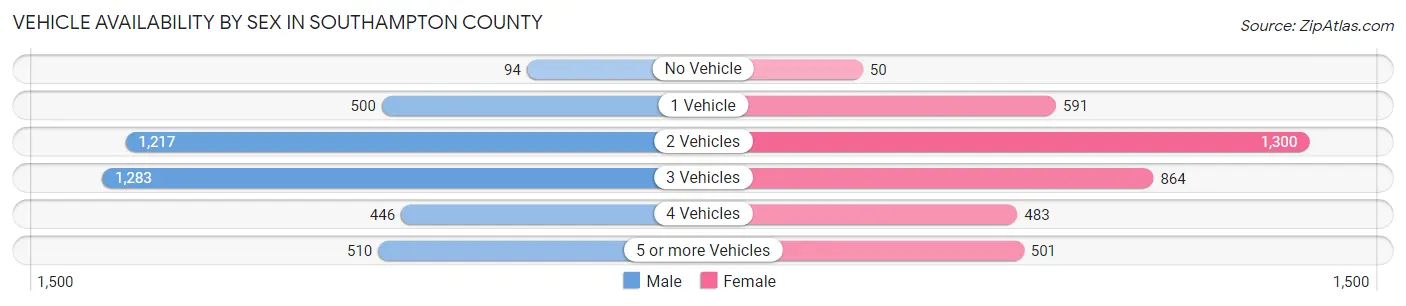
| Vehicles Available | Male | Female |
| No Vehicle | 94 (2.3%) | 50 (1.3%) |
| 1 Vehicle | 500 (12.3%) | 591 (15.6%) |
| 2 Vehicles | 1,217 (30.0%) | 1,300 (34.3%) |
| 3 Vehicles | 1,283 (31.7%) | 864 (22.8%) |
| 4 Vehicles | 446 (11.0%) | 483 (12.8%) |
| 5 or more Vehicles | 510 (12.6%) | 501 (13.2%) |
| Total | 4,050 (100.0%) | 3,789 (100.0%) |
Commute Time in Southampton County
The most frequently occuring commute durations in Southampton County are 15 to 19 minutes (1,273 commuters, 17.2%), 60 to 89 minutes (987 commuters, 13.3%), and 30 to 34 minutes (786 commuters, 10.6%).
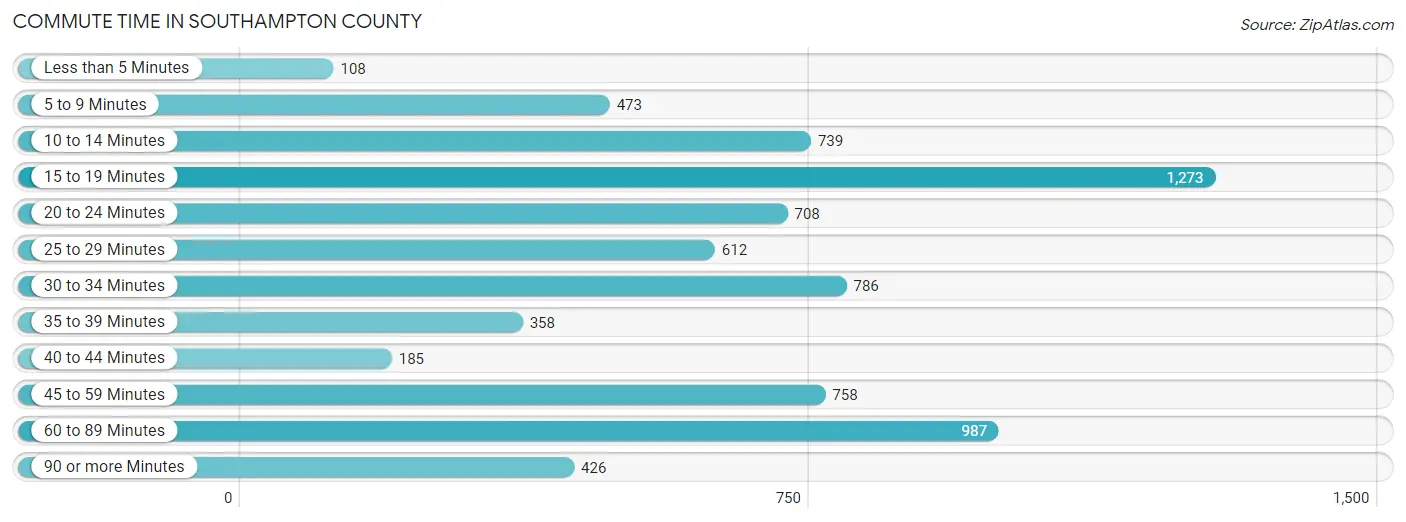
| Commute Time | # Commuters | % Commuters |
| Less than 5 Minutes | 108 | 1.5% |
| 5 to 9 Minutes | 473 | 6.4% |
| 10 to 14 Minutes | 739 | 10.0% |
| 15 to 19 Minutes | 1,273 | 17.2% |
| 20 to 24 Minutes | 708 | 9.6% |
| 25 to 29 Minutes | 612 | 8.3% |
| 30 to 34 Minutes | 786 | 10.6% |
| 35 to 39 Minutes | 358 | 4.8% |
| 40 to 44 Minutes | 185 | 2.5% |
| 45 to 59 Minutes | 758 | 10.2% |
| 60 to 89 Minutes | 987 | 13.3% |
| 90 or more Minutes | 426 | 5.8% |
Commute Time by Sex in Southampton County
The most common commute times in Southampton County are 60 to 89 minutes (672 commuters, 17.6%) for males and 15 to 19 minutes (734 commuters, 20.4%) for females.
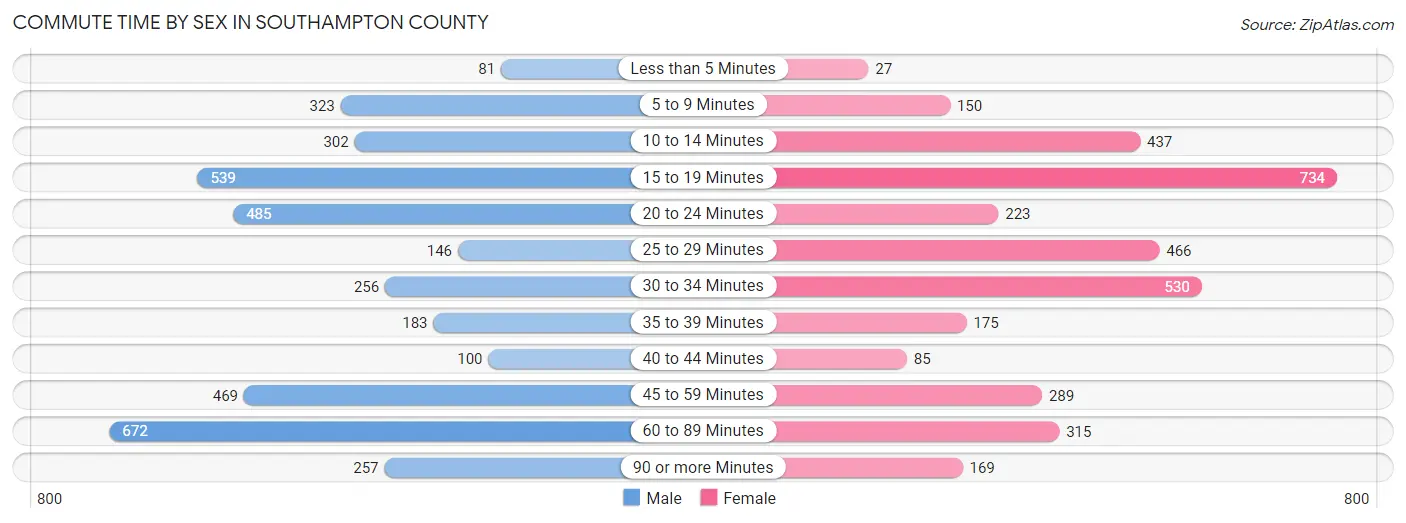
| Commute Time | Male | Female |
| Less than 5 Minutes | 81 (2.1%) | 27 (0.7%) |
| 5 to 9 Minutes | 323 (8.5%) | 150 (4.2%) |
| 10 to 14 Minutes | 302 (7.9%) | 437 (12.1%) |
| 15 to 19 Minutes | 539 (14.1%) | 734 (20.4%) |
| 20 to 24 Minutes | 485 (12.7%) | 223 (6.2%) |
| 25 to 29 Minutes | 146 (3.8%) | 466 (12.9%) |
| 30 to 34 Minutes | 256 (6.7%) | 530 (14.7%) |
| 35 to 39 Minutes | 183 (4.8%) | 175 (4.9%) |
| 40 to 44 Minutes | 100 (2.6%) | 85 (2.4%) |
| 45 to 59 Minutes | 469 (12.3%) | 289 (8.0%) |
| 60 to 89 Minutes | 672 (17.6%) | 315 (8.7%) |
| 90 or more Minutes | 257 (6.7%) | 169 (4.7%) |
Time of Departure to Work by Sex in Southampton County
The most frequent times of departure to work in Southampton County are 7:00 AM to 7:29 AM (675, 17.7%) for males and 7:00 AM to 7:29 AM (583, 16.2%) for females.
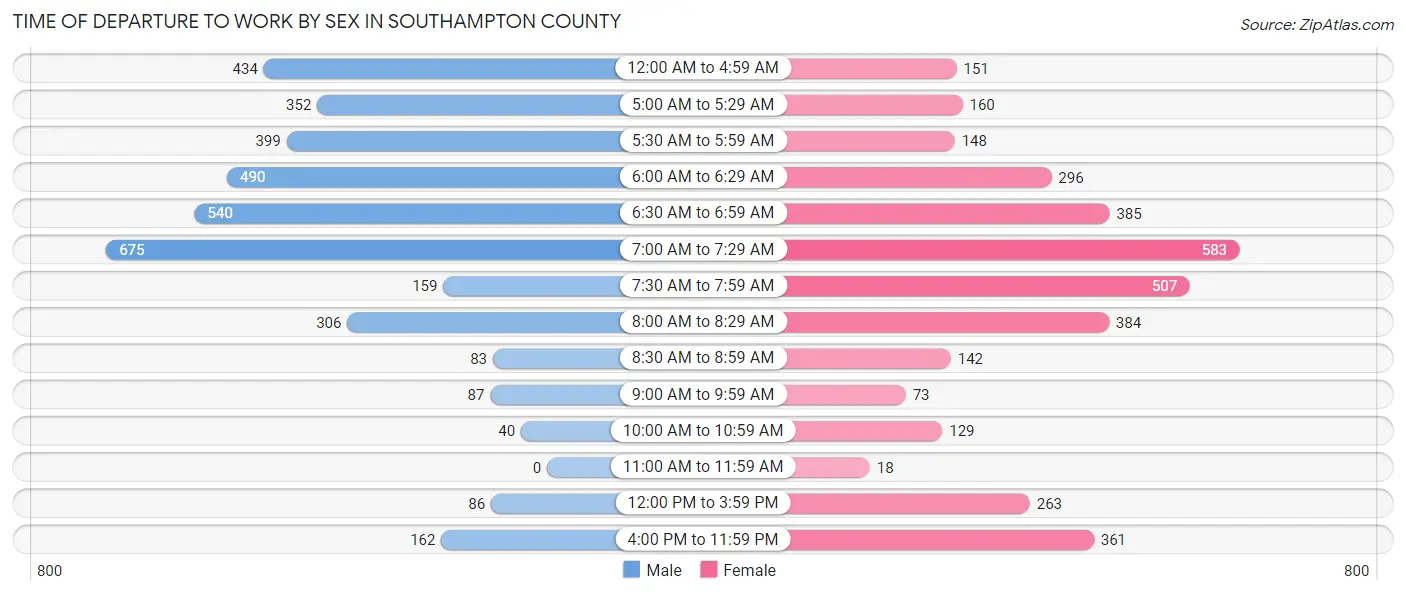
| Time of Departure | Male | Female |
| 12:00 AM to 4:59 AM | 434 (11.4%) | 151 (4.2%) |
| 5:00 AM to 5:29 AM | 352 (9.2%) | 160 (4.4%) |
| 5:30 AM to 5:59 AM | 399 (10.5%) | 148 (4.1%) |
| 6:00 AM to 6:29 AM | 490 (12.9%) | 296 (8.2%) |
| 6:30 AM to 6:59 AM | 540 (14.2%) | 385 (10.7%) |
| 7:00 AM to 7:29 AM | 675 (17.7%) | 583 (16.2%) |
| 7:30 AM to 7:59 AM | 159 (4.2%) | 507 (14.1%) |
| 8:00 AM to 8:29 AM | 306 (8.0%) | 384 (10.7%) |
| 8:30 AM to 8:59 AM | 83 (2.2%) | 142 (3.9%) |
| 9:00 AM to 9:59 AM | 87 (2.3%) | 73 (2.0%) |
| 10:00 AM to 10:59 AM | 40 (1.1%) | 129 (3.6%) |
| 11:00 AM to 11:59 AM | 0 (0.0%) | 18 (0.5%) |
| 12:00 PM to 3:59 PM | 86 (2.3%) | 263 (7.3%) |
| 4:00 PM to 11:59 PM | 162 (4.3%) | 361 (10.0%) |
| Total | 3,813 (100.0%) | 3,600 (100.0%) |
Housing Occupancy in Southampton County
Occupancy by Ownership in Southampton County
Of the total 6,841 dwellings in Southampton County, owner-occupied units account for 5,265 (77.0%), while renter-occupied units make up 1,576 (23.0%).
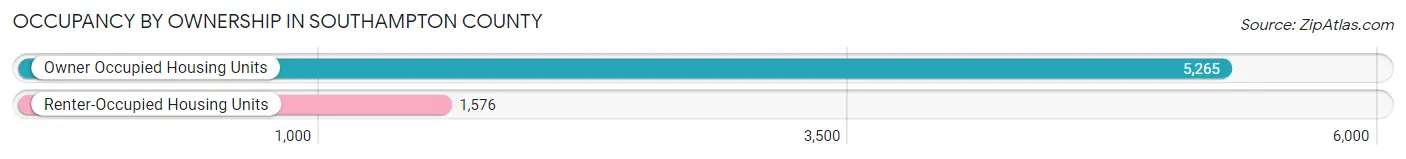
| Occupancy | # Housing Units | % Housing Units |
| Owner Occupied Housing Units | 5,265 | 77.0% |
| Renter-Occupied Housing Units | 1,576 | 23.0% |
| Total Occupied Housing Units | 6,841 | 100.0% |
Occupancy by Household Size in Southampton County
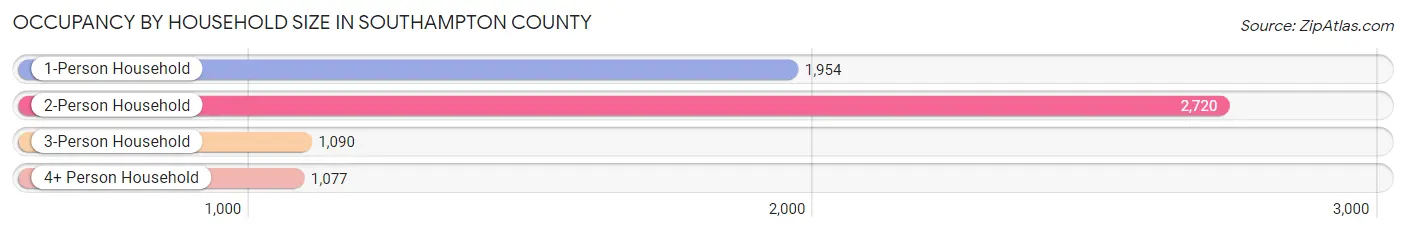
| Household Size | # Housing Units | % Housing Units |
| 1-Person Household | 1,954 | 28.6% |
| 2-Person Household | 2,720 | 39.8% |
| 3-Person Household | 1,090 | 15.9% |
| 4+ Person Household | 1,077 | 15.7% |
| Total Housing Units | 6,841 | 100.0% |
Occupancy by Ownership by Household Size in Southampton County
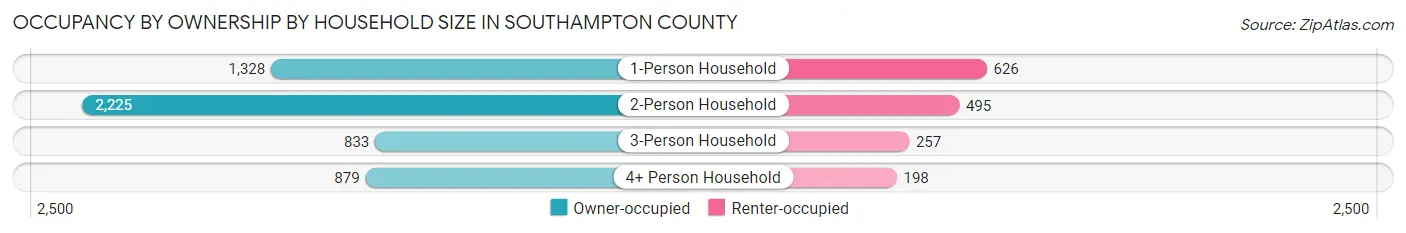
| Household Size | Owner-occupied | Renter-occupied |
| 1-Person Household | 1,328 (68.0%) | 626 (32.0%) |
| 2-Person Household | 2,225 (81.8%) | 495 (18.2%) |
| 3-Person Household | 833 (76.4%) | 257 (23.6%) |
| 4+ Person Household | 879 (81.6%) | 198 (18.4%) |
| Total Housing Units | 5,265 (77.0%) | 1,576 (23.0%) |
Occupancy by Educational Attainment in Southampton County
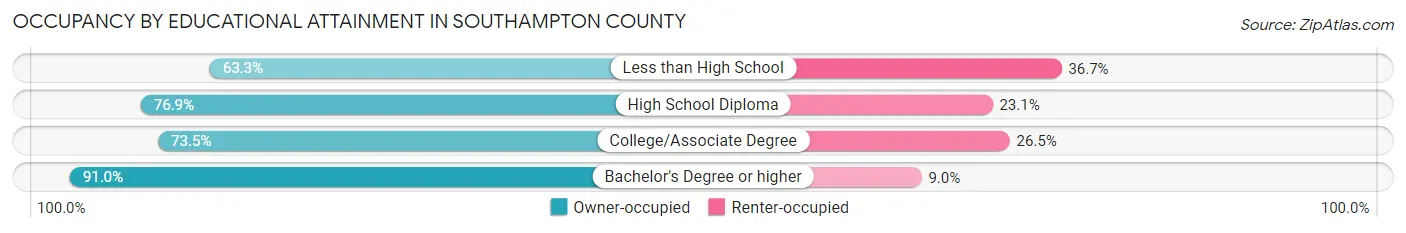
| Household Size | Owner-occupied | Renter-occupied |
| Less than High School | 491 (63.3%) | 285 (36.7%) |
| High School Diploma | 1,465 (76.9%) | 439 (23.1%) |
| College/Associate Degree | 2,011 (73.5%) | 724 (26.5%) |
| Bachelor's Degree or higher | 1,298 (91.0%) | 128 (9.0%) |
Occupancy by Age of Householder in Southampton County
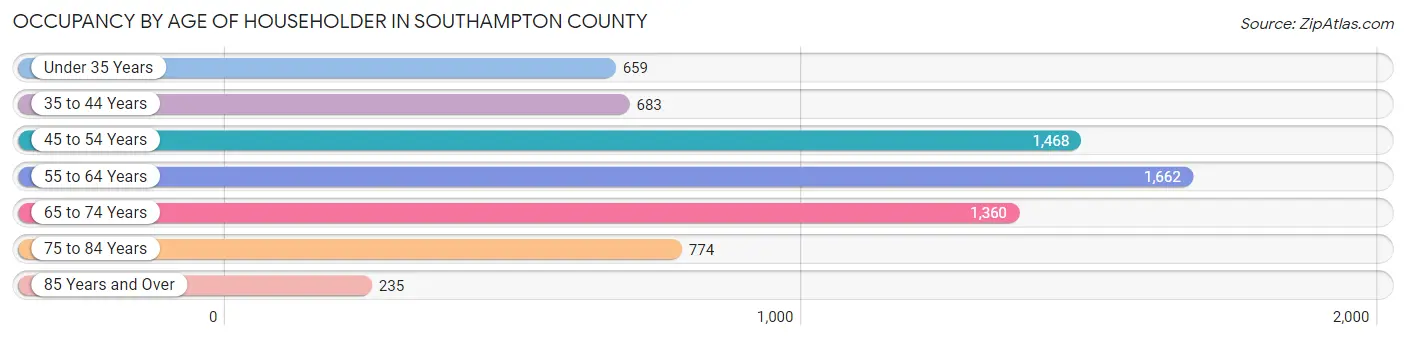
| Age Bracket | # Households | % Households |
| Under 35 Years | 659 | 9.6% |
| 35 to 44 Years | 683 | 10.0% |
| 45 to 54 Years | 1,468 | 21.5% |
| 55 to 64 Years | 1,662 | 24.3% |
| 65 to 74 Years | 1,360 | 19.9% |
| 75 to 84 Years | 774 | 11.3% |
| 85 Years and Over | 235 | 3.4% |
| Total | 6,841 | 100.0% |
Housing Finances in Southampton County
Median Income by Occupancy in Southampton County
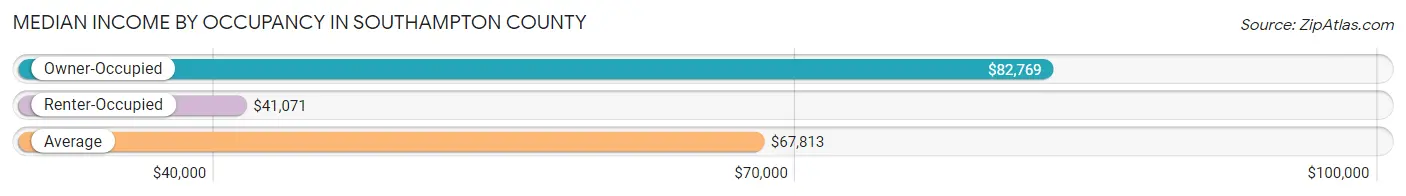
| Occupancy Type | # Households | Median Income |
| Owner-Occupied | 5,265 (77.0%) | $82,769 |
| Renter-Occupied | 1,576 (23.0%) | $41,071 |
| Average | 6,841 (100.0%) | $67,813 |
Occupancy by Householder Income Bracket in Southampton County
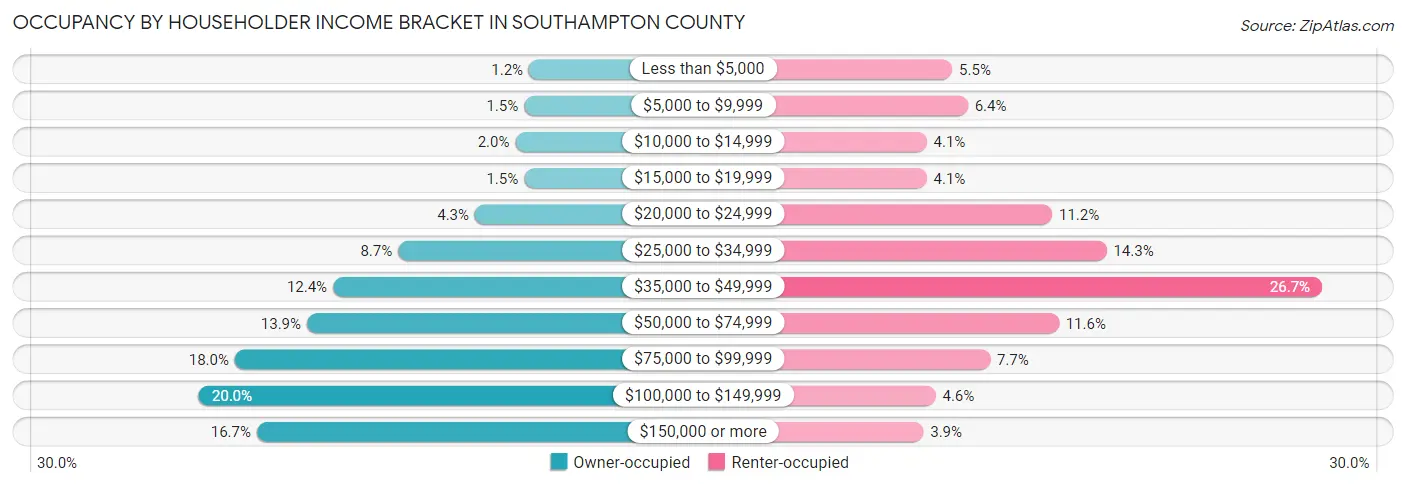
| Income Bracket | Owner-occupied | Renter-occupied |
| Less than $5,000 | 62 (1.2%) | 87 (5.5%) |
| $5,000 to $9,999 | 77 (1.5%) | 101 (6.4%) |
| $10,000 to $14,999 | 103 (2.0%) | 64 (4.1%) |
| $15,000 to $19,999 | 77 (1.5%) | 64 (4.1%) |
| $20,000 to $24,999 | 225 (4.3%) | 177 (11.2%) |
| $25,000 to $34,999 | 456 (8.7%) | 226 (14.3%) |
| $35,000 to $49,999 | 652 (12.4%) | 420 (26.7%) |
| $50,000 to $74,999 | 730 (13.9%) | 183 (11.6%) |
| $75,000 to $99,999 | 947 (18.0%) | 121 (7.7%) |
| $100,000 to $149,999 | 1,055 (20.0%) | 72 (4.6%) |
| $150,000 or more | 881 (16.7%) | 61 (3.9%) |
| Total | 5,265 (100.0%) | 1,576 (100.0%) |
Monthly Housing Cost Tiers in Southampton County
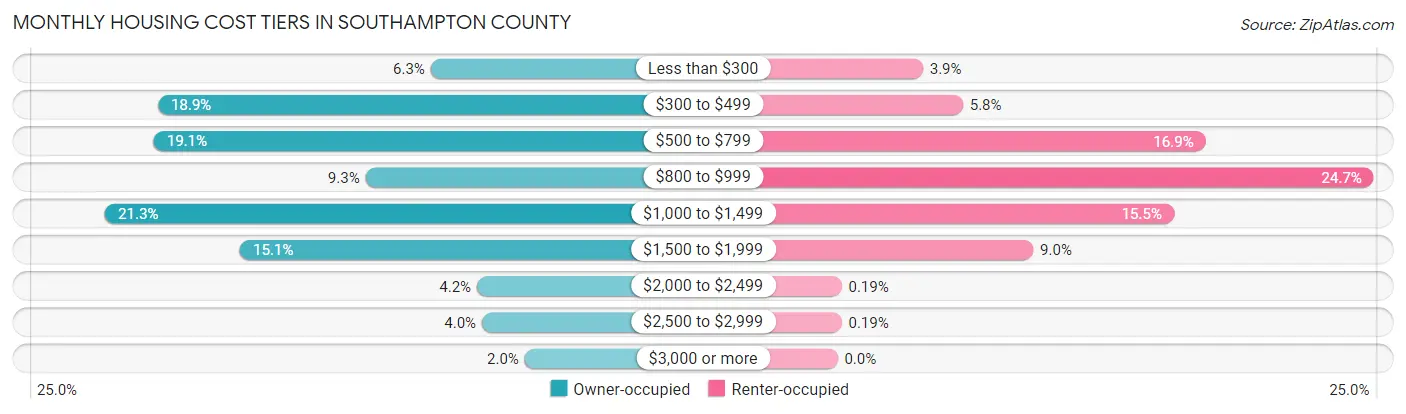
| Monthly Cost | Owner-occupied | Renter-occupied |
| Less than $300 | 332 (6.3%) | 62 (3.9%) |
| $300 to $499 | 993 (18.9%) | 91 (5.8%) |
| $500 to $799 | 1,003 (19.1%) | 267 (16.9%) |
| $800 to $999 | 490 (9.3%) | 389 (24.7%) |
| $1,000 to $1,499 | 1,121 (21.3%) | 244 (15.5%) |
| $1,500 to $1,999 | 794 (15.1%) | 142 (9.0%) |
| $2,000 to $2,499 | 220 (4.2%) | 3 (0.2%) |
| $2,500 to $2,999 | 208 (4.0%) | 3 (0.2%) |
| $3,000 or more | 104 (2.0%) | 0 (0.0%) |
| Total | 5,265 (100.0%) | 1,576 (100.0%) |
Physical Housing Characteristics in Southampton County
Housing Structures in Southampton County
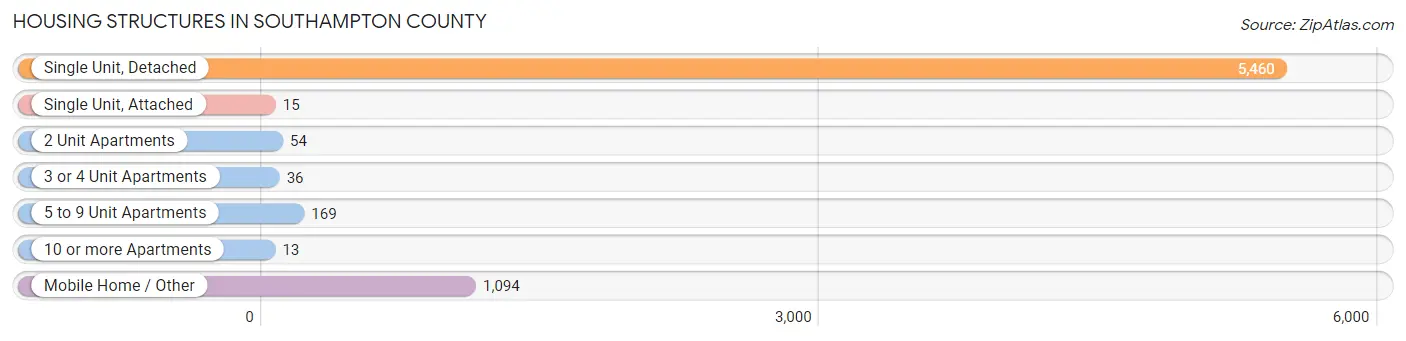
| Structure Type | # Housing Units | % Housing Units |
| Single Unit, Detached | 5,460 | 79.8% |
| Single Unit, Attached | 15 | 0.2% |
| 2 Unit Apartments | 54 | 0.8% |
| 3 or 4 Unit Apartments | 36 | 0.5% |
| 5 to 9 Unit Apartments | 169 | 2.5% |
| 10 or more Apartments | 13 | 0.2% |
| Mobile Home / Other | 1,094 | 16.0% |
| Total | 6,841 | 100.0% |
Housing Structures by Occupancy in Southampton County
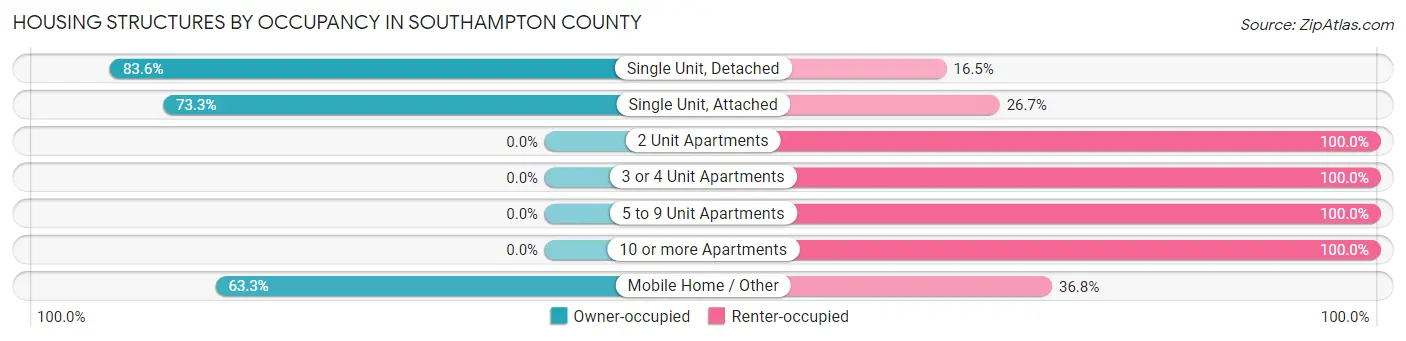
| Structure Type | Owner-occupied | Renter-occupied |
| Single Unit, Detached | 4,562 (83.6%) | 898 (16.5%) |
| Single Unit, Attached | 11 (73.3%) | 4 (26.7%) |
| 2 Unit Apartments | 0 (0.0%) | 54 (100.0%) |
| 3 or 4 Unit Apartments | 0 (0.0%) | 36 (100.0%) |
| 5 to 9 Unit Apartments | 0 (0.0%) | 169 (100.0%) |
| 10 or more Apartments | 0 (0.0%) | 13 (100.0%) |
| Mobile Home / Other | 692 (63.2%) | 402 (36.7%) |
| Total | 5,265 (77.0%) | 1,576 (23.0%) |
Housing Structures by Number of Rooms in Southampton County
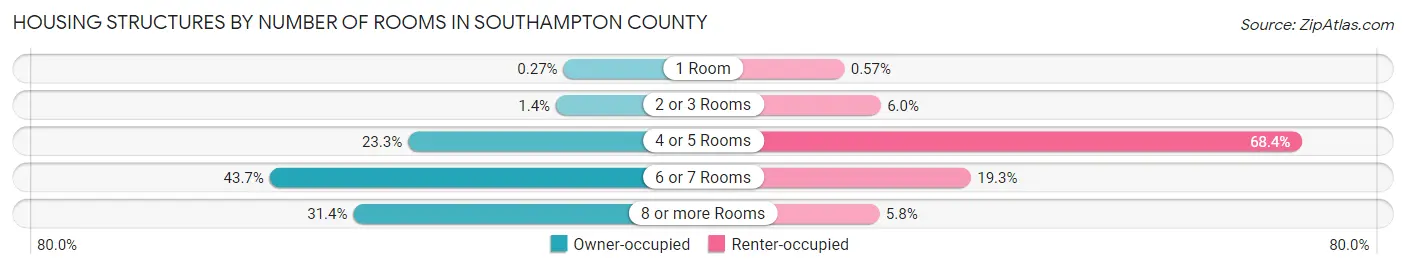
| Number of Rooms | Owner-occupied | Renter-occupied |
| 1 Room | 14 (0.3%) | 9 (0.6%) |
| 2 or 3 Rooms | 72 (1.4%) | 94 (6.0%) |
| 4 or 5 Rooms | 1,225 (23.3%) | 1,078 (68.4%) |
| 6 or 7 Rooms | 2,303 (43.7%) | 304 (19.3%) |
| 8 or more Rooms | 1,651 (31.4%) | 91 (5.8%) |
| Total | 5,265 (100.0%) | 1,576 (100.0%) |
Housing Structure by Heating Type in Southampton County
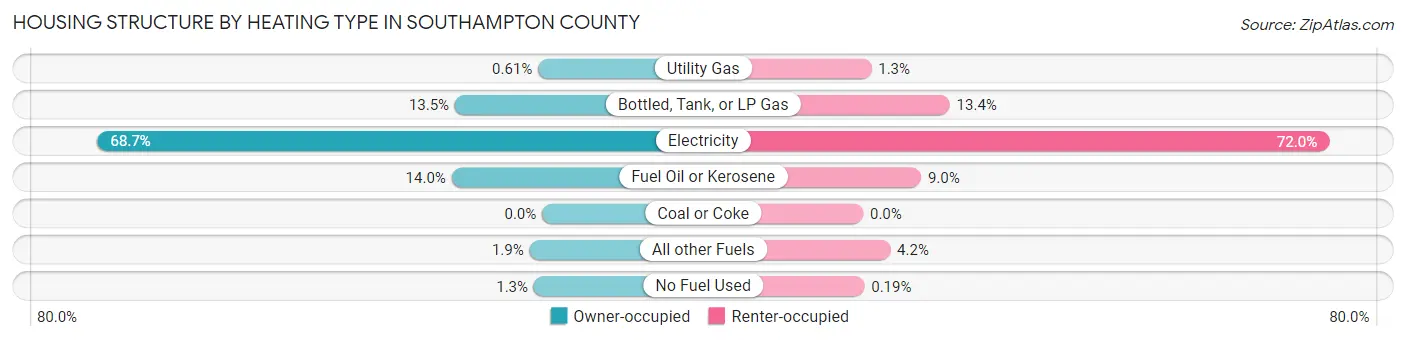
| Heating Type | Owner-occupied | Renter-occupied |
| Utility Gas | 32 (0.6%) | 20 (1.3%) |
| Bottled, Tank, or LP Gas | 709 (13.5%) | 211 (13.4%) |
| Electricity | 3,619 (68.7%) | 1,135 (72.0%) |
| Fuel Oil or Kerosene | 736 (14.0%) | 141 (8.9%) |
| Coal or Coke | 0 (0.0%) | 0 (0.0%) |
| All other Fuels | 102 (1.9%) | 66 (4.2%) |
| No Fuel Used | 67 (1.3%) | 3 (0.2%) |
| Total | 5,265 (100.0%) | 1,576 (100.0%) |
Household Vehicle Usage in Southampton County
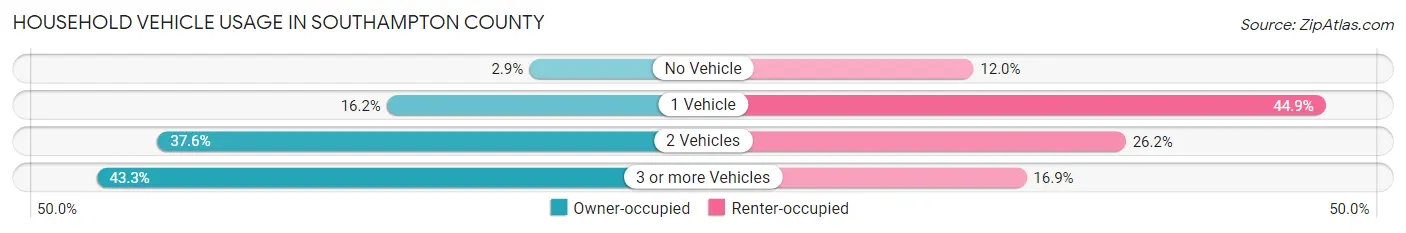
| Vehicles per Household | Owner-occupied | Renter-occupied |
| No Vehicle | 153 (2.9%) | 189 (12.0%) |
| 1 Vehicle | 853 (16.2%) | 707 (44.9%) |
| 2 Vehicles | 1,980 (37.6%) | 413 (26.2%) |
| 3 or more Vehicles | 2,279 (43.3%) | 267 (16.9%) |
| Total | 5,265 (100.0%) | 1,576 (100.0%) |
Real Estate & Mortgages in Southampton County
Real Estate and Mortgage Overview in Southampton County
| Characteristic | Without Mortgage | With Mortgage |
| Housing Units | 2,294 | 2,971 |
| Median Property Value | $185,700 | $209,000 |
| Median Household Income | $64,375 | $691 |
| Monthly Housing Costs | $446 | $104 |
| Real Estate Taxes | $1,210 | $37 |
Property Value by Mortgage Status in Southampton County
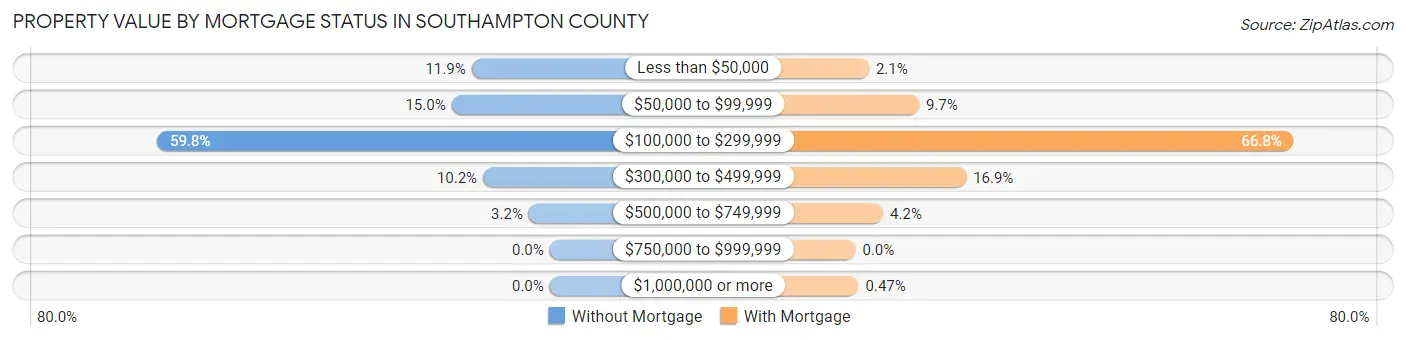
| Property Value | Without Mortgage | With Mortgage |
| Less than $50,000 | 273 (11.9%) | 61 (2.1%) |
| $50,000 to $99,999 | 343 (14.9%) | 287 (9.7%) |
| $100,000 to $299,999 | 1,372 (59.8%) | 1,983 (66.7%) |
| $300,000 to $499,999 | 233 (10.2%) | 501 (16.9%) |
| $500,000 to $749,999 | 73 (3.2%) | 125 (4.2%) |
| $750,000 to $999,999 | 0 (0.0%) | 0 (0.0%) |
| $1,000,000 or more | 0 (0.0%) | 14 (0.5%) |
| Total | 2,294 (100.0%) | 2,971 (100.0%) |
Household Income by Mortgage Status in Southampton County
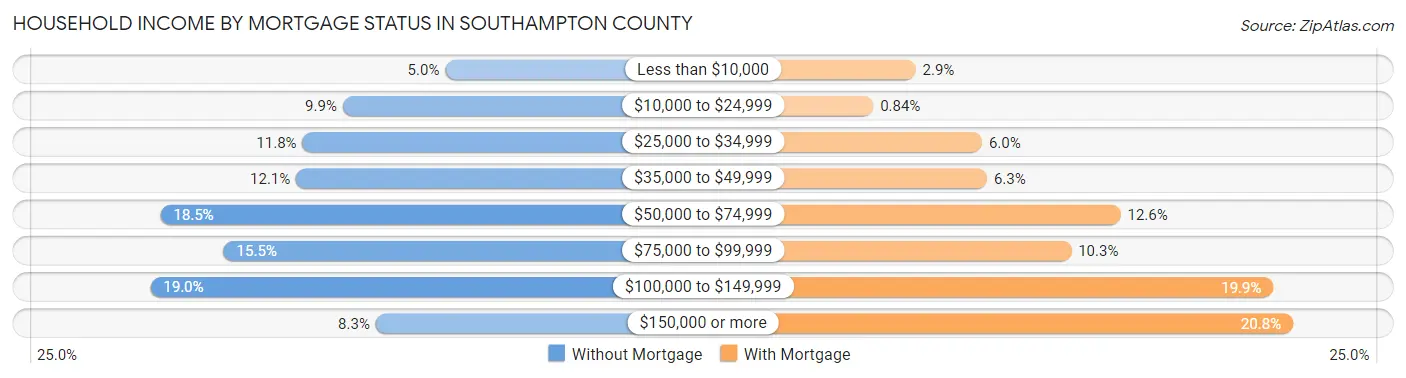
| Household Income | Without Mortgage | With Mortgage |
| Less than $10,000 | 114 (5.0%) | 85 (2.9%) |
| $10,000 to $24,999 | 226 (9.9%) | 25 (0.8%) |
| $25,000 to $34,999 | 270 (11.8%) | 179 (6.0%) |
| $35,000 to $49,999 | 277 (12.1%) | 186 (6.3%) |
| $50,000 to $74,999 | 425 (18.5%) | 375 (12.6%) |
| $75,000 to $99,999 | 356 (15.5%) | 305 (10.3%) |
| $100,000 to $149,999 | 436 (19.0%) | 591 (19.9%) |
| $150,000 or more | 190 (8.3%) | 619 (20.8%) |
| Total | 2,294 (100.0%) | 2,971 (100.0%) |
Property Value to Household Income Ratio in Southampton County
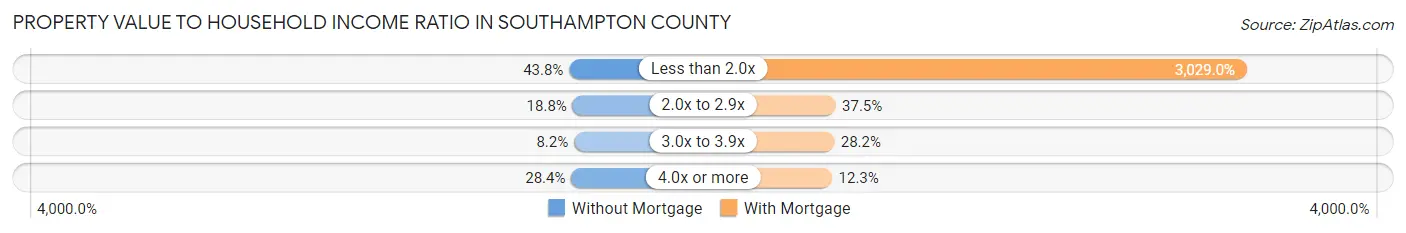
| Value-to-Income Ratio | Without Mortgage | With Mortgage |
| Less than 2.0x | 1,004 (43.8%) | 89,990 (3,029.0%) |
| 2.0x to 2.9x | 431 (18.8%) | 1,113 (37.5%) |
| 3.0x to 3.9x | 189 (8.2%) | 838 (28.2%) |
| 4.0x or more | 651 (28.4%) | 364 (12.2%) |
| Total | 2,294 (100.0%) | 2,971 (100.0%) |
Real Estate Taxes by Mortgage Status in Southampton County
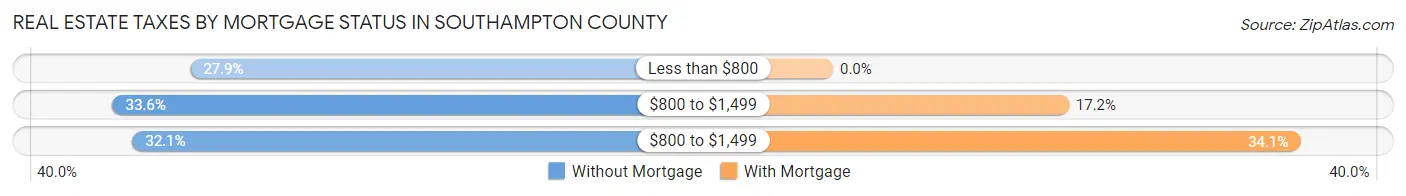
| Property Taxes | Without Mortgage | With Mortgage |
| Less than $800 | 640 (27.9%) | 0 (0.0%) |
| $800 to $1,499 | 770 (33.6%) | 512 (17.2%) |
| $800 to $1,499 | 737 (32.1%) | 1,014 (34.1%) |
| Total | 2,294 (100.0%) | 2,971 (100.0%) |
Health & Disability in Southampton County
Health Insurance Coverage by Age in Southampton County
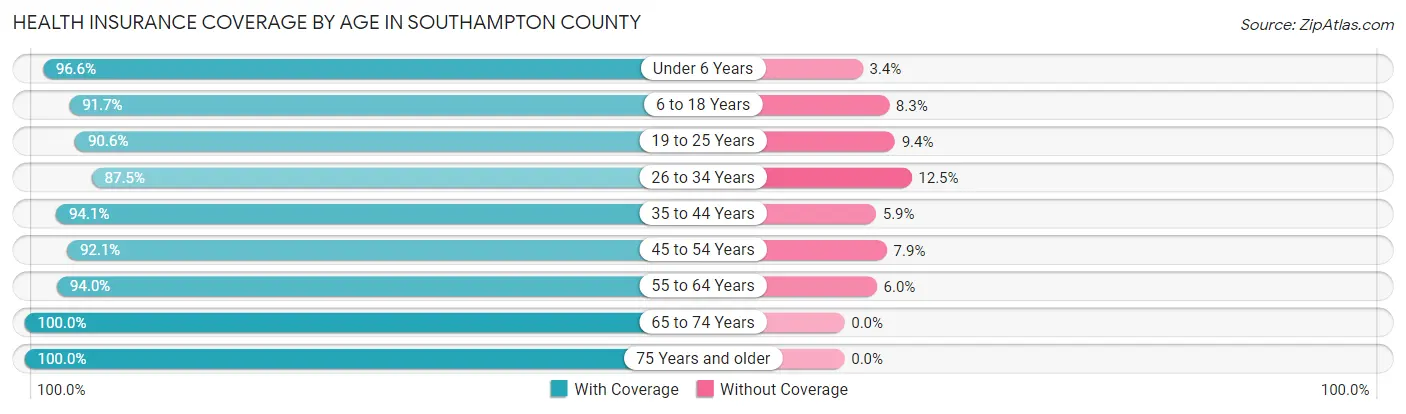
| Age Bracket | With Coverage | Without Coverage |
| Under 6 Years | 966 (96.6%) | 34 (3.4%) |
| 6 to 18 Years | 2,403 (91.7%) | 218 (8.3%) |
| 19 to 25 Years | 1,080 (90.6%) | 112 (9.4%) |
| 26 to 34 Years | 1,302 (87.5%) | 186 (12.5%) |
| 35 to 44 Years | 1,588 (94.1%) | 99 (5.9%) |
| 45 to 54 Years | 2,298 (92.1%) | 197 (7.9%) |
| 55 to 64 Years | 2,464 (94.0%) | 158 (6.0%) |
| 65 to 74 Years | 2,092 (100.0%) | 0 (0.0%) |
| 75 Years and older | 1,417 (100.0%) | 0 (0.0%) |
| Total | 15,610 (94.0%) | 1,004 (6.0%) |
Health Insurance Coverage by Citizenship Status in Southampton County
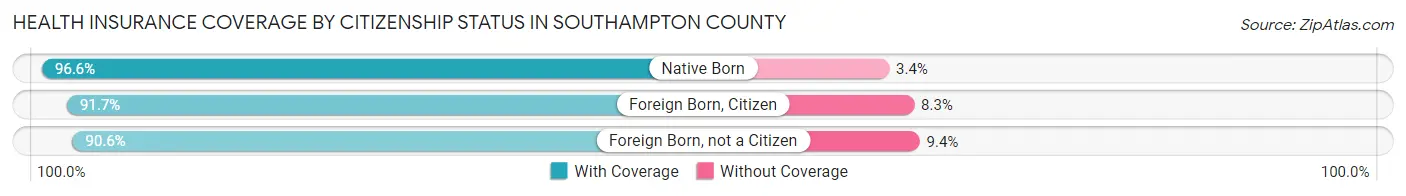
| Citizenship Status | With Coverage | Without Coverage |
| Native Born | 966 (96.6%) | 34 (3.4%) |
| Foreign Born, Citizen | 2,403 (91.7%) | 218 (8.3%) |
| Foreign Born, not a Citizen | 1,080 (90.6%) | 112 (9.4%) |
Health Insurance Coverage by Household Income in Southampton County
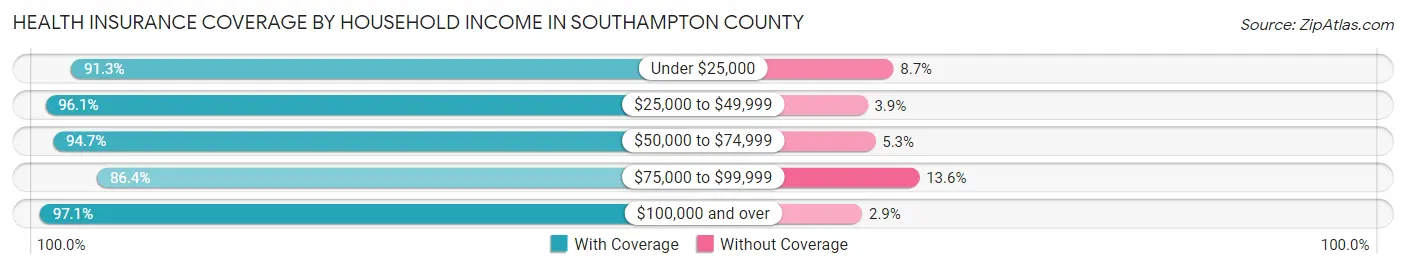
| Household Income | With Coverage | Without Coverage |
| Under $25,000 | 1,434 (91.3%) | 137 (8.7%) |
| $25,000 to $49,999 | 2,883 (96.1%) | 116 (3.9%) |
| $50,000 to $74,999 | 2,215 (94.7%) | 125 (5.3%) |
| $75,000 to $99,999 | 2,783 (86.4%) | 437 (13.6%) |
| $100,000 and over | 6,289 (97.1%) | 185 (2.9%) |
Public vs Private Health Insurance Coverage by Age in Southampton County
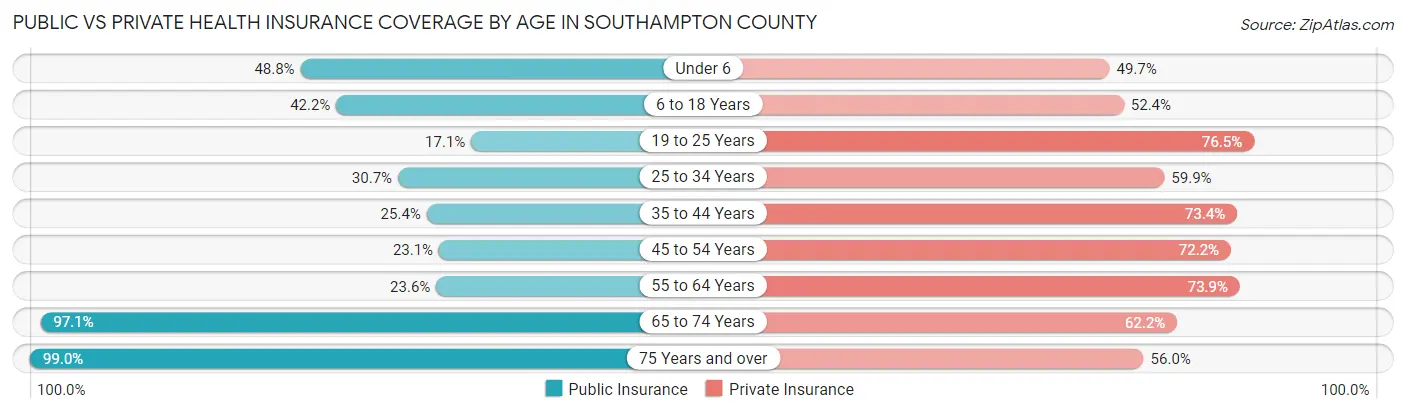
| Age Bracket | Public Insurance | Private Insurance |
| Under 6 | 488 (48.8%) | 497 (49.7%) |
| 6 to 18 Years | 1,105 (42.2%) | 1,372 (52.3%) |
| 19 to 25 Years | 204 (17.1%) | 912 (76.5%) |
| 25 to 34 Years | 457 (30.7%) | 891 (59.9%) |
| 35 to 44 Years | 428 (25.4%) | 1,238 (73.4%) |
| 45 to 54 Years | 576 (23.1%) | 1,802 (72.2%) |
| 55 to 64 Years | 619 (23.6%) | 1,937 (73.9%) |
| 65 to 74 Years | 2,031 (97.1%) | 1,302 (62.2%) |
| 75 Years and over | 1,403 (99.0%) | 794 (56.0%) |
| Total | 7,311 (44.0%) | 10,745 (64.7%) |
Disability Status by Sex by Age in Southampton County
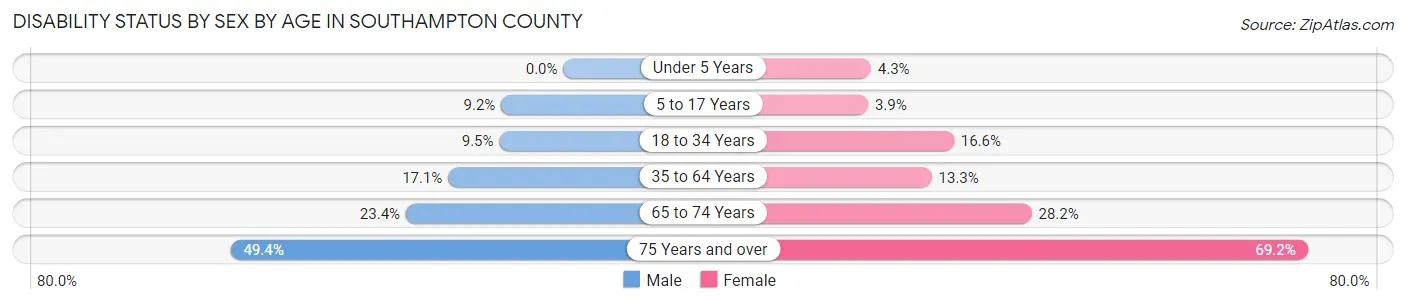
| Age Bracket | Male | Female |
| Under 5 Years | 0 (0.0%) | 18 (4.3%) |
| 5 to 17 Years | 123 (9.2%) | 50 (3.9%) |
| 18 to 34 Years | 134 (9.5%) | 235 (16.6%) |
| 35 to 64 Years | 588 (17.1%) | 449 (13.3%) |
| 65 to 74 Years | 241 (23.4%) | 299 (28.2%) |
| 75 Years and over | 298 (49.4%) | 563 (69.2%) |
Disability Class by Sex by Age in Southampton County
Disability Class: Hearing Difficulty
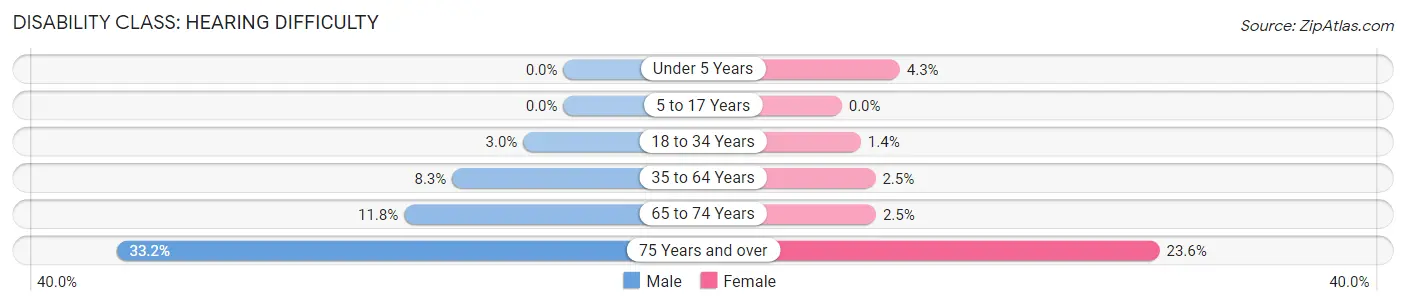
| Age Bracket | Male | Female |
| Under 5 Years | 0 (0.0%) | 18 (4.3%) |
| 5 to 17 Years | 0 (0.0%) | 0 (0.0%) |
| 18 to 34 Years | 42 (3.0%) | 20 (1.4%) |
| 35 to 64 Years | 284 (8.3%) | 84 (2.5%) |
| 65 to 74 Years | 122 (11.8%) | 27 (2.5%) |
| 75 Years and over | 200 (33.2%) | 192 (23.6%) |
Disability Class: Vision Difficulty
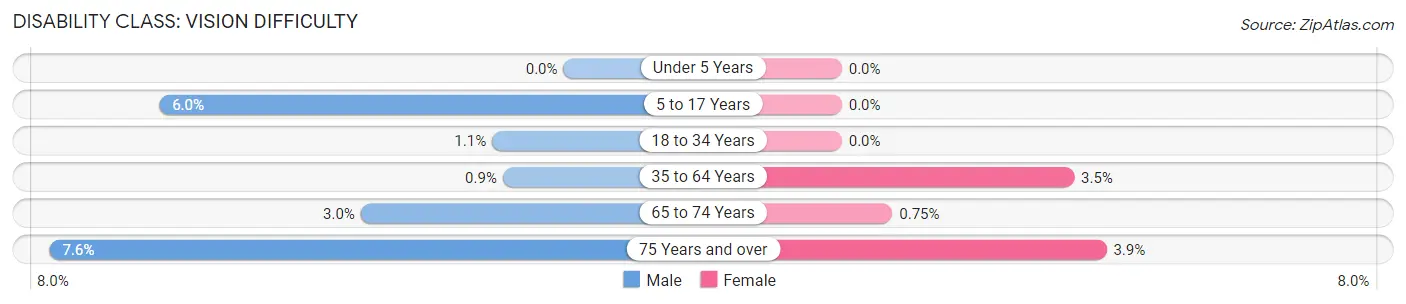
| Age Bracket | Male | Female |
| Under 5 Years | 0 (0.0%) | 0 (0.0%) |
| 5 to 17 Years | 80 (6.0%) | 0 (0.0%) |
| 18 to 34 Years | 15 (1.1%) | 0 (0.0%) |
| 35 to 64 Years | 31 (0.9%) | 116 (3.5%) |
| 65 to 74 Years | 31 (3.0%) | 8 (0.7%) |
| 75 Years and over | 46 (7.6%) | 32 (3.9%) |
Disability Class: Cognitive Difficulty
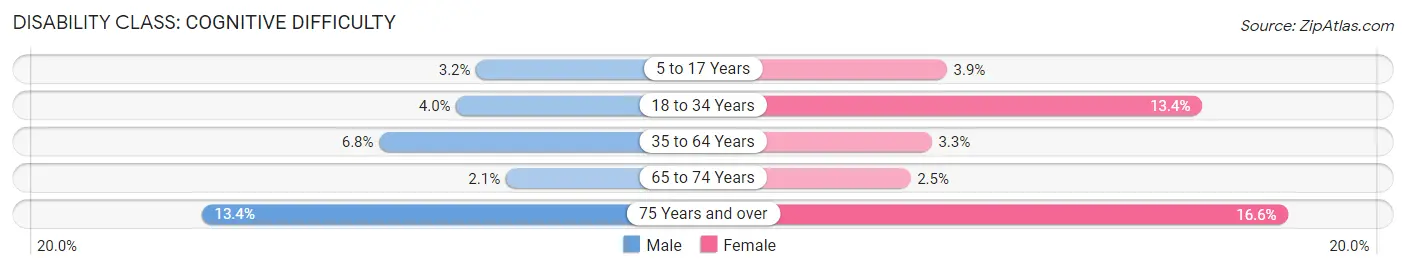
| Age Bracket | Male | Female |
| 5 to 17 Years | 43 (3.2%) | 50 (3.9%) |
| 18 to 34 Years | 56 (4.0%) | 189 (13.4%) |
| 35 to 64 Years | 235 (6.8%) | 112 (3.3%) |
| 65 to 74 Years | 22 (2.1%) | 27 (2.5%) |
| 75 Years and over | 81 (13.4%) | 135 (16.6%) |
Disability Class: Ambulatory Difficulty
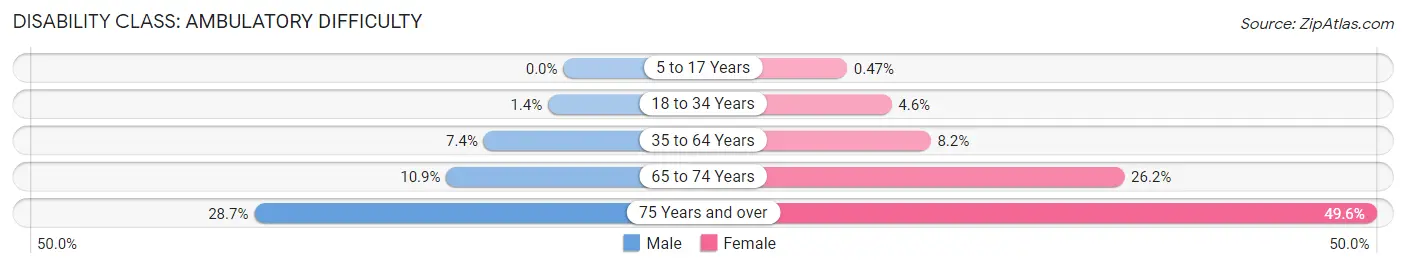
| Age Bracket | Male | Female |
| 5 to 17 Years | 0 (0.0%) | 6 (0.5%) |
| 18 to 34 Years | 20 (1.4%) | 65 (4.6%) |
| 35 to 64 Years | 254 (7.4%) | 277 (8.2%) |
| 65 to 74 Years | 112 (10.9%) | 278 (26.2%) |
| 75 Years and over | 173 (28.7%) | 404 (49.6%) |
Disability Class: Self-Care Difficulty
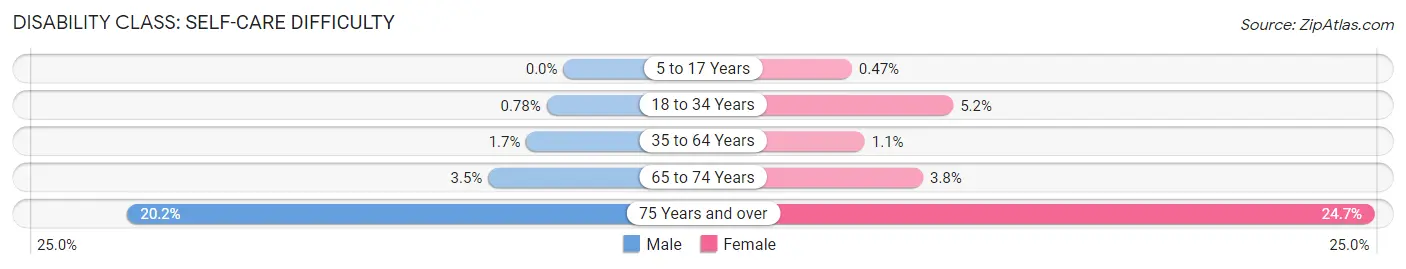
| Age Bracket | Male | Female |
| 5 to 17 Years | 0 (0.0%) | 6 (0.5%) |
| 18 to 34 Years | 11 (0.8%) | 73 (5.2%) |
| 35 to 64 Years | 59 (1.7%) | 36 (1.1%) |
| 65 to 74 Years | 36 (3.5%) | 40 (3.8%) |
| 75 Years and over | 122 (20.2%) | 201 (24.7%) |
Technology Access in Southampton County
Computing Device Access in Southampton County
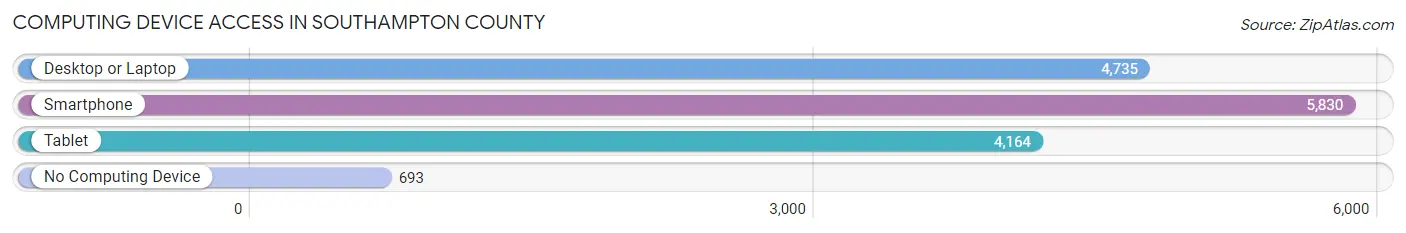
| Device Type | # Households | % Households |
| Desktop or Laptop | 4,735 | 69.2% |
| Smartphone | 5,830 | 85.2% |
| Tablet | 4,164 | 60.9% |
| No Computing Device | 693 | 10.1% |
| Total | 6,841 | 100.0% |
Internet Access in Southampton County
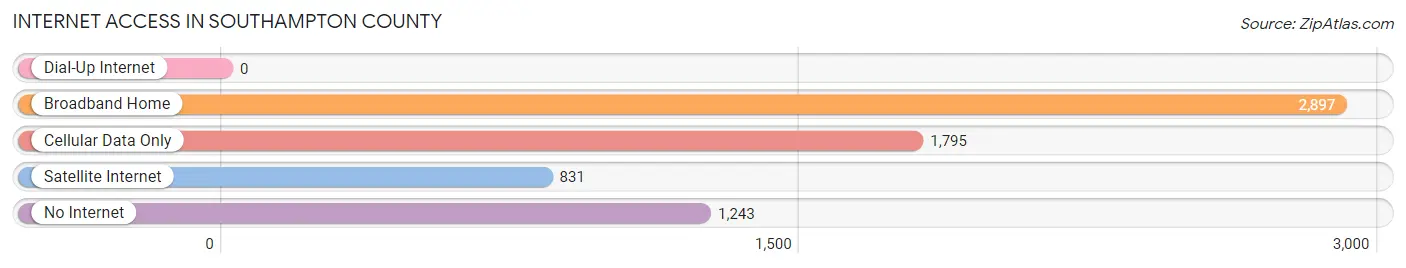
| Internet Type | # Households | % Households |
| Dial-Up Internet | 0 | 0.0% |
| Broadband Home | 2,897 | 42.3% |
| Cellular Data Only | 1,795 | 26.2% |
| Satellite Internet | 831 | 12.1% |
| No Internet | 1,243 | 18.2% |
| Total | 6,841 | 100.0% |
Southampton County Summary
Southampton County is a county located in the Commonwealth of Virginia. It is located in the southeastern part of the state, and is bordered by the cities of Franklin, Suffolk, and Emporia. The county seat is Courtland. As of the 2010 census, the population was 18,570.
Geography
Southampton County is located in the southeastern part of Virginia, and is bordered by the cities of Franklin, Suffolk, and Emporia. The county is located in the Coastal Plain region of Virginia, and is mostly flat with some rolling hills. The county is drained by the Nottoway River, which flows through the county from north to south. The county is also home to several lakes, including Lake Drummond, Lake Meade, and Lake Gaston.
The county has a total area of 545 square miles, of which 543 square miles is land and 2.2 square miles is water.
History
Southampton County was formed in 1749 from Isle of Wight County. It was named for Henry Wriothesley, 3rd Earl of Southampton, who was a patron of the Virginia Company of London. The county was originally part of the Nansemond Indian Reservation, which was established in 1646.
The county was the site of several battles during the American Civil War, including the Battle of Jerusalem Plank Road and the Battle of Drewry's Bluff.
Economy
Southampton County is a rural county with a primarily agricultural economy. The county is home to several large farms, including the Smithfield Foods hog farm, which is the largest hog farm in the United States. The county is also home to several large timber companies, including Weyerhaeuser and International Paper.
The county is home to several manufacturing companies, including the Southampton County Industrial Park, which is home to several companies, including a Pepsi bottling plant and a Tyson Foods poultry processing plant.
The county is also home to several retail businesses, including several antique stores, a Walmart Supercenter, and several restaurants.
Demographics
As of the 2010 census, there were 18,570 people, 6,945 households, and 4,945 families living in the county. The population density was 34.2 people per square mile. The racial makeup of the county was 68.3% White, 28.2% Black or African American, 0.3% Native American, 0.3% Asian, 0.1% Pacific Islander, 0.7% from other races, and 1.4% from two or more races.
The median income for a household in the county was $35,945, and the median income for a family was $43,945. The per capita income for the county was $17,945. About 17.3% of families and 21.2% of the population were below the poverty line, including 28.2% of those under age 18 and 16.2% of those age 65 or over.
Common Questions
What is Per Capita Income in Southampton County?
Per Capita income in Southampton County is $32,218.
What is the Median Family Income in Southampton County?
Median Family Income in Southampton County is $86,596.
What is the Median Household income in Southampton County?
Median Household Income in Southampton County is $67,813.
What is Income or Wage Gap in Southampton County?
Income or Wage Gap in Southampton County is 22.4%.
Women in Southampton County earn 77.6 cents for every dollar earned by a man.
What is Inequality or Gini Index in Southampton County?
Inequality or Gini Index in Southampton County is 0.41.
What is the Total Population of Southampton County?
Total Population of Southampton County is 18,003.
What is the Total Male Population of Southampton County?
Total Male Population of Southampton County is 9,450.
What is the Total Female Population of Southampton County?
Total Female Population of Southampton County is 8,553.
What is the Ratio of Males per 100 Females in Southampton County?
There are 110.49 Males per 100 Females in Southampton County.
What is the Ratio of Females per 100 Males in Southampton County?
There are 90.51 Females per 100 Males in Southampton County.
What is the Median Population Age in Southampton County?
Median Population Age in Southampton County is 47.0 Years.
What is the Average Family Size in Southampton County
Average Family Size in Southampton County is 3.0 People.
What is the Average Household Size in Southampton County
Average Household Size in Southampton County is 2.4 People.
How Large is the Labor Force in Southampton County?
There are 8,343 People in the Labor Forcein in Southampton County.
What is the Percentage of People in the Labor Force in Southampton County?
55.9% of People are in the Labor Force in Southampton County.
What is the Unemployment Rate in Southampton County?
Unemployment Rate in Southampton County is 5.5%.